

Key Insights
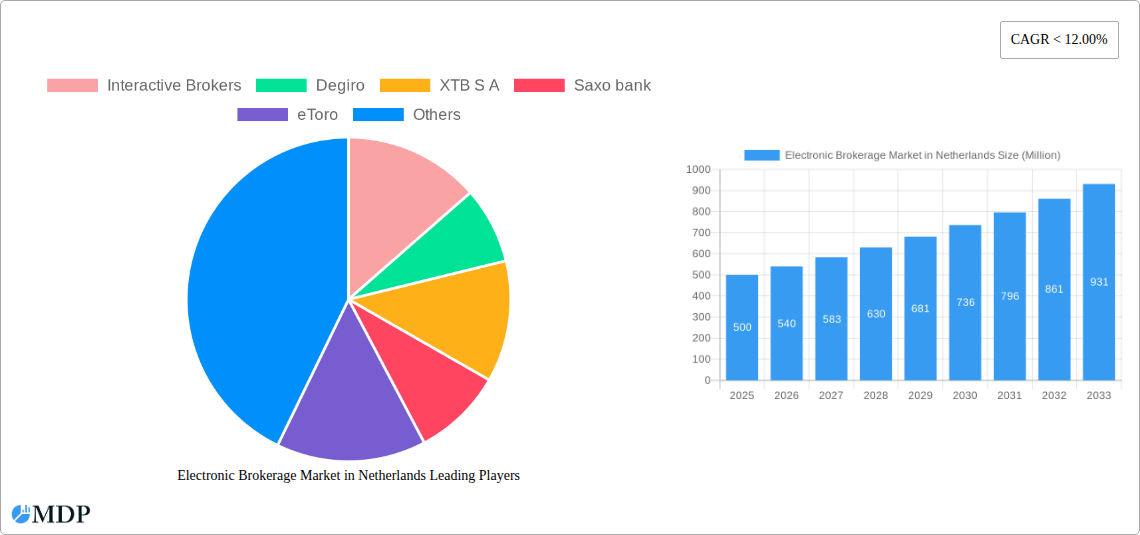
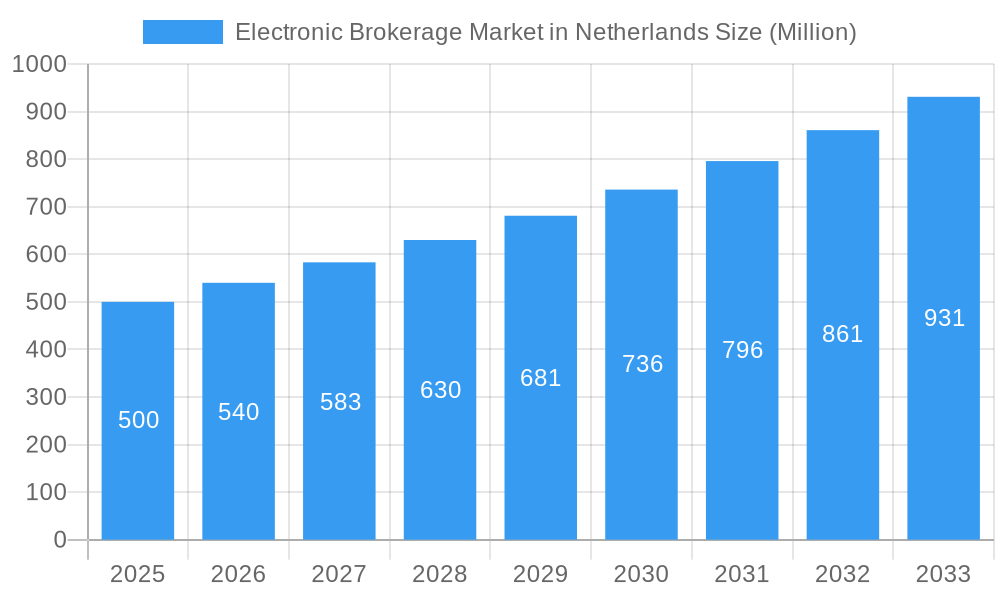
The Netherlands electronic brokerage market is exhibiting strong expansion, propelled by heightened digital investor engagement and the escalating adoption of online trading platforms. The market is projected to reach $1.12 billion by 2024, reflecting a Compound Annual Growth Rate (CAGR) of 7.3% from 2019-2024. This growth is attributed to advancements in mobile trading, expanded online investment product offerings, and government-led financial inclusion efforts. The forecast period (2025-2033) anticipates continued robust growth as key market participants prioritize enhanced user interfaces, strengthened security measures, and AI-driven personalized investment advice. The evolution of sophisticated trading algorithms and the proliferation of robo-advisors will further stimulate market development.
Electronic Brokerage Market in Netherlands Market Size (In Billion)
Regulatory shifts and amplified investor education are also shaping the market. More stringent investor protection regulations may foster market consolidation, benefiting established firms with strong compliance. Concurrently, increased awareness and education surrounding online trading are poised to attract a broader base of retail investors, driving further market expansion. Brokerage firms that deliver secure, intuitive, and innovative platforms catering to a spectrum of investor needs will be critical to market success. The integration of advanced technologies and data analytics is essential for maintaining a competitive advantage. The market's outlook is promising, characterized by ongoing innovation and growth.
Electronic Brokerage Market in Netherlands Company Market Share
Electronic Brokerage Market in Netherlands: A Comprehensive Analysis (2019-2033)
This insightful report provides a detailed analysis of the Electronic Brokerage Market in the Netherlands, covering market dynamics, industry trends, leading players, and future growth prospects from 2019 to 2033. With a focus on key players like Interactive Brokers, Degiro, XTB S A, Saxo Bank, and eToro, this report is essential for industry stakeholders, investors, and anyone seeking a comprehensive understanding of this dynamic market. The report leverages extensive data analysis to offer actionable insights and forecasts for the forecast period (2025-2033), with 2025 as the base year.
Electronic Brokerage Market in Netherlands Market Dynamics & Concentration
The Netherlands' electronic brokerage market exhibits a moderately concentrated landscape, with a few major players commanding significant market share. Market concentration is influenced by factors such as regulatory frameworks, technological innovation, and the presence of established international players. Mergers and acquisitions (M&A) have played a significant role in shaping market dynamics. For instance, the 2020 acquisition of DEGIRO by Flatex demonstrates the ongoing consolidation within the sector.
- Market Share: Degiro holds an estimated xx% market share in 2025, followed by Interactive Brokers at xx% and XTB SA at xx%. The remaining market share is distributed among numerous smaller players.
- M&A Activity: The number of M&A deals in the Netherlands electronic brokerage market averaged xx per year during the historical period (2019-2024), indicating a dynamic and evolving competitive landscape.
- Innovation Drivers: Technological advancements such as AI-powered trading platforms and the increasing adoption of mobile trading apps are key drivers of innovation and market growth.
- Regulatory Framework: The regulatory environment plays a crucial role in shaping market dynamics. The Dutch regulatory authority, De Nederlandsche Bank (DNB), actively oversees the market, impacting licensing, compliance, and overall market structure.
- Product Substitutes: The rise of robo-advisors and other automated investment platforms presents a growing alternative to traditional electronic brokerage services, impacting market share for traditional players.
- End-User Trends: The increasing adoption of online trading among retail investors, driven by factors such as increased financial literacy and technological proficiency, is a major factor influencing market expansion.
Electronic Brokerage Market in Netherlands Industry Trends & Analysis
The Netherlands' electronic brokerage market experienced a Compound Annual Growth Rate (CAGR) of xx% during the historical period (2019-2024). Market penetration among the Dutch population is estimated at xx% in 2025, indicating significant growth potential. Technological disruptions, such as the increasing use of blockchain technology and cryptocurrencies, are reshaping the industry. Consumer preferences are shifting towards user-friendly platforms with advanced trading tools and comprehensive investment options. The market is characterized by intense competition, with players constantly seeking to differentiate themselves through innovative offerings and competitive pricing. Scalable Capital's expansion into the Netherlands in September 2022 exemplifies this trend, highlighting the growing attractiveness of the Dutch market for international players.
Leading Markets & Segments in Electronic Brokerage Market in Netherlands
The retail segment dominates the Netherlands electronic brokerage market, fueled by the growing number of individual investors embracing online trading.
- Key Drivers for Retail Dominance:
- Increased Financial Literacy: Improved financial education among the Dutch population is leading to greater participation in the stock market.
- Technological Advancement: User-friendly platforms and mobile trading apps make investing accessible to a wider audience.
- Favorable Economic Conditions: A generally stable economy and favorable investment climate encourage participation in the market.
The Amsterdam region represents the most significant market within the Netherlands, owing to its established financial infrastructure and concentration of high-net-worth individuals. Other regions are experiencing growth, but Amsterdam retains a considerable lead due to established infrastructure and market concentration.
Electronic Brokerage Market in Netherlands Product Developments
Recent product innovations have focused on enhancing user experience, improving trading tools, and expanding the range of available investment products. Platforms are incorporating AI-driven features for personalized investment advice and risk management. The integration of cryptocurrencies and other digital assets is also a significant trend, catering to the growing interest in these asset classes. Competitive advantages are derived through superior technology, competitive pricing, and exceptional customer service.
Key Drivers of Electronic Brokerage Market in Netherlands Growth
Several key factors are driving growth in the Netherlands' electronic brokerage market. Technological advancements are making online trading more accessible and convenient. The rising number of digitally savvy retail investors is expanding the customer base. Moreover, favorable regulatory conditions and a robust economy encourage market expansion.
Challenges in the Electronic Brokerage Market in Netherlands Market
The market faces challenges such as intense competition, the need for continuous technological upgrades to maintain competitiveness, and adapting to evolving regulatory requirements. Cybersecurity threats and the need to comply with stringent data privacy regulations are also significant hurdles. The ongoing threat of market volatility also poses a challenge to investor confidence.
Emerging Opportunities in Electronic Brokerage Market in Netherlands
The increasing popularity of sustainable investments and growing interest in alternative assets like cryptocurrencies present significant opportunities for growth. Strategic partnerships with fintech companies and expansion into underserved markets within the Netherlands can provide further growth avenues. The development and adoption of innovative financial technologies (FinTech) will also generate new opportunities for market expansion.
Leading Players in the Electronic Brokerage Market in Netherlands Sector
- Interactive Brokers
- Degiro
- XTB S A
- Saxo Bank
- eToro
- Euronext Group
- LYNX
- IC Markets
- RoboForex
- FP Markets
- List Not Exhaustive
Key Milestones in Electronic Brokerage Market in Netherlands Industry
- September 2022: Scalable Capital expands into the Netherlands, offering ETFs, stocks, cryptocurrencies, and mutual funds. This significantly increases competition and product diversity in the market.
- 2020: Flatex acquires 100% of DEGIRO, consolidating market share and signaling further industry consolidation. This event dramatically altered the market landscape.
Strategic Outlook for Electronic Brokerage Market in Netherlands Market
The Netherlands' electronic brokerage market shows significant long-term growth potential, driven by technological innovation, increasing investor participation, and favorable economic conditions. Strategic partnerships, expansion into niche markets, and the adoption of advanced technologies will be critical for success in this dynamic and competitive market. The market will likely see further consolidation as players strive to achieve scale and efficiency.
Electronic Brokerage Market in Netherlands Segmentation
-
1. Investor Type
- 1.1. Retail
- 1.2. Institutional
-
2. Services Provided
- 2.1. Full Time Brokers
- 2.2. Discount Brokers
-
3. Operation
- 3.1. Domestic
- 3.2. International
Electronic Brokerage Market in Netherlands Segmentation By Geography
-
1. North America
- 1.1. United States
- 1.2. Canada
- 1.3. Mexico
-
2. South America
- 2.1. Brazil
- 2.2. Argentina
- 2.3. Rest of South America
-
3. Europe
- 3.1. United Kingdom
- 3.2. Germany
- 3.3. France
- 3.4. Italy
- 3.5. Spain
- 3.6. Russia
- 3.7. Benelux
- 3.8. Nordics
- 3.9. Rest of Europe
-
4. Middle East & Africa
- 4.1. Turkey
- 4.2. Israel
- 4.3. GCC
- 4.4. North Africa
- 4.5. South Africa
- 4.6. Rest of Middle East & Africa
-
5. Asia Pacific
- 5.1. China
- 5.2. India
- 5.3. Japan
- 5.4. South Korea
- 5.5. ASEAN
- 5.6. Oceania
- 5.7. Rest of Asia Pacific
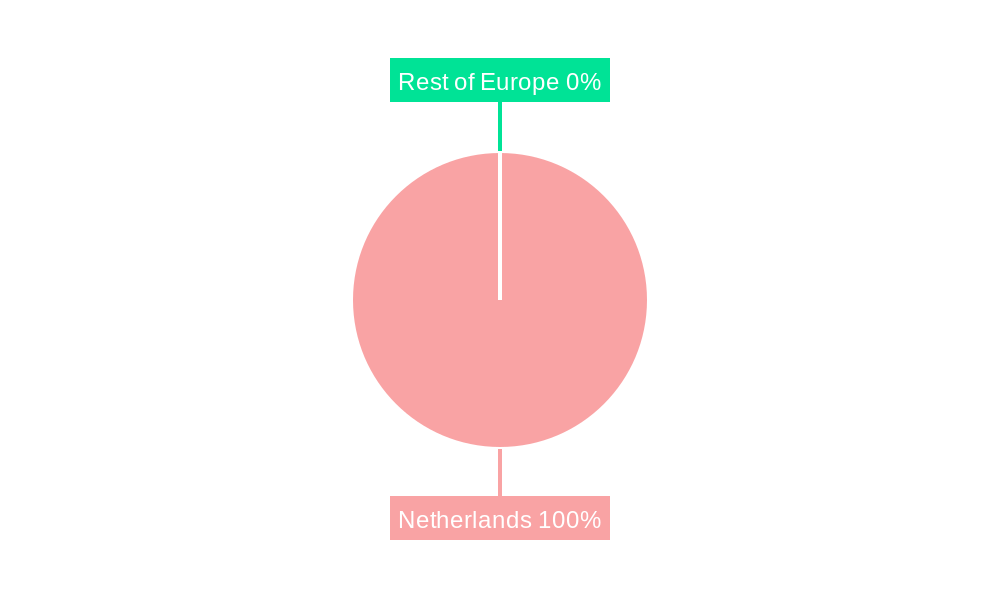
Electronic Brokerage Market in Netherlands Regional Market Share
Geographic Coverage of Electronic Brokerage Market in Netherlands
Electronic Brokerage Market in Netherlands REPORT HIGHLIGHTS
| Aspects | Details |
|---|---|
| Study Period | 2020-2034 |
| Base Year | 2025 |
| Estimated Year | 2026 |
| Forecast Period | 2026-2034 |
| Historical Period | 2020-2025 |
| Growth Rate | CAGR of 7.3% from 2020-2034 |
| Segmentation |
|
Table of Contents
- 1. Introduction
- 1.1. Research Scope
- 1.2. Market Segmentation
- 1.3. Research Objective
- 1.4. Definitions and Assumptions
- 2. Executive Summary
- 2.1. Market Snapshot
- 3. Market Dynamics
- 3.1. Market Drivers
- 3.2. Market Restrains
- 3.3. Market Trends
- 3.4. Market Opportunities
- 4. Market Factor Analysis
- 4.1. Porters Five Forces
- 4.1.1. Bargaining Power of Suppliers
- 4.1.2. Bargaining Power of Buyers
- 4.1.3. Threat of New Entrants
- 4.1.4. Threat of Substitutes
- 4.1.5. Competitive Rivalry
- 4.2. PESTEL analysis
- 4.3. BCG Analysis
- 4.3.1. Stars (High Growth, High Market Share)
- 4.3.2. Cash Cows (Low Growth, High Market Share)
- 4.3.3. Question Mark (High Growth, Low Market Share)
- 4.3.4. Dogs (Low Growth, Low Market Share)
- 4.4. Ansoff Matrix Analysis
- 4.5. Supply Chain Analysis
- 4.6. Regulatory Landscape
- 4.7. Current Market Potential and Opportunity Assessment (TAM–SAM–SOM Framework)
- 4.8. MDP Analyst Note
- 4.1. Porters Five Forces
- 5. Market Analysis, Insights and Forecast 2021-2033
- 5.1. Market Analysis, Insights and Forecast - by Investor Type
- 5.1.1. Retail
- 5.1.2. Institutional
- 5.2. Market Analysis, Insights and Forecast - by Services Provided
- 5.2.1. Full Time Brokers
- 5.2.2. Discount Brokers
- 5.3. Market Analysis, Insights and Forecast - by Operation
- 5.3.1. Domestic
- 5.3.2. International
- 5.4. Market Analysis, Insights and Forecast - by Region
- 5.4.1. North America
- 5.4.2. South America
- 5.4.3. Europe
- 5.4.4. Middle East & Africa
- 5.4.5. Asia Pacific
- 5.1. Market Analysis, Insights and Forecast - by Investor Type
- 6. Global Electronic Brokerage Market in Netherlands Analysis, Insights and Forecast, 2021-2033
- 6.1. Market Analysis, Insights and Forecast - by Investor Type
- 6.1.1. Retail
- 6.1.2. Institutional
- 6.2. Market Analysis, Insights and Forecast - by Services Provided
- 6.2.1. Full Time Brokers
- 6.2.2. Discount Brokers
- 6.3. Market Analysis, Insights and Forecast - by Operation
- 6.3.1. Domestic
- 6.3.2. International
- 6.1. Market Analysis, Insights and Forecast - by Investor Type
- 7. North America Electronic Brokerage Market in Netherlands Analysis, Insights and Forecast, 2020-2032
- 7.1. Market Analysis, Insights and Forecast - by Investor Type
- 7.1.1. Retail
- 7.1.2. Institutional
- 7.2. Market Analysis, Insights and Forecast - by Services Provided
- 7.2.1. Full Time Brokers
- 7.2.2. Discount Brokers
- 7.3. Market Analysis, Insights and Forecast - by Operation
- 7.3.1. Domestic
- 7.3.2. International
- 7.1. Market Analysis, Insights and Forecast - by Investor Type
- 8. South America Electronic Brokerage Market in Netherlands Analysis, Insights and Forecast, 2020-2032
- 8.1. Market Analysis, Insights and Forecast - by Investor Type
- 8.1.1. Retail
- 8.1.2. Institutional
- 8.2. Market Analysis, Insights and Forecast - by Services Provided
- 8.2.1. Full Time Brokers
- 8.2.2. Discount Brokers
- 8.3. Market Analysis, Insights and Forecast - by Operation
- 8.3.1. Domestic
- 8.3.2. International
- 8.1. Market Analysis, Insights and Forecast - by Investor Type
- 9. Europe Electronic Brokerage Market in Netherlands Analysis, Insights and Forecast, 2020-2032
- 9.1. Market Analysis, Insights and Forecast - by Investor Type
- 9.1.1. Retail
- 9.1.2. Institutional
- 9.2. Market Analysis, Insights and Forecast - by Services Provided
- 9.2.1. Full Time Brokers
- 9.2.2. Discount Brokers
- 9.3. Market Analysis, Insights and Forecast - by Operation
- 9.3.1. Domestic
- 9.3.2. International
- 9.1. Market Analysis, Insights and Forecast - by Investor Type
- 10. Middle East & Africa Electronic Brokerage Market in Netherlands Analysis, Insights and Forecast, 2020-2032
- 10.1. Market Analysis, Insights and Forecast - by Investor Type
- 10.1.1. Retail
- 10.1.2. Institutional
- 10.2. Market Analysis, Insights and Forecast - by Services Provided
- 10.2.1. Full Time Brokers
- 10.2.2. Discount Brokers
- 10.3. Market Analysis, Insights and Forecast - by Operation
- 10.3.1. Domestic
- 10.3.2. International
- 10.1. Market Analysis, Insights and Forecast - by Investor Type
- 11. Asia Pacific Electronic Brokerage Market in Netherlands Analysis, Insights and Forecast, 2020-2032
- 11.1. Market Analysis, Insights and Forecast - by Investor Type
- 11.1.1. Retail
- 11.1.2. Institutional
- 11.2. Market Analysis, Insights and Forecast - by Services Provided
- 11.2.1. Full Time Brokers
- 11.2.2. Discount Brokers
- 11.3. Market Analysis, Insights and Forecast - by Operation
- 11.3.1. Domestic
- 11.3.2. International
- 11.1. Market Analysis, Insights and Forecast - by Investor Type
- 12. Competitive Analysis
- 12.1. Company Profiles
- 12.1.1 Interactive Brokers
- 12.1.1.1. Company Overview
- 12.1.1.2. Products
- 12.1.1.3. Company Financials
- 12.1.1.4. SWOT Analysis
- 12.1.2 Degiro
- 12.1.2.1. Company Overview
- 12.1.2.2. Products
- 12.1.2.3. Company Financials
- 12.1.2.4. SWOT Analysis
- 12.1.3 XTB S A
- 12.1.3.1. Company Overview
- 12.1.3.2. Products
- 12.1.3.3. Company Financials
- 12.1.3.4. SWOT Analysis
- 12.1.4 Saxo bank
- 12.1.4.1. Company Overview
- 12.1.4.2. Products
- 12.1.4.3. Company Financials
- 12.1.4.4. SWOT Analysis
- 12.1.5 eToro
- 12.1.5.1. Company Overview
- 12.1.5.2. Products
- 12.1.5.3. Company Financials
- 12.1.5.4. SWOT Analysis
- 12.1.6 Euronext Group
- 12.1.6.1. Company Overview
- 12.1.6.2. Products
- 12.1.6.3. Company Financials
- 12.1.6.4. SWOT Analysis
- 12.1.7 LYNX
- 12.1.7.1. Company Overview
- 12.1.7.2. Products
- 12.1.7.3. Company Financials
- 12.1.7.4. SWOT Analysis
- 12.1.8 IC Markets
- 12.1.8.1. Company Overview
- 12.1.8.2. Products
- 12.1.8.3. Company Financials
- 12.1.8.4. SWOT Analysis
- 12.1.9 RoboForex
- 12.1.9.1. Company Overview
- 12.1.9.2. Products
- 12.1.9.3. Company Financials
- 12.1.9.4. SWOT Analysis
- 12.1.10 FP Markets**List Not Exhaustive
- 12.1.10.1. Company Overview
- 12.1.10.2. Products
- 12.1.10.3. Company Financials
- 12.1.10.4. SWOT Analysis
- 12.1.1 Interactive Brokers
- 12.2. Market Entropy
- 12.2.1 Company's Key Areas Served
- 12.2.2 Recent Developments
- 12.3. Company Market Share Analysis 2025
- 12.3.1 Top 5 Companies Market Share Analysis
- 12.3.2 Top 3 Companies Market Share Analysis
- 12.4. List of Potential Customers
- 13. Research Methodology
List of Figures
- Figure 1: Global Electronic Brokerage Market in Netherlands Revenue Breakdown (billion, %) by Region 2025 & 2033
- Figure 2: North America Electronic Brokerage Market in Netherlands Revenue (billion), by Investor Type 2025 & 2033
- Figure 3: North America Electronic Brokerage Market in Netherlands Revenue Share (%), by Investor Type 2025 & 2033
- Figure 4: North America Electronic Brokerage Market in Netherlands Revenue (billion), by Services Provided 2025 & 2033
- Figure 5: North America Electronic Brokerage Market in Netherlands Revenue Share (%), by Services Provided 2025 & 2033
- Figure 6: North America Electronic Brokerage Market in Netherlands Revenue (billion), by Operation 2025 & 2033
- Figure 7: North America Electronic Brokerage Market in Netherlands Revenue Share (%), by Operation 2025 & 2033
- Figure 8: North America Electronic Brokerage Market in Netherlands Revenue (billion), by Country 2025 & 2033
- Figure 9: North America Electronic Brokerage Market in Netherlands Revenue Share (%), by Country 2025 & 2033
- Figure 10: South America Electronic Brokerage Market in Netherlands Revenue (billion), by Investor Type 2025 & 2033
- Figure 11: South America Electronic Brokerage Market in Netherlands Revenue Share (%), by Investor Type 2025 & 2033
- Figure 12: South America Electronic Brokerage Market in Netherlands Revenue (billion), by Services Provided 2025 & 2033
- Figure 13: South America Electronic Brokerage Market in Netherlands Revenue Share (%), by Services Provided 2025 & 2033
- Figure 14: South America Electronic Brokerage Market in Netherlands Revenue (billion), by Operation 2025 & 2033
- Figure 15: South America Electronic Brokerage Market in Netherlands Revenue Share (%), by Operation 2025 & 2033
- Figure 16: South America Electronic Brokerage Market in Netherlands Revenue (billion), by Country 2025 & 2033
- Figure 17: South America Electronic Brokerage Market in Netherlands Revenue Share (%), by Country 2025 & 2033
- Figure 18: Europe Electronic Brokerage Market in Netherlands Revenue (billion), by Investor Type 2025 & 2033
- Figure 19: Europe Electronic Brokerage Market in Netherlands Revenue Share (%), by Investor Type 2025 & 2033
- Figure 20: Europe Electronic Brokerage Market in Netherlands Revenue (billion), by Services Provided 2025 & 2033
- Figure 21: Europe Electronic Brokerage Market in Netherlands Revenue Share (%), by Services Provided 2025 & 2033
- Figure 22: Europe Electronic Brokerage Market in Netherlands Revenue (billion), by Operation 2025 & 2033
- Figure 23: Europe Electronic Brokerage Market in Netherlands Revenue Share (%), by Operation 2025 & 2033
- Figure 24: Europe Electronic Brokerage Market in Netherlands Revenue (billion), by Country 2025 & 2033
- Figure 25: Europe Electronic Brokerage Market in Netherlands Revenue Share (%), by Country 2025 & 2033
- Figure 26: Middle East & Africa Electronic Brokerage Market in Netherlands Revenue (billion), by Investor Type 2025 & 2033
- Figure 27: Middle East & Africa Electronic Brokerage Market in Netherlands Revenue Share (%), by Investor Type 2025 & 2033
- Figure 28: Middle East & Africa Electronic Brokerage Market in Netherlands Revenue (billion), by Services Provided 2025 & 2033
- Figure 29: Middle East & Africa Electronic Brokerage Market in Netherlands Revenue Share (%), by Services Provided 2025 & 2033
- Figure 30: Middle East & Africa Electronic Brokerage Market in Netherlands Revenue (billion), by Operation 2025 & 2033
- Figure 31: Middle East & Africa Electronic Brokerage Market in Netherlands Revenue Share (%), by Operation 2025 & 2033
- Figure 32: Middle East & Africa Electronic Brokerage Market in Netherlands Revenue (billion), by Country 2025 & 2033
- Figure 33: Middle East & Africa Electronic Brokerage Market in Netherlands Revenue Share (%), by Country 2025 & 2033
- Figure 34: Asia Pacific Electronic Brokerage Market in Netherlands Revenue (billion), by Investor Type 2025 & 2033
- Figure 35: Asia Pacific Electronic Brokerage Market in Netherlands Revenue Share (%), by Investor Type 2025 & 2033
- Figure 36: Asia Pacific Electronic Brokerage Market in Netherlands Revenue (billion), by Services Provided 2025 & 2033
- Figure 37: Asia Pacific Electronic Brokerage Market in Netherlands Revenue Share (%), by Services Provided 2025 & 2033
- Figure 38: Asia Pacific Electronic Brokerage Market in Netherlands Revenue (billion), by Operation 2025 & 2033
- Figure 39: Asia Pacific Electronic Brokerage Market in Netherlands Revenue Share (%), by Operation 2025 & 2033
- Figure 40: Asia Pacific Electronic Brokerage Market in Netherlands Revenue (billion), by Country 2025 & 2033
- Figure 41: Asia Pacific Electronic Brokerage Market in Netherlands Revenue Share (%), by Country 2025 & 2033
List of Tables
- Table 1: Global Electronic Brokerage Market in Netherlands Revenue billion Forecast, by Investor Type 2020 & 2033
- Table 2: Global Electronic Brokerage Market in Netherlands Revenue billion Forecast, by Services Provided 2020 & 2033
- Table 3: Global Electronic Brokerage Market in Netherlands Revenue billion Forecast, by Operation 2020 & 2033
- Table 4: Global Electronic Brokerage Market in Netherlands Revenue billion Forecast, by Region 2020 & 2033
- Table 5: Global Electronic Brokerage Market in Netherlands Revenue billion Forecast, by Investor Type 2020 & 2033
- Table 6: Global Electronic Brokerage Market in Netherlands Revenue billion Forecast, by Services Provided 2020 & 2033
- Table 7: Global Electronic Brokerage Market in Netherlands Revenue billion Forecast, by Operation 2020 & 2033
- Table 8: Global Electronic Brokerage Market in Netherlands Revenue billion Forecast, by Country 2020 & 2033
- Table 9: United States Electronic Brokerage Market in Netherlands Revenue (billion) Forecast, by Application 2020 & 2033
- Table 10: Canada Electronic Brokerage Market in Netherlands Revenue (billion) Forecast, by Application 2020 & 2033
- Table 11: Mexico Electronic Brokerage Market in Netherlands Revenue (billion) Forecast, by Application 2020 & 2033
- Table 12: Global Electronic Brokerage Market in Netherlands Revenue billion Forecast, by Investor Type 2020 & 2033
- Table 13: Global Electronic Brokerage Market in Netherlands Revenue billion Forecast, by Services Provided 2020 & 2033
- Table 14: Global Electronic Brokerage Market in Netherlands Revenue billion Forecast, by Operation 2020 & 2033
- Table 15: Global Electronic Brokerage Market in Netherlands Revenue billion Forecast, by Country 2020 & 2033
- Table 16: Brazil Electronic Brokerage Market in Netherlands Revenue (billion) Forecast, by Application 2020 & 2033
- Table 17: Argentina Electronic Brokerage Market in Netherlands Revenue (billion) Forecast, by Application 2020 & 2033
- Table 18: Rest of South America Electronic Brokerage Market in Netherlands Revenue (billion) Forecast, by Application 2020 & 2033
- Table 19: Global Electronic Brokerage Market in Netherlands Revenue billion Forecast, by Investor Type 2020 & 2033
- Table 20: Global Electronic Brokerage Market in Netherlands Revenue billion Forecast, by Services Provided 2020 & 2033
- Table 21: Global Electronic Brokerage Market in Netherlands Revenue billion Forecast, by Operation 2020 & 2033
- Table 22: Global Electronic Brokerage Market in Netherlands Revenue billion Forecast, by Country 2020 & 2033
- Table 23: United Kingdom Electronic Brokerage Market in Netherlands Revenue (billion) Forecast, by Application 2020 & 2033
- Table 24: Germany Electronic Brokerage Market in Netherlands Revenue (billion) Forecast, by Application 2020 & 2033
- Table 25: France Electronic Brokerage Market in Netherlands Revenue (billion) Forecast, by Application 2020 & 2033
- Table 26: Italy Electronic Brokerage Market in Netherlands Revenue (billion) Forecast, by Application 2020 & 2033
- Table 27: Spain Electronic Brokerage Market in Netherlands Revenue (billion) Forecast, by Application 2020 & 2033
- Table 28: Russia Electronic Brokerage Market in Netherlands Revenue (billion) Forecast, by Application 2020 & 2033
- Table 29: Benelux Electronic Brokerage Market in Netherlands Revenue (billion) Forecast, by Application 2020 & 2033
- Table 30: Nordics Electronic Brokerage Market in Netherlands Revenue (billion) Forecast, by Application 2020 & 2033
- Table 31: Rest of Europe Electronic Brokerage Market in Netherlands Revenue (billion) Forecast, by Application 2020 & 2033
- Table 32: Global Electronic Brokerage Market in Netherlands Revenue billion Forecast, by Investor Type 2020 & 2033
- Table 33: Global Electronic Brokerage Market in Netherlands Revenue billion Forecast, by Services Provided 2020 & 2033
- Table 34: Global Electronic Brokerage Market in Netherlands Revenue billion Forecast, by Operation 2020 & 2033
- Table 35: Global Electronic Brokerage Market in Netherlands Revenue billion Forecast, by Country 2020 & 2033
- Table 36: Turkey Electronic Brokerage Market in Netherlands Revenue (billion) Forecast, by Application 2020 & 2033
- Table 37: Israel Electronic Brokerage Market in Netherlands Revenue (billion) Forecast, by Application 2020 & 2033
- Table 38: GCC Electronic Brokerage Market in Netherlands Revenue (billion) Forecast, by Application 2020 & 2033
- Table 39: North Africa Electronic Brokerage Market in Netherlands Revenue (billion) Forecast, by Application 2020 & 2033
- Table 40: South Africa Electronic Brokerage Market in Netherlands Revenue (billion) Forecast, by Application 2020 & 2033
- Table 41: Rest of Middle East & Africa Electronic Brokerage Market in Netherlands Revenue (billion) Forecast, by Application 2020 & 2033
- Table 42: Global Electronic Brokerage Market in Netherlands Revenue billion Forecast, by Investor Type 2020 & 2033
- Table 43: Global Electronic Brokerage Market in Netherlands Revenue billion Forecast, by Services Provided 2020 & 2033
- Table 44: Global Electronic Brokerage Market in Netherlands Revenue billion Forecast, by Operation 2020 & 2033
- Table 45: Global Electronic Brokerage Market in Netherlands Revenue billion Forecast, by Country 2020 & 2033
- Table 46: China Electronic Brokerage Market in Netherlands Revenue (billion) Forecast, by Application 2020 & 2033
- Table 47: India Electronic Brokerage Market in Netherlands Revenue (billion) Forecast, by Application 2020 & 2033
- Table 48: Japan Electronic Brokerage Market in Netherlands Revenue (billion) Forecast, by Application 2020 & 2033
- Table 49: South Korea Electronic Brokerage Market in Netherlands Revenue (billion) Forecast, by Application 2020 & 2033
- Table 50: ASEAN Electronic Brokerage Market in Netherlands Revenue (billion) Forecast, by Application 2020 & 2033
- Table 51: Oceania Electronic Brokerage Market in Netherlands Revenue (billion) Forecast, by Application 2020 & 2033
- Table 52: Rest of Asia Pacific Electronic Brokerage Market in Netherlands Revenue (billion) Forecast, by Application 2020 & 2033
Frequently Asked Questions
1. What is the projected Compound Annual Growth Rate (CAGR) of the Electronic Brokerage Market in Netherlands?
The projected CAGR is approximately 7.3%.
2. Which companies are prominent players in the Electronic Brokerage Market in Netherlands?
Key companies in the market include Interactive Brokers, Degiro, XTB S A, Saxo bank, eToro, Euronext Group, LYNX, IC Markets, RoboForex, FP Markets**List Not Exhaustive.
3. What are the main segments of the Electronic Brokerage Market in Netherlands?
The market segments include Investor Type, Services Provided, Operation.
4. Can you provide details about the market size?
The market size is estimated to be USD 1.12 billion as of 2022.
5. What are some drivers contributing to market growth?
N/A
6. What are the notable trends driving market growth?
Growing Investing Household Signifying Rising E-Brokerage in Netherlands.
7. Are there any restraints impacting market growth?
N/A
8. Can you provide examples of recent developments in the market?
In September 2022, the leading European digital invetment platform, Scalable Capital expanded its presence in the Netherlands. Its subsidiaries Scalable Crypto and Scalable Broker are providing cost-effective and convenient trading and saving plans for Dutch retail clients with products like exchange traded funds (ETFs), stocks, cryptocurrencies, and mutual funds.
9. What pricing options are available for accessing the report?
Pricing options include single-user, multi-user, and enterprise licenses priced at USD 3800, USD 4500, and USD 5800 respectively.
10. Is the market size provided in terms of value or volume?
The market size is provided in terms of value, measured in billion.
11. Are there any specific market keywords associated with the report?
Yes, the market keyword associated with the report is "Electronic Brokerage Market in Netherlands," which aids in identifying and referencing the specific market segment covered.
12. How do I determine which pricing option suits my needs best?
The pricing options vary based on user requirements and access needs. Individual users may opt for single-user licenses, while businesses requiring broader access may choose multi-user or enterprise licenses for cost-effective access to the report.
13. Are there any additional resources or data provided in the Electronic Brokerage Market in Netherlands report?
While the report offers comprehensive insights, it's advisable to review the specific contents or supplementary materials provided to ascertain if additional resources or data are available.
14. How can I stay updated on further developments or reports in the Electronic Brokerage Market in Netherlands?
To stay informed about further developments, trends, and reports in the Electronic Brokerage Market in Netherlands, consider subscribing to industry newsletters, following relevant companies and organizations, or regularly checking reputable industry news sources and publications.
Methodology
Step 1 - Identification of Relevant Samples Size from Population Database


Step 2 - Approaches for Defining Global Market Size (Value, Volume* & Price*)

Note*: In applicable scenarios
Step 3 - Data Sources
Primary Research
- Web Analytics
- Survey Reports
- Research Institute
- Latest Research Reports
- Opinion Leaders
Secondary Research
- Annual Reports
- White Paper
- Latest Press Release
- Industry Association
- Paid Database
- Investor Presentations

Step 4 - Data Triangulation
Involves using different sources of information in order to increase the validity of a study
These sources are likely to be stakeholders in a program - participants, other researchers, program staff, other community members, and so on.
Then we put all data in single framework & apply various statistical tools to find out the dynamic on the market.
During the analysis stage, feedback from the stakeholder groups would be compared to determine areas of agreement as well as areas of divergence