

Key Insights
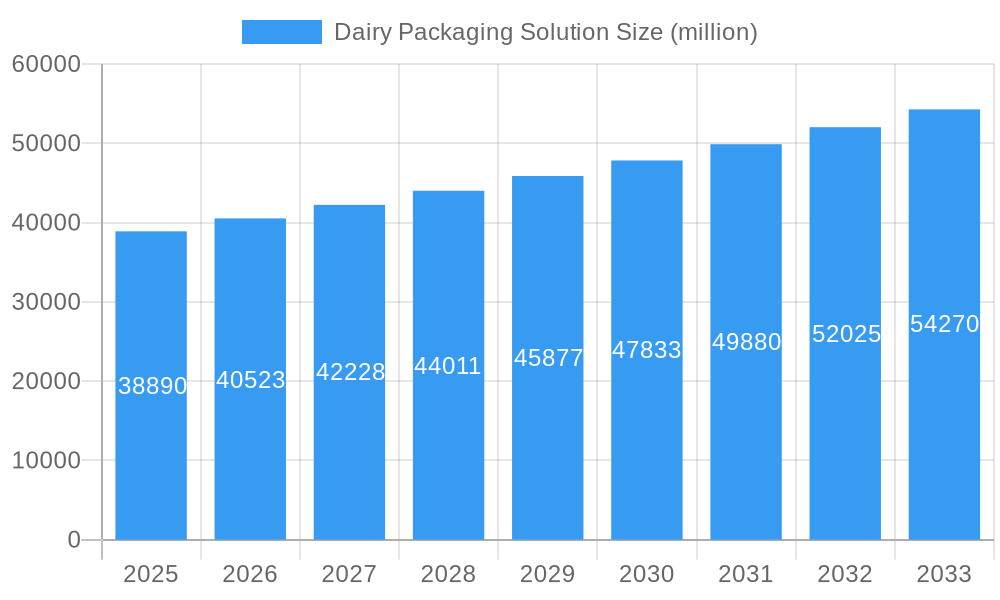
The global dairy packaging market, valued at $38.89 billion in 2025, is projected to experience steady growth, exhibiting a Compound Annual Growth Rate (CAGR) of 4.3% from 2025 to 2033. This growth is driven by several key factors. Increasing consumption of dairy products, particularly in developing economies, fuels demand for efficient and safe packaging solutions. The rising preference for convenient, single-serve packaging formats, like pouches and cups, further contributes to market expansion. Moreover, advancements in packaging technology, such as the adoption of sustainable and eco-friendly materials (like recyclable plastics and plant-based alternatives), are reshaping the market landscape. Stringent regulatory standards regarding food safety and hygiene are also prompting manufacturers to invest in advanced packaging solutions that ensure product integrity and extend shelf life. The market is segmented by application (shop, factory, others) and material type (glass, plastic). Plastic materials currently dominate due to their cost-effectiveness and versatility, but the increasing focus on sustainability is expected to drive growth in the glass and alternative sustainable materials segments. Key players like Bemis Company, Huhtamaki, Tetra Pak, and Amcor Limited are driving innovation and competition within the sector. Regional analysis indicates strong growth potential in Asia-Pacific and North America, driven by expanding dairy industries and increasing consumer disposable incomes.

Dairy Packaging Solution Market Size (In Billion)
The competitive landscape is characterized by both large multinational corporations and smaller regional players. Differentiation strategies often center on innovation in materials, design, and sustainability. While cost remains a crucial factor, brands are increasingly prioritizing the development of environmentally responsible packaging solutions to meet consumer demand for eco-friendly options. Challenges include fluctuating raw material prices and the need to maintain a balance between cost-effectiveness and sustainability. Nevertheless, the long-term outlook for the dairy packaging market remains positive, fueled by continued growth in dairy consumption and ongoing innovation within the packaging industry. Further market segmentation by specific dairy product (milk, yogurt, cheese, etc.) would provide a more granular understanding of market dynamics.
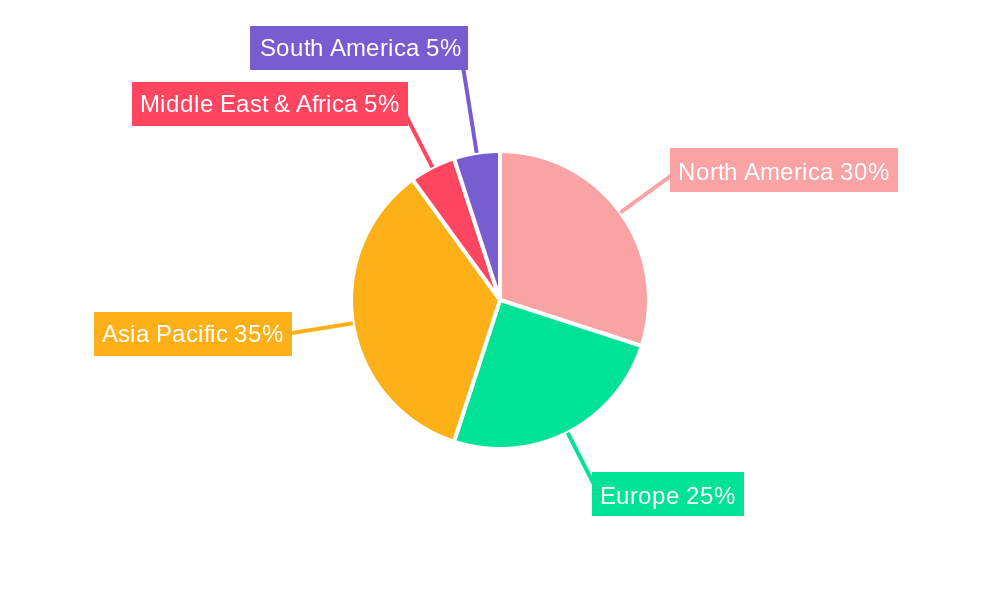
Dairy Packaging Solution Company Market Share
Dairy Packaging Solution Market Report: 2019-2033
Uncover lucrative opportunities and navigate the evolving landscape of the multi-billion dollar dairy packaging market with this comprehensive report. This in-depth analysis provides critical insights into market dynamics, leading players, and future trends, empowering businesses to make informed strategic decisions. The report covers the period 2019-2033, with a focus on the estimated year 2025 and a forecast period of 2025-2033. Key players like Bemis Company, Huhtamaki, Tetra Pak International SA, Berry Global Group, Nampak, Ball Corporation, Sealed Air Corporation, WestRock Company, Mondi Group, and Amcor Limited are analyzed, along with segments including shop, factory, and other applications, and glass and plastic materials. The total market value is predicted to reach xx million by 2033.
Dairy Packaging Solution Market Dynamics & Concentration
The global dairy packaging solution market, valued at xx million in 2024, is experiencing significant growth driven by several factors. Market concentration is moderate, with the top 10 players holding approximately 60% market share in 2024. Innovation is a key driver, with companies continually developing sustainable and technologically advanced packaging solutions. Stringent regulatory frameworks concerning food safety and environmental sustainability are shaping industry practices. The rise of alternative packaging materials like biodegradable plastics presents a competitive challenge to traditional materials. End-user preferences for convenience, freshness preservation, and sustainable packaging are driving demand for innovative solutions. The historical period (2019-2024) witnessed xx M&A deals, indicating consolidation within the market.
- Market Share: Top 10 players hold approximately 60% in 2024.
- M&A Activity: xx deals between 2019 and 2024.
- Innovation Drivers: Sustainable packaging, improved barrier properties, smart packaging technologies.
- Regulatory Landscape: Emphasis on food safety, recyclability, and reduced environmental impact.
Dairy Packaging Solution Industry Trends & Analysis
The dairy packaging solution market exhibits a robust CAGR of xx% during the forecast period (2025-2033). Key growth drivers include the increasing demand for dairy products globally, the rising adoption of convenient packaging formats (e.g., single-serve cups, pouches), and a growing consumer preference for sustainable and eco-friendly packaging options. Technological disruptions such as the introduction of active and intelligent packaging are reshaping the competitive landscape. Consumer preferences are shifting towards healthier dairy options and more sustainable packaging, creating opportunities for manufacturers to cater to these evolving needs. The market penetration of sustainable packaging is steadily increasing, with a projected xx% penetration by 2033. Competitive dynamics are characterized by innovation, branding, and strategic partnerships.
Leading Markets & Segments in Dairy Packaging Solution
The North American region currently dominates the dairy packaging market, driven by high dairy consumption, robust infrastructure, and strong economic conditions. Within this region, the United States holds the largest market share. The factory application segment accounts for the largest market share, due to the high volume packaging needs of large-scale dairy processors. Plastic materials currently dominate the market due to their cost-effectiveness and versatility, however, the demand for sustainable glass and alternative packaging materials is expected to grow significantly in the coming years.
- Key Drivers (North America): Strong dairy consumption, advanced infrastructure, favorable economic policies.
- Key Drivers (Factory Segment): High-volume packaging needs of large-scale dairy processors.
- Key Drivers (Plastic Materials): Cost-effectiveness, versatility, established manufacturing infrastructure.
Dairy Packaging Solution Product Developments
Recent product innovations include the development of lightweight, high-barrier packaging materials that enhance shelf life and reduce transportation costs. The introduction of active and intelligent packaging technologies, such as oxygen scavengers and time-temperature indicators, is improving product freshness and safety. These advancements offer competitive advantages by enhancing product quality and extending shelf life, thereby meeting consumer demands for convenience and sustainability.
Key Drivers of Dairy Packaging Solution Growth
Several factors contribute to the growth of this market. Technological advancements in packaging materials and processing techniques are driving efficiency and sustainability. The burgeoning global dairy industry and rising disposable incomes in emerging markets fuel demand for packaged dairy products. Furthermore, supportive government regulations promoting sustainable packaging practices encourage innovation and adoption of eco-friendly solutions. Examples include tax incentives for recycled content and bans on certain non-biodegradable materials.
Challenges in the Dairy Packaging Solution Market
The market faces challenges such as fluctuating raw material prices, which impact production costs. Supply chain disruptions and logistics complexities can lead to delays and increased costs. Intense competition from established players and new entrants necessitates continuous innovation and cost optimization. Stringent regulatory requirements for packaging materials and labelling can increase compliance costs. These factors collectively impact the market's overall profitability and growth trajectory, reducing estimated growth by approximately xx% in certain years.
Emerging Opportunities in Dairy Packaging Solution
Emerging opportunities lie in the development and adoption of innovative packaging solutions that cater to the growing demand for sustainable, convenient, and safe dairy packaging. Strategic partnerships between packaging manufacturers and dairy processors can enhance product development and market penetration. Expanding into new geographic markets with high growth potential, like Asia-Pacific and Africa, presents significant opportunities. Technological breakthroughs in biodegradable and compostable materials open avenues for sustainable packaging solutions that address environmental concerns.
Leading Players in the Dairy Packaging Solution Sector
Key Milestones in Dairy Packaging Solution Industry
- 2020: Introduction of a new biodegradable plastic by Amcor Limited.
- 2021: Tetra Pak International SA launches a sustainable paper-based packaging solution.
- 2022: Berry Global Group acquires a smaller packaging company specializing in sustainable materials.
- 2023: New EU regulations on plastic packaging come into effect.
Strategic Outlook for Dairy Packaging Solution Market
The dairy packaging solution market is poised for continued growth, driven by technological advancements, increasing consumer demand for sustainable and convenient packaging, and expansion into new markets. Strategic partnerships, focused R&D efforts, and proactive adaptation to changing regulations are key to success. Companies that prioritize sustainability, innovation, and efficiency will gain a competitive edge and capture significant market share in the years to come. The market is projected to reach xx million by 2033, representing significant growth opportunities for industry stakeholders.
Dairy Packaging Solution Segmentation
-
1. Application
- 1.1. Shop
- 1.2. Factory
- 1.3. Others
-
2. Types
- 2.1. Glass Material
- 2.2. Plastic Material
Dairy Packaging Solution Segmentation By Geography
-
1. North America
- 1.1. United States
- 1.2. Canada
- 1.3. Mexico
-
2. South America
- 2.1. Brazil
- 2.2. Argentina
- 2.3. Rest of South America
-
3. Europe
- 3.1. United Kingdom
- 3.2. Germany
- 3.3. France
- 3.4. Italy
- 3.5. Spain
- 3.6. Russia
- 3.7. Benelux
- 3.8. Nordics
- 3.9. Rest of Europe
-
4. Middle East & Africa
- 4.1. Turkey
- 4.2. Israel
- 4.3. GCC
- 4.4. North Africa
- 4.5. South Africa
- 4.6. Rest of Middle East & Africa
-
5. Asia Pacific
- 5.1. China
- 5.2. India
- 5.3. Japan
- 5.4. South Korea
- 5.5. ASEAN
- 5.6. Oceania
- 5.7. Rest of Asia Pacific
Dairy Packaging Solution Regional Market Share
Geographic Coverage of Dairy Packaging Solution
Dairy Packaging Solution REPORT HIGHLIGHTS
| Aspects | Details |
|---|---|
| Study Period | 2020-2034 |
| Base Year | 2025 |
| Estimated Year | 2026 |
| Forecast Period | 2026-2034 |
| Historical Period | 2020-2025 |
| Growth Rate | CAGR of 4.3% from 2020-2034 |
| Segmentation |
|
Table of Contents
- 1. Introduction
- 1.1. Research Scope
- 1.2. Market Segmentation
- 1.3. Research Methodology
- 1.4. Definitions and Assumptions
- 2. Executive Summary
- 2.1. Introduction
- 3. Market Dynamics
- 3.1. Introduction
- 3.2. Market Drivers
- 3.3. Market Restrains
- 3.4. Market Trends
- 4. Market Factor Analysis
- 4.1. Porters Five Forces
- 4.2. Supply/Value Chain
- 4.3. PESTEL analysis
- 4.4. Market Entropy
- 4.5. Patent/Trademark Analysis
- 5. Global Dairy Packaging Solution Analysis, Insights and Forecast, 2020-2032
- 5.1. Market Analysis, Insights and Forecast - by Application
- 5.1.1. Shop
- 5.1.2. Factory
- 5.1.3. Others
- 5.2. Market Analysis, Insights and Forecast - by Types
- 5.2.1. Glass Material
- 5.2.2. Plastic Material
- 5.3. Market Analysis, Insights and Forecast - by Region
- 5.3.1. North America
- 5.3.2. South America
- 5.3.3. Europe
- 5.3.4. Middle East & Africa
- 5.3.5. Asia Pacific
- 5.1. Market Analysis, Insights and Forecast - by Application
- 6. North America Dairy Packaging Solution Analysis, Insights and Forecast, 2020-2032
- 6.1. Market Analysis, Insights and Forecast - by Application
- 6.1.1. Shop
- 6.1.2. Factory
- 6.1.3. Others
- 6.2. Market Analysis, Insights and Forecast - by Types
- 6.2.1. Glass Material
- 6.2.2. Plastic Material
- 6.1. Market Analysis, Insights and Forecast - by Application
- 7. South America Dairy Packaging Solution Analysis, Insights and Forecast, 2020-2032
- 7.1. Market Analysis, Insights and Forecast - by Application
- 7.1.1. Shop
- 7.1.2. Factory
- 7.1.3. Others
- 7.2. Market Analysis, Insights and Forecast - by Types
- 7.2.1. Glass Material
- 7.2.2. Plastic Material
- 7.1. Market Analysis, Insights and Forecast - by Application
- 8. Europe Dairy Packaging Solution Analysis, Insights and Forecast, 2020-2032
- 8.1. Market Analysis, Insights and Forecast - by Application
- 8.1.1. Shop
- 8.1.2. Factory
- 8.1.3. Others
- 8.2. Market Analysis, Insights and Forecast - by Types
- 8.2.1. Glass Material
- 8.2.2. Plastic Material
- 8.1. Market Analysis, Insights and Forecast - by Application
- 9. Middle East & Africa Dairy Packaging Solution Analysis, Insights and Forecast, 2020-2032
- 9.1. Market Analysis, Insights and Forecast - by Application
- 9.1.1. Shop
- 9.1.2. Factory
- 9.1.3. Others
- 9.2. Market Analysis, Insights and Forecast - by Types
- 9.2.1. Glass Material
- 9.2.2. Plastic Material
- 9.1. Market Analysis, Insights and Forecast - by Application
- 10. Asia Pacific Dairy Packaging Solution Analysis, Insights and Forecast, 2020-2032
- 10.1. Market Analysis, Insights and Forecast - by Application
- 10.1.1. Shop
- 10.1.2. Factory
- 10.1.3. Others
- 10.2. Market Analysis, Insights and Forecast - by Types
- 10.2.1. Glass Material
- 10.2.2. Plastic Material
- 10.1. Market Analysis, Insights and Forecast - by Application
- 11. Competitive Analysis
- 11.1. Global Market Share Analysis 2025
- 11.2. Company Profiles
- 11.2.1 Bemis Company
- 11.2.1.1. Overview
- 11.2.1.2. Products
- 11.2.1.3. SWOT Analysis
- 11.2.1.4. Recent Developments
- 11.2.1.5. Financials (Based on Availability)
- 11.2.2 Huhtamaki
- 11.2.2.1. Overview
- 11.2.2.2. Products
- 11.2.2.3. SWOT Analysis
- 11.2.2.4. Recent Developments
- 11.2.2.5. Financials (Based on Availability)
- 11.2.3 Tetra Pak International SA
- 11.2.3.1. Overview
- 11.2.3.2. Products
- 11.2.3.3. SWOT Analysis
- 11.2.3.4. Recent Developments
- 11.2.3.5. Financials (Based on Availability)
- 11.2.4 Berry Global Group
- 11.2.4.1. Overview
- 11.2.4.2. Products
- 11.2.4.3. SWOT Analysis
- 11.2.4.4. Recent Developments
- 11.2.4.5. Financials (Based on Availability)
- 11.2.5 Nampak
- 11.2.5.1. Overview
- 11.2.5.2. Products
- 11.2.5.3. SWOT Analysis
- 11.2.5.4. Recent Developments
- 11.2.5.5. Financials (Based on Availability)
- 11.2.6 Ball Corporation
- 11.2.6.1. Overview
- 11.2.6.2. Products
- 11.2.6.3. SWOT Analysis
- 11.2.6.4. Recent Developments
- 11.2.6.5. Financials (Based on Availability)
- 11.2.7 Sealed Air Corporation
- 11.2.7.1. Overview
- 11.2.7.2. Products
- 11.2.7.3. SWOT Analysis
- 11.2.7.4. Recent Developments
- 11.2.7.5. Financials (Based on Availability)
- 11.2.8 WestRock Company
- 11.2.8.1. Overview
- 11.2.8.2. Products
- 11.2.8.3. SWOT Analysis
- 11.2.8.4. Recent Developments
- 11.2.8.5. Financials (Based on Availability)
- 11.2.9 Mondi Group
- 11.2.9.1. Overview
- 11.2.9.2. Products
- 11.2.9.3. SWOT Analysis
- 11.2.9.4. Recent Developments
- 11.2.9.5. Financials (Based on Availability)
- 11.2.10 Amcor Limited
- 11.2.10.1. Overview
- 11.2.10.2. Products
- 11.2.10.3. SWOT Analysis
- 11.2.10.4. Recent Developments
- 11.2.10.5. Financials (Based on Availability)
- 11.2.1 Bemis Company
List of Figures
- Figure 1: Global Dairy Packaging Solution Revenue Breakdown (undefined, %) by Region 2025 & 2033
- Figure 2: Global Dairy Packaging Solution Volume Breakdown (K, %) by Region 2025 & 2033
- Figure 3: North America Dairy Packaging Solution Revenue (undefined), by Application 2025 & 2033
- Figure 4: North America Dairy Packaging Solution Volume (K), by Application 2025 & 2033
- Figure 5: North America Dairy Packaging Solution Revenue Share (%), by Application 2025 & 2033
- Figure 6: North America Dairy Packaging Solution Volume Share (%), by Application 2025 & 2033
- Figure 7: North America Dairy Packaging Solution Revenue (undefined), by Types 2025 & 2033
- Figure 8: North America Dairy Packaging Solution Volume (K), by Types 2025 & 2033
- Figure 9: North America Dairy Packaging Solution Revenue Share (%), by Types 2025 & 2033
- Figure 10: North America Dairy Packaging Solution Volume Share (%), by Types 2025 & 2033
- Figure 11: North America Dairy Packaging Solution Revenue (undefined), by Country 2025 & 2033
- Figure 12: North America Dairy Packaging Solution Volume (K), by Country 2025 & 2033
- Figure 13: North America Dairy Packaging Solution Revenue Share (%), by Country 2025 & 2033
- Figure 14: North America Dairy Packaging Solution Volume Share (%), by Country 2025 & 2033
- Figure 15: South America Dairy Packaging Solution Revenue (undefined), by Application 2025 & 2033
- Figure 16: South America Dairy Packaging Solution Volume (K), by Application 2025 & 2033
- Figure 17: South America Dairy Packaging Solution Revenue Share (%), by Application 2025 & 2033
- Figure 18: South America Dairy Packaging Solution Volume Share (%), by Application 2025 & 2033
- Figure 19: South America Dairy Packaging Solution Revenue (undefined), by Types 2025 & 2033
- Figure 20: South America Dairy Packaging Solution Volume (K), by Types 2025 & 2033
- Figure 21: South America Dairy Packaging Solution Revenue Share (%), by Types 2025 & 2033
- Figure 22: South America Dairy Packaging Solution Volume Share (%), by Types 2025 & 2033
- Figure 23: South America Dairy Packaging Solution Revenue (undefined), by Country 2025 & 2033
- Figure 24: South America Dairy Packaging Solution Volume (K), by Country 2025 & 2033
- Figure 25: South America Dairy Packaging Solution Revenue Share (%), by Country 2025 & 2033
- Figure 26: South America Dairy Packaging Solution Volume Share (%), by Country 2025 & 2033
- Figure 27: Europe Dairy Packaging Solution Revenue (undefined), by Application 2025 & 2033
- Figure 28: Europe Dairy Packaging Solution Volume (K), by Application 2025 & 2033
- Figure 29: Europe Dairy Packaging Solution Revenue Share (%), by Application 2025 & 2033
- Figure 30: Europe Dairy Packaging Solution Volume Share (%), by Application 2025 & 2033
- Figure 31: Europe Dairy Packaging Solution Revenue (undefined), by Types 2025 & 2033
- Figure 32: Europe Dairy Packaging Solution Volume (K), by Types 2025 & 2033
- Figure 33: Europe Dairy Packaging Solution Revenue Share (%), by Types 2025 & 2033
- Figure 34: Europe Dairy Packaging Solution Volume Share (%), by Types 2025 & 2033
- Figure 35: Europe Dairy Packaging Solution Revenue (undefined), by Country 2025 & 2033
- Figure 36: Europe Dairy Packaging Solution Volume (K), by Country 2025 & 2033
- Figure 37: Europe Dairy Packaging Solution Revenue Share (%), by Country 2025 & 2033
- Figure 38: Europe Dairy Packaging Solution Volume Share (%), by Country 2025 & 2033
- Figure 39: Middle East & Africa Dairy Packaging Solution Revenue (undefined), by Application 2025 & 2033
- Figure 40: Middle East & Africa Dairy Packaging Solution Volume (K), by Application 2025 & 2033
- Figure 41: Middle East & Africa Dairy Packaging Solution Revenue Share (%), by Application 2025 & 2033
- Figure 42: Middle East & Africa Dairy Packaging Solution Volume Share (%), by Application 2025 & 2033
- Figure 43: Middle East & Africa Dairy Packaging Solution Revenue (undefined), by Types 2025 & 2033
- Figure 44: Middle East & Africa Dairy Packaging Solution Volume (K), by Types 2025 & 2033
- Figure 45: Middle East & Africa Dairy Packaging Solution Revenue Share (%), by Types 2025 & 2033
- Figure 46: Middle East & Africa Dairy Packaging Solution Volume Share (%), by Types 2025 & 2033
- Figure 47: Middle East & Africa Dairy Packaging Solution Revenue (undefined), by Country 2025 & 2033
- Figure 48: Middle East & Africa Dairy Packaging Solution Volume (K), by Country 2025 & 2033
- Figure 49: Middle East & Africa Dairy Packaging Solution Revenue Share (%), by Country 2025 & 2033
- Figure 50: Middle East & Africa Dairy Packaging Solution Volume Share (%), by Country 2025 & 2033
- Figure 51: Asia Pacific Dairy Packaging Solution Revenue (undefined), by Application 2025 & 2033
- Figure 52: Asia Pacific Dairy Packaging Solution Volume (K), by Application 2025 & 2033
- Figure 53: Asia Pacific Dairy Packaging Solution Revenue Share (%), by Application 2025 & 2033
- Figure 54: Asia Pacific Dairy Packaging Solution Volume Share (%), by Application 2025 & 2033
- Figure 55: Asia Pacific Dairy Packaging Solution Revenue (undefined), by Types 2025 & 2033
- Figure 56: Asia Pacific Dairy Packaging Solution Volume (K), by Types 2025 & 2033
- Figure 57: Asia Pacific Dairy Packaging Solution Revenue Share (%), by Types 2025 & 2033
- Figure 58: Asia Pacific Dairy Packaging Solution Volume Share (%), by Types 2025 & 2033
- Figure 59: Asia Pacific Dairy Packaging Solution Revenue (undefined), by Country 2025 & 2033
- Figure 60: Asia Pacific Dairy Packaging Solution Volume (K), by Country 2025 & 2033
- Figure 61: Asia Pacific Dairy Packaging Solution Revenue Share (%), by Country 2025 & 2033
- Figure 62: Asia Pacific Dairy Packaging Solution Volume Share (%), by Country 2025 & 2033
List of Tables
- Table 1: Global Dairy Packaging Solution Revenue undefined Forecast, by Application 2020 & 2033
- Table 2: Global Dairy Packaging Solution Volume K Forecast, by Application 2020 & 2033
- Table 3: Global Dairy Packaging Solution Revenue undefined Forecast, by Types 2020 & 2033
- Table 4: Global Dairy Packaging Solution Volume K Forecast, by Types 2020 & 2033
- Table 5: Global Dairy Packaging Solution Revenue undefined Forecast, by Region 2020 & 2033
- Table 6: Global Dairy Packaging Solution Volume K Forecast, by Region 2020 & 2033
- Table 7: Global Dairy Packaging Solution Revenue undefined Forecast, by Application 2020 & 2033
- Table 8: Global Dairy Packaging Solution Volume K Forecast, by Application 2020 & 2033
- Table 9: Global Dairy Packaging Solution Revenue undefined Forecast, by Types 2020 & 2033
- Table 10: Global Dairy Packaging Solution Volume K Forecast, by Types 2020 & 2033
- Table 11: Global Dairy Packaging Solution Revenue undefined Forecast, by Country 2020 & 2033
- Table 12: Global Dairy Packaging Solution Volume K Forecast, by Country 2020 & 2033
- Table 13: United States Dairy Packaging Solution Revenue (undefined) Forecast, by Application 2020 & 2033
- Table 14: United States Dairy Packaging Solution Volume (K) Forecast, by Application 2020 & 2033
- Table 15: Canada Dairy Packaging Solution Revenue (undefined) Forecast, by Application 2020 & 2033
- Table 16: Canada Dairy Packaging Solution Volume (K) Forecast, by Application 2020 & 2033
- Table 17: Mexico Dairy Packaging Solution Revenue (undefined) Forecast, by Application 2020 & 2033
- Table 18: Mexico Dairy Packaging Solution Volume (K) Forecast, by Application 2020 & 2033
- Table 19: Global Dairy Packaging Solution Revenue undefined Forecast, by Application 2020 & 2033
- Table 20: Global Dairy Packaging Solution Volume K Forecast, by Application 2020 & 2033
- Table 21: Global Dairy Packaging Solution Revenue undefined Forecast, by Types 2020 & 2033
- Table 22: Global Dairy Packaging Solution Volume K Forecast, by Types 2020 & 2033
- Table 23: Global Dairy Packaging Solution Revenue undefined Forecast, by Country 2020 & 2033
- Table 24: Global Dairy Packaging Solution Volume K Forecast, by Country 2020 & 2033
- Table 25: Brazil Dairy Packaging Solution Revenue (undefined) Forecast, by Application 2020 & 2033
- Table 26: Brazil Dairy Packaging Solution Volume (K) Forecast, by Application 2020 & 2033
- Table 27: Argentina Dairy Packaging Solution Revenue (undefined) Forecast, by Application 2020 & 2033
- Table 28: Argentina Dairy Packaging Solution Volume (K) Forecast, by Application 2020 & 2033
- Table 29: Rest of South America Dairy Packaging Solution Revenue (undefined) Forecast, by Application 2020 & 2033
- Table 30: Rest of South America Dairy Packaging Solution Volume (K) Forecast, by Application 2020 & 2033
- Table 31: Global Dairy Packaging Solution Revenue undefined Forecast, by Application 2020 & 2033
- Table 32: Global Dairy Packaging Solution Volume K Forecast, by Application 2020 & 2033
- Table 33: Global Dairy Packaging Solution Revenue undefined Forecast, by Types 2020 & 2033
- Table 34: Global Dairy Packaging Solution Volume K Forecast, by Types 2020 & 2033
- Table 35: Global Dairy Packaging Solution Revenue undefined Forecast, by Country 2020 & 2033
- Table 36: Global Dairy Packaging Solution Volume K Forecast, by Country 2020 & 2033
- Table 37: United Kingdom Dairy Packaging Solution Revenue (undefined) Forecast, by Application 2020 & 2033
- Table 38: United Kingdom Dairy Packaging Solution Volume (K) Forecast, by Application 2020 & 2033
- Table 39: Germany Dairy Packaging Solution Revenue (undefined) Forecast, by Application 2020 & 2033
- Table 40: Germany Dairy Packaging Solution Volume (K) Forecast, by Application 2020 & 2033
- Table 41: France Dairy Packaging Solution Revenue (undefined) Forecast, by Application 2020 & 2033
- Table 42: France Dairy Packaging Solution Volume (K) Forecast, by Application 2020 & 2033
- Table 43: Italy Dairy Packaging Solution Revenue (undefined) Forecast, by Application 2020 & 2033
- Table 44: Italy Dairy Packaging Solution Volume (K) Forecast, by Application 2020 & 2033
- Table 45: Spain Dairy Packaging Solution Revenue (undefined) Forecast, by Application 2020 & 2033
- Table 46: Spain Dairy Packaging Solution Volume (K) Forecast, by Application 2020 & 2033
- Table 47: Russia Dairy Packaging Solution Revenue (undefined) Forecast, by Application 2020 & 2033
- Table 48: Russia Dairy Packaging Solution Volume (K) Forecast, by Application 2020 & 2033
- Table 49: Benelux Dairy Packaging Solution Revenue (undefined) Forecast, by Application 2020 & 2033
- Table 50: Benelux Dairy Packaging Solution Volume (K) Forecast, by Application 2020 & 2033
- Table 51: Nordics Dairy Packaging Solution Revenue (undefined) Forecast, by Application 2020 & 2033
- Table 52: Nordics Dairy Packaging Solution Volume (K) Forecast, by Application 2020 & 2033
- Table 53: Rest of Europe Dairy Packaging Solution Revenue (undefined) Forecast, by Application 2020 & 2033
- Table 54: Rest of Europe Dairy Packaging Solution Volume (K) Forecast, by Application 2020 & 2033
- Table 55: Global Dairy Packaging Solution Revenue undefined Forecast, by Application 2020 & 2033
- Table 56: Global Dairy Packaging Solution Volume K Forecast, by Application 2020 & 2033
- Table 57: Global Dairy Packaging Solution Revenue undefined Forecast, by Types 2020 & 2033
- Table 58: Global Dairy Packaging Solution Volume K Forecast, by Types 2020 & 2033
- Table 59: Global Dairy Packaging Solution Revenue undefined Forecast, by Country 2020 & 2033
- Table 60: Global Dairy Packaging Solution Volume K Forecast, by Country 2020 & 2033
- Table 61: Turkey Dairy Packaging Solution Revenue (undefined) Forecast, by Application 2020 & 2033
- Table 62: Turkey Dairy Packaging Solution Volume (K) Forecast, by Application 2020 & 2033
- Table 63: Israel Dairy Packaging Solution Revenue (undefined) Forecast, by Application 2020 & 2033
- Table 64: Israel Dairy Packaging Solution Volume (K) Forecast, by Application 2020 & 2033
- Table 65: GCC Dairy Packaging Solution Revenue (undefined) Forecast, by Application 2020 & 2033
- Table 66: GCC Dairy Packaging Solution Volume (K) Forecast, by Application 2020 & 2033
- Table 67: North Africa Dairy Packaging Solution Revenue (undefined) Forecast, by Application 2020 & 2033
- Table 68: North Africa Dairy Packaging Solution Volume (K) Forecast, by Application 2020 & 2033
- Table 69: South Africa Dairy Packaging Solution Revenue (undefined) Forecast, by Application 2020 & 2033
- Table 70: South Africa Dairy Packaging Solution Volume (K) Forecast, by Application 2020 & 2033
- Table 71: Rest of Middle East & Africa Dairy Packaging Solution Revenue (undefined) Forecast, by Application 2020 & 2033
- Table 72: Rest of Middle East & Africa Dairy Packaging Solution Volume (K) Forecast, by Application 2020 & 2033
- Table 73: Global Dairy Packaging Solution Revenue undefined Forecast, by Application 2020 & 2033
- Table 74: Global Dairy Packaging Solution Volume K Forecast, by Application 2020 & 2033
- Table 75: Global Dairy Packaging Solution Revenue undefined Forecast, by Types 2020 & 2033
- Table 76: Global Dairy Packaging Solution Volume K Forecast, by Types 2020 & 2033
- Table 77: Global Dairy Packaging Solution Revenue undefined Forecast, by Country 2020 & 2033
- Table 78: Global Dairy Packaging Solution Volume K Forecast, by Country 2020 & 2033
- Table 79: China Dairy Packaging Solution Revenue (undefined) Forecast, by Application 2020 & 2033
- Table 80: China Dairy Packaging Solution Volume (K) Forecast, by Application 2020 & 2033
- Table 81: India Dairy Packaging Solution Revenue (undefined) Forecast, by Application 2020 & 2033
- Table 82: India Dairy Packaging Solution Volume (K) Forecast, by Application 2020 & 2033
- Table 83: Japan Dairy Packaging Solution Revenue (undefined) Forecast, by Application 2020 & 2033
- Table 84: Japan Dairy Packaging Solution Volume (K) Forecast, by Application 2020 & 2033
- Table 85: South Korea Dairy Packaging Solution Revenue (undefined) Forecast, by Application 2020 & 2033
- Table 86: South Korea Dairy Packaging Solution Volume (K) Forecast, by Application 2020 & 2033
- Table 87: ASEAN Dairy Packaging Solution Revenue (undefined) Forecast, by Application 2020 & 2033
- Table 88: ASEAN Dairy Packaging Solution Volume (K) Forecast, by Application 2020 & 2033
- Table 89: Oceania Dairy Packaging Solution Revenue (undefined) Forecast, by Application 2020 & 2033
- Table 90: Oceania Dairy Packaging Solution Volume (K) Forecast, by Application 2020 & 2033
- Table 91: Rest of Asia Pacific Dairy Packaging Solution Revenue (undefined) Forecast, by Application 2020 & 2033
- Table 92: Rest of Asia Pacific Dairy Packaging Solution Volume (K) Forecast, by Application 2020 & 2033
Frequently Asked Questions
1. What is the projected Compound Annual Growth Rate (CAGR) of the Dairy Packaging Solution?
The projected CAGR is approximately 4.3%.
2. Which companies are prominent players in the Dairy Packaging Solution?
Key companies in the market include Bemis Company, Huhtamaki, Tetra Pak International SA, Berry Global Group, Nampak, Ball Corporation, Sealed Air Corporation, WestRock Company, Mondi Group, Amcor Limited.
3. What are the main segments of the Dairy Packaging Solution?
The market segments include Application, Types.
4. Can you provide details about the market size?
The market size is estimated to be USD XXX N/A as of 2022.
5. What are some drivers contributing to market growth?
N/A
6. What are the notable trends driving market growth?
N/A
7. Are there any restraints impacting market growth?
N/A
8. Can you provide examples of recent developments in the market?
N/A
9. What pricing options are available for accessing the report?
Pricing options include single-user, multi-user, and enterprise licenses priced at USD 3350.00, USD 5025.00, and USD 6700.00 respectively.
10. Is the market size provided in terms of value or volume?
The market size is provided in terms of value, measured in N/A and volume, measured in K.
11. Are there any specific market keywords associated with the report?
Yes, the market keyword associated with the report is "Dairy Packaging Solution," which aids in identifying and referencing the specific market segment covered.
12. How do I determine which pricing option suits my needs best?
The pricing options vary based on user requirements and access needs. Individual users may opt for single-user licenses, while businesses requiring broader access may choose multi-user or enterprise licenses for cost-effective access to the report.
13. Are there any additional resources or data provided in the Dairy Packaging Solution report?
While the report offers comprehensive insights, it's advisable to review the specific contents or supplementary materials provided to ascertain if additional resources or data are available.
14. How can I stay updated on further developments or reports in the Dairy Packaging Solution?
To stay informed about further developments, trends, and reports in the Dairy Packaging Solution, consider subscribing to industry newsletters, following relevant companies and organizations, or regularly checking reputable industry news sources and publications.
Methodology
Step 1 - Identification of Relevant Samples Size from Population Database


Step 2 - Approaches for Defining Global Market Size (Value, Volume* & Price*)

Note*: In applicable scenarios
Step 3 - Data Sources
Primary Research
- Web Analytics
- Survey Reports
- Research Institute
- Latest Research Reports
- Opinion Leaders
Secondary Research
- Annual Reports
- White Paper
- Latest Press Release
- Industry Association
- Paid Database
- Investor Presentations

Step 4 - Data Triangulation
Involves using different sources of information in order to increase the validity of a study
These sources are likely to be stakeholders in a program - participants, other researchers, program staff, other community members, and so on.
Then we put all data in single framework & apply various statistical tools to find out the dynamic on the market.
During the analysis stage, feedback from the stakeholder groups would be compared to determine areas of agreement as well as areas of divergence