

Key Insights
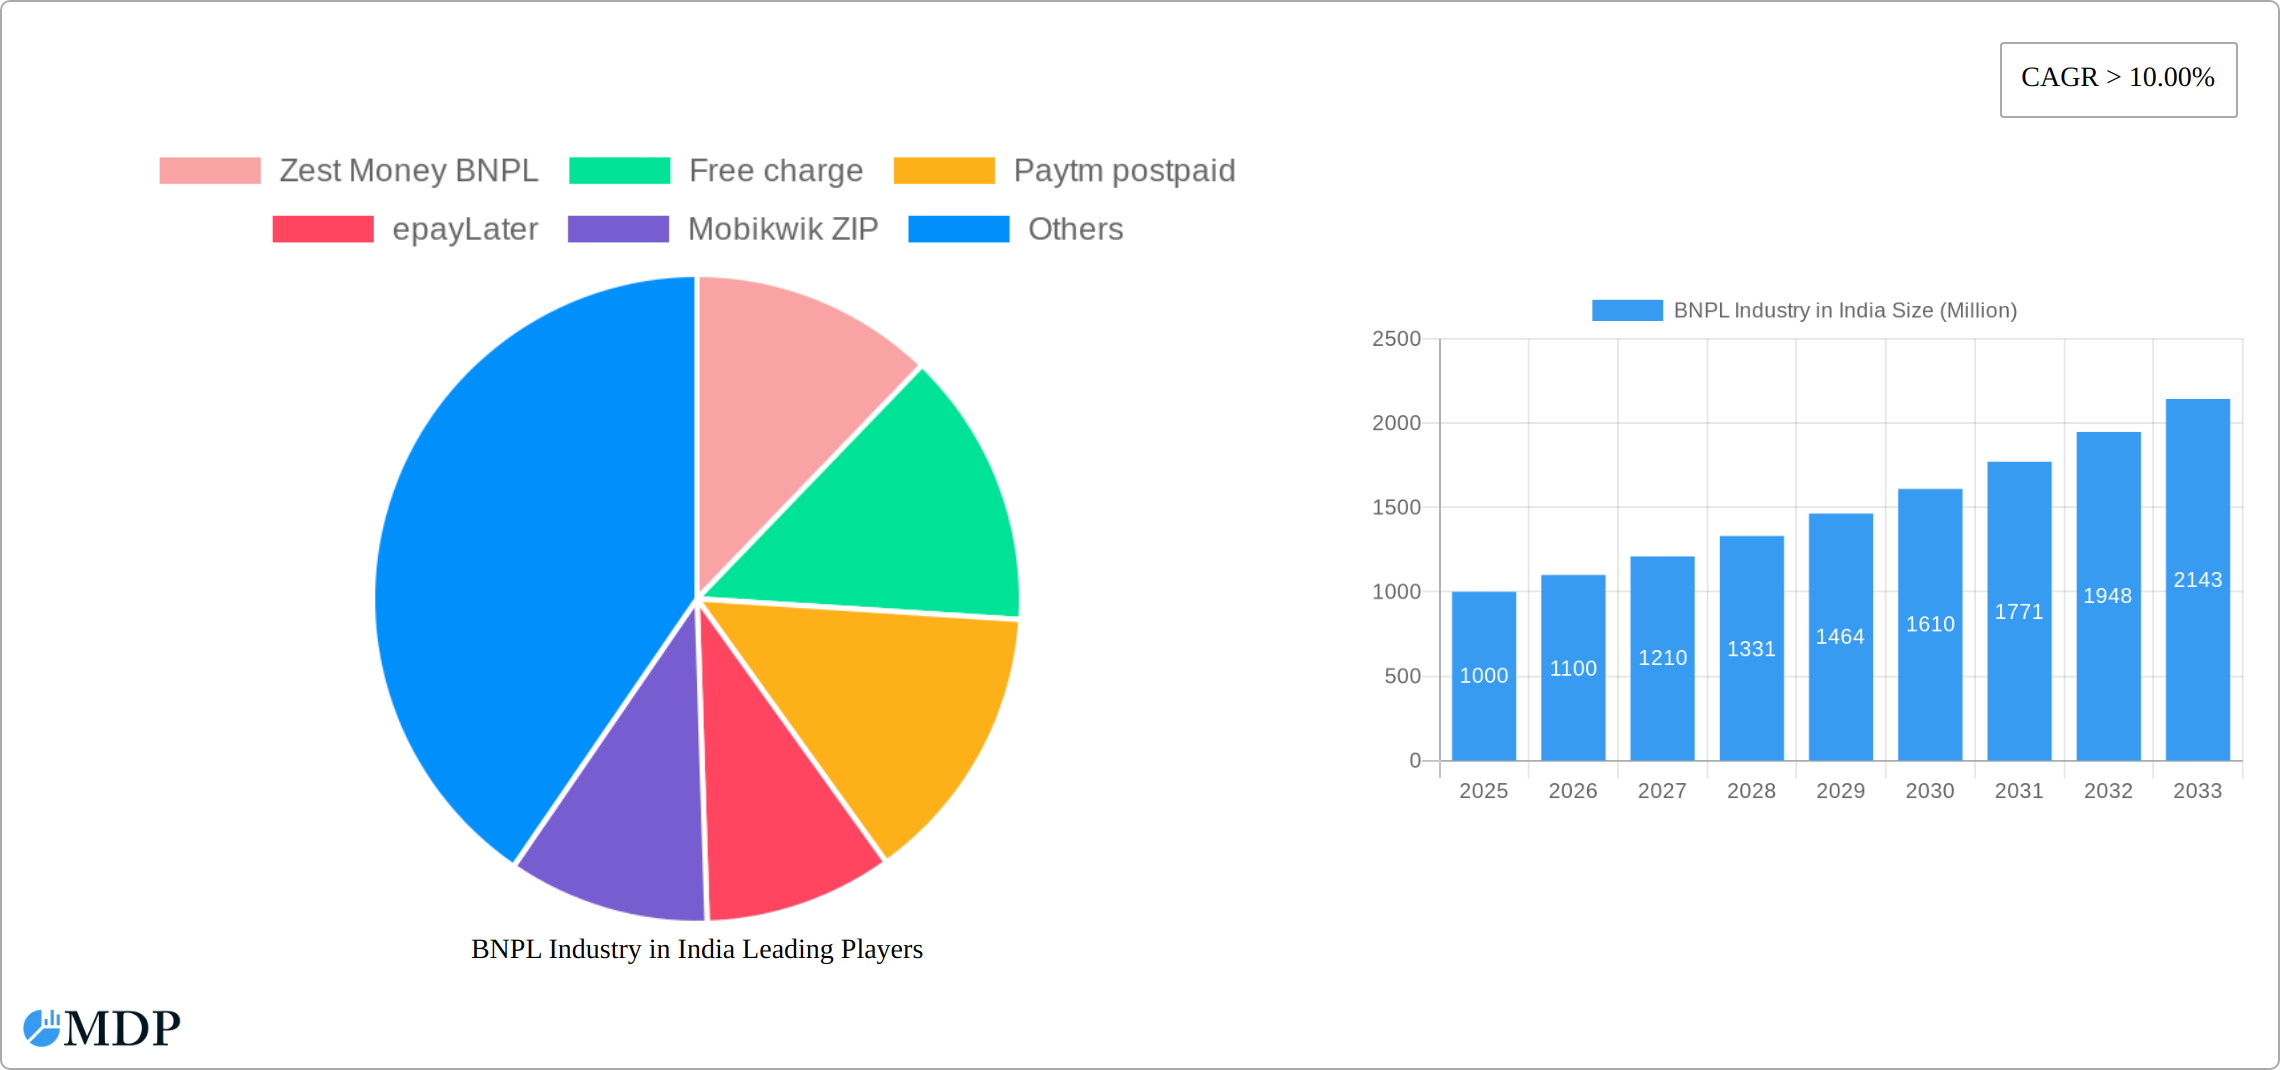
India's Buy Now Pay Later (BNPL) market is experiencing significant expansion, propelled by widespread smartphone adoption, enhanced digital literacy, and a young, tech-savvy demographic seeking convenient payment solutions. The market is projected for robust growth, with a projected Compound Annual Growth Rate (CAGR) of 13.4%. This surge is attributed to several key drivers: the continuous evolution of e-commerce, creating substantial demand for flexible payment options; innovations within the fintech sector, introducing diverse BNPL features and rewards programs; and a comparatively favorable regulatory environment that supports rapid market penetration.
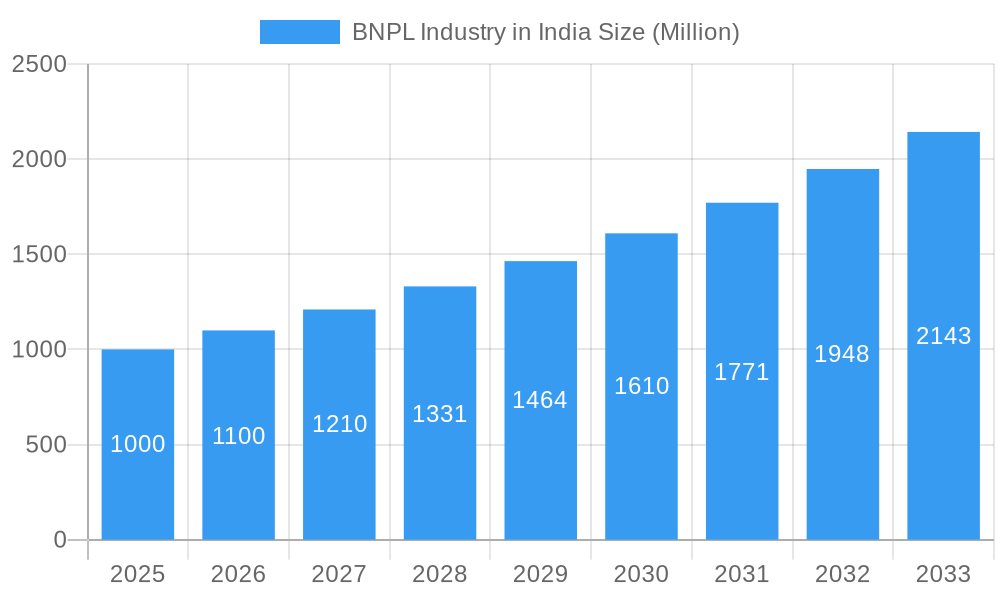
BNPL Industry in India Market Size (In Billion)
Despite rapid growth, the industry faces challenges including consumer debt concerns and the necessity for robust risk management. Implementing effective credit scoring systems and responsible lending practices is crucial to mitigate potential defaults. Intensifying competition necessitates ongoing product innovation and strategic partnerships. The BNPL market is segmented, with large platforms like Paytm Postpaid and Amazon Pay Later serving a broad consumer base, alongside niche providers targeting specific sectors. Success hinges on navigating these challenges and adapting to evolving consumer preferences and regulatory shifts. Sustained strong growth is anticipated throughout the forecast period, contingent upon stable economic conditions and regulatory stability.
BNPL Industry in India Company Market Share
India's Buy Now Pay Later (BNPL) Industry Analysis: Market Size, Growth, and Forecast (2025-2033)
This comprehensive report offers a detailed analysis of India's burgeoning Buy Now Pay Later (BNPL) industry, providing critical insights for investors, stakeholders, and decision-makers. Covering market dynamics, competitive landscapes, and future growth projections, this report serves as an essential guide to navigating this dynamic sector. The study encompasses the period from 2025 to 2033, with 2025 identified as the base year. The market is estimated to reach 21.95 billion by 2033.
BNPL Industry in India Market Dynamics & Concentration
The Indian BNPL market is characterized by intense competition, rapid innovation, and a dynamic regulatory environment. Market concentration is currently moderate, with a few major players holding significant market share, but a large number of smaller players also competing vigorously. The market share of the top 5 players is estimated at xx%, leaving ample opportunity for new entrants and expansion.
- Innovation Drivers: Technological advancements like embedded finance, AI-powered risk assessment, and seamless integration with e-commerce platforms are fueling growth.
- Regulatory Frameworks: The Reserve Bank of India (RBI) guidelines significantly impact the market, influencing lending practices and consumer protection measures. Recent regulatory changes have had both positive and negative impacts on market growth, with some companies facing temporary setbacks.
- Product Substitutes: Traditional credit cards and personal loans remain competitive substitutes, although the convenience and accessibility of BNPL are attracting a wider consumer base.
- End-User Trends: A growing young population with increasing digital adoption and a preference for flexible payment options are key drivers of market expansion. Demand is particularly strong among younger demographics in urban centers.
- M&A Activities: The number of M&A deals in the BNPL sector has seen a xx% increase from 2022-2023, indicating consolidation and aggressive expansion strategies by major players. This is expected to continue.
BNPL Industry in India Industry Trends & Analysis
The Indian Buy Now, Pay Later (BNPL) market is in a phase of accelerated growth, fueled by a confluence of powerful drivers. Projections indicate a robust Compound Annual Growth Rate (CAGR) of **around 35-45%** for the period 2025-2033, underscoring the rapid digitalization of payments and a pronounced consumer shift towards flexible, interest-free purchase options. While current market penetration remains relatively modest, this signifies a vast reservoir of untapped potential, particularly in expanding reach to Tier 2 and Tier 3 cities. The ecosystem is also being profoundly reshaped by technological advancements like the integration of embedded finance solutions and the rise of comprehensive super apps, leading to a dynamic competitive landscape. Consumers are increasingly demanding greater transparency in terms and conditions, personalized offers that cater to their specific spending habits, and a seamless, integrated experience within their existing digital financial lives. To thrive in this evolving environment, BNPL providers must focus on delivering truly innovative and customer-centric solutions.
Leading Markets & Segments in BNPL Industry in India
The Indian BNPL market is witnessing significant growth across various regions and segments. While urban areas currently dominate, substantial growth is projected for tier 2 and 3 cities as digital penetration expands. E-commerce remains the primary segment, but expansion into offline retail and other sectors is observed.
- Key Drivers of Dominance:
- Increasing Smartphone Penetration: Widespread smartphone usage facilitates access to BNPL platforms.
- Rising Digital Literacy: Improved digital literacy empowers consumers to utilize online financial services.
- Government Initiatives: Pro-digitalization government policies support the growth of the fintech sector.
- Favorable Demographics: A young and tech-savvy population represents a massive potential user base.
BNPL Industry in India Product Developments
The recent wave of product innovation in the Indian BNPL sector is primarily centered on elevating the user journey, strengthening risk assessment frameworks, and deepening merchant integrations. A significant trend is the emergence of highly personalized offer engines, leveraging AI-driven credit scoring to assess risk more accurately and quickly. Furthermore, the focus is on creating frictionless checkout experiences by integrating BNPL options seamlessly across e-commerce platforms, mobile apps, and even point-of-sale systems. As competition intensifies, there's a clear drive towards developing more sophisticated features, including longer repayment tenures, co-branded cards, and tailored BNPL solutions for specific customer demographics and purchase categories.
Key Drivers of BNPL Industry in India Growth
Several factors are driving the growth of the Indian BNPL market:
- Technological advancements: The widespread adoption of smartphones, increased internet penetration, and the development of sophisticated mobile payment applications are key drivers.
- Economic factors: Rising disposable incomes and a growing middle class are increasing demand for convenient payment options.
- Regulatory support: While regulatory scrutiny remains, government initiatives to promote digital payments create a supportive environment.
Challenges in the BNPL Industry in India Market
The Indian BNPL market, despite its rapid ascent, faces several critical challenges that require strategic navigation:
- Navigating Regulatory Evolution: The dynamic nature of regulatory frameworks and the need for robust compliance with emerging guidelines present ongoing hurdles for BNPL providers. Adapting swiftly to new rules is paramount.
- Robust Credit Risk Management: The ability to implement precise credit scoring models and rigorous risk assessment protocols is fundamental to minimizing potential defaults. The estimated default losses of **over INR 500 Crores** in 2024 serve as a stark reminder of the importance of effective risk mitigation strategies.
- Intense Competitive Landscape: The proliferation of numerous BNPL players has created a highly competitive environment. This necessitates continuous innovation in product offerings, operational efficiency, and a relentless focus on customer acquisition and retention to maintain a competitive edge.
Emerging Opportunities in BNPL Industry in India
The Indian BNPL market is ripe with significant opportunities for strategic growth and expansion:
- Penetrating Underserved Geographies: A substantial opportunity lies in extending the reach of BNPL services to consumers residing in Tier 2 and Tier 3 cities, where digital payment adoption is growing and the demand for accessible credit is high.
- Forging Strategic Alliances: Collaborations and partnerships with established banks, diverse financial institutions, and a wide array of retailers can unlock synergistic growth opportunities, creating new customer segments and distribution channels.
- Pioneering Innovative Product Solutions: The development and deployment of novel products and services that are precisely tailored to the unique needs and spending patterns of various customer segments will be a key differentiator and driver of sustained success.
Leading Players in the BNPL Industry in India Sector
- Zest Money BNPL
- Freecharge
- Paytm postpaid
- epayLater
- Mobikwik ZIP
- Flipkart pay later
- Olamoney Postpaid
- Money Tap
- Simpl
- Lazy Pay
- Flexmoney
- Amazon Pay later
- Capital float
- Slice
- Kreditbee
- Postpe
Key Milestones in BNPL Industry in India Industry
- May 2023: ZestMoney articulated its strategic vision to achieve profitability within the next six months and successfully concluded a new funding round. This development signals a growing emphasis on building sustainable and profitable business models within the Indian BNPL ecosystem.
- February 2023: The Indian Ministry of Electronics and Information Technology (MeitY) removed the ban on several digital lending applications, including prominent BNPL players like LazyPay and KreditBee. This regulatory adjustment provided a much-needed reprieve and fostered a more stable operating environment for the fintech sector.
Strategic Outlook for BNPL Industry in India Market
The Indian BNPL market holds immense potential for future growth, driven by increasing digital adoption, favorable demographics, and continuous innovation. Strategic partnerships, expansion into new markets, and the development of sophisticated risk management solutions will be key to success in this dynamic and competitive sector. The market is poised for significant expansion, with opportunities for both established players and new entrants to capitalize on the growing demand for convenient and accessible payment options.
BNPL Industry in India Segmentation
-
1. Channel
- 1.1. Online
- 1.2. POS
-
2. Enterprise
- 2.1. Large Enterprise
- 2.2. Small & medium enterprise
-
3. End-user
- 3.1. Consmer electronics
- 3.2. Fashion & garments
- 3.3. Healthcare
- 3.4. Leisure & entertainment
- 3.5. Retail
- 3.6. Other End-users
BNPL Industry in India Segmentation By Geography
-
1. North America
- 1.1. United States
- 1.2. Canada
- 1.3. Mexico
-
2. South America
- 2.1. Brazil
- 2.2. Argentina
- 2.3. Rest of South America
-
3. Europe
- 3.1. United Kingdom
- 3.2. Germany
- 3.3. France
- 3.4. Italy
- 3.5. Spain
- 3.6. Russia
- 3.7. Benelux
- 3.8. Nordics
- 3.9. Rest of Europe
-
4. Middle East & Africa
- 4.1. Turkey
- 4.2. Israel
- 4.3. GCC
- 4.4. North Africa
- 4.5. South Africa
- 4.6. Rest of Middle East & Africa
-
5. Asia Pacific
- 5.1. China
- 5.2. India
- 5.3. Japan
- 5.4. South Korea
- 5.5. ASEAN
- 5.6. Oceania
- 5.7. Rest of Asia Pacific
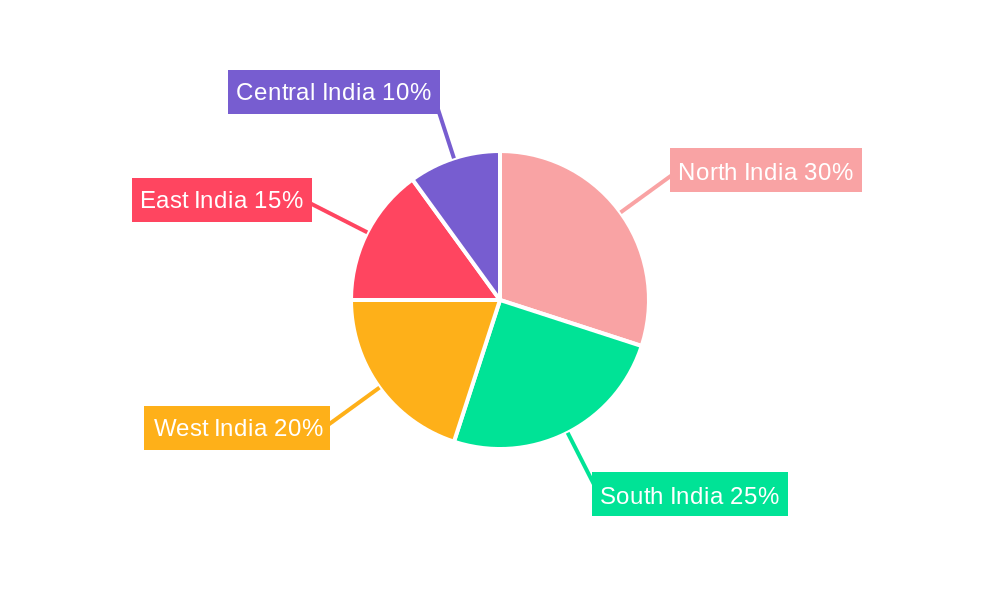
BNPL Industry in India Regional Market Share
Geographic Coverage of BNPL Industry in India
BNPL Industry in India REPORT HIGHLIGHTS
| Aspects | Details |
|---|---|
| Study Period | 2020-2034 |
| Base Year | 2025 |
| Estimated Year | 2026 |
| Forecast Period | 2026-2034 |
| Historical Period | 2020-2025 |
| Growth Rate | CAGR of 13.4% from 2020-2034 |
| Segmentation |
|
Table of Contents
- 1. Introduction
- 1.1. Research Scope
- 1.2. Market Segmentation
- 1.3. Research Objective
- 1.4. Definitions and Assumptions
- 2. Executive Summary
- 2.1. Market Snapshot
- 3. Market Dynamics
- 3.1. Market Drivers
- 3.2. Market Restrains
- 3.3. Market Trends
- 3.4. Market Opportunities
- 4. Market Factor Analysis
- 4.1. Porters Five Forces
- 4.1.1. Bargaining Power of Suppliers
- 4.1.2. Bargaining Power of Buyers
- 4.1.3. Threat of New Entrants
- 4.1.4. Threat of Substitutes
- 4.1.5. Competitive Rivalry
- 4.2. PESTEL analysis
- 4.3. BCG Analysis
- 4.3.1. Stars (High Growth, High Market Share)
- 4.3.2. Cash Cows (Low Growth, High Market Share)
- 4.3.3. Question Mark (High Growth, Low Market Share)
- 4.3.4. Dogs (Low Growth, Low Market Share)
- 4.4. Ansoff Matrix Analysis
- 4.5. Supply Chain Analysis
- 4.6. Regulatory Landscape
- 4.7. Current Market Potential and Opportunity Assessment (TAM–SAM–SOM Framework)
- 4.8. MDP Analyst Note
- 4.1. Porters Five Forces
- 5. Market Analysis, Insights and Forecast 2021-2033
- 5.1. Market Analysis, Insights and Forecast - by Channel
- 5.1.1. Online
- 5.1.2. POS
- 5.2. Market Analysis, Insights and Forecast - by Enterprise
- 5.2.1. Large Enterprise
- 5.2.2. Small & medium enterprise
- 5.3. Market Analysis, Insights and Forecast - by End-user
- 5.3.1. Consmer electronics
- 5.3.2. Fashion & garments
- 5.3.3. Healthcare
- 5.3.4. Leisure & entertainment
- 5.3.5. Retail
- 5.3.6. Other End-users
- 5.4. Market Analysis, Insights and Forecast - by Region
- 5.4.1. North America
- 5.4.2. South America
- 5.4.3. Europe
- 5.4.4. Middle East & Africa
- 5.4.5. Asia Pacific
- 5.1. Market Analysis, Insights and Forecast - by Channel
- 6. Global BNPL Industry in India Analysis, Insights and Forecast, 2021-2033
- 6.1. Market Analysis, Insights and Forecast - by Channel
- 6.1.1. Online
- 6.1.2. POS
- 6.2. Market Analysis, Insights and Forecast - by Enterprise
- 6.2.1. Large Enterprise
- 6.2.2. Small & medium enterprise
- 6.3. Market Analysis, Insights and Forecast - by End-user
- 6.3.1. Consmer electronics
- 6.3.2. Fashion & garments
- 6.3.3. Healthcare
- 6.3.4. Leisure & entertainment
- 6.3.5. Retail
- 6.3.6. Other End-users
- 6.1. Market Analysis, Insights and Forecast - by Channel
- 7. North America BNPL Industry in India Analysis, Insights and Forecast, 2020-2032
- 7.1. Market Analysis, Insights and Forecast - by Channel
- 7.1.1. Online
- 7.1.2. POS
- 7.2. Market Analysis, Insights and Forecast - by Enterprise
- 7.2.1. Large Enterprise
- 7.2.2. Small & medium enterprise
- 7.3. Market Analysis, Insights and Forecast - by End-user
- 7.3.1. Consmer electronics
- 7.3.2. Fashion & garments
- 7.3.3. Healthcare
- 7.3.4. Leisure & entertainment
- 7.3.5. Retail
- 7.3.6. Other End-users
- 7.1. Market Analysis, Insights and Forecast - by Channel
- 8. South America BNPL Industry in India Analysis, Insights and Forecast, 2020-2032
- 8.1. Market Analysis, Insights and Forecast - by Channel
- 8.1.1. Online
- 8.1.2. POS
- 8.2. Market Analysis, Insights and Forecast - by Enterprise
- 8.2.1. Large Enterprise
- 8.2.2. Small & medium enterprise
- 8.3. Market Analysis, Insights and Forecast - by End-user
- 8.3.1. Consmer electronics
- 8.3.2. Fashion & garments
- 8.3.3. Healthcare
- 8.3.4. Leisure & entertainment
- 8.3.5. Retail
- 8.3.6. Other End-users
- 8.1. Market Analysis, Insights and Forecast - by Channel
- 9. Europe BNPL Industry in India Analysis, Insights and Forecast, 2020-2032
- 9.1. Market Analysis, Insights and Forecast - by Channel
- 9.1.1. Online
- 9.1.2. POS
- 9.2. Market Analysis, Insights and Forecast - by Enterprise
- 9.2.1. Large Enterprise
- 9.2.2. Small & medium enterprise
- 9.3. Market Analysis, Insights and Forecast - by End-user
- 9.3.1. Consmer electronics
- 9.3.2. Fashion & garments
- 9.3.3. Healthcare
- 9.3.4. Leisure & entertainment
- 9.3.5. Retail
- 9.3.6. Other End-users
- 9.1. Market Analysis, Insights and Forecast - by Channel
- 10. Middle East & Africa BNPL Industry in India Analysis, Insights and Forecast, 2020-2032
- 10.1. Market Analysis, Insights and Forecast - by Channel
- 10.1.1. Online
- 10.1.2. POS
- 10.2. Market Analysis, Insights and Forecast - by Enterprise
- 10.2.1. Large Enterprise
- 10.2.2. Small & medium enterprise
- 10.3. Market Analysis, Insights and Forecast - by End-user
- 10.3.1. Consmer electronics
- 10.3.2. Fashion & garments
- 10.3.3. Healthcare
- 10.3.4. Leisure & entertainment
- 10.3.5. Retail
- 10.3.6. Other End-users
- 10.1. Market Analysis, Insights and Forecast - by Channel
- 11. Asia Pacific BNPL Industry in India Analysis, Insights and Forecast, 2020-2032
- 11.1. Market Analysis, Insights and Forecast - by Channel
- 11.1.1. Online
- 11.1.2. POS
- 11.2. Market Analysis, Insights and Forecast - by Enterprise
- 11.2.1. Large Enterprise
- 11.2.2. Small & medium enterprise
- 11.3. Market Analysis, Insights and Forecast - by End-user
- 11.3.1. Consmer electronics
- 11.3.2. Fashion & garments
- 11.3.3. Healthcare
- 11.3.4. Leisure & entertainment
- 11.3.5. Retail
- 11.3.6. Other End-users
- 11.1. Market Analysis, Insights and Forecast - by Channel
- 12. Competitive Analysis
- 12.1. Company Profiles
- 12.1.1 Zest Money BNPL
- 12.1.1.1. Company Overview
- 12.1.1.2. Products
- 12.1.1.3. Company Financials
- 12.1.1.4. SWOT Analysis
- 12.1.2 Free charge
- 12.1.2.1. Company Overview
- 12.1.2.2. Products
- 12.1.2.3. Company Financials
- 12.1.2.4. SWOT Analysis
- 12.1.3 Paytm postpaid
- 12.1.3.1. Company Overview
- 12.1.3.2. Products
- 12.1.3.3. Company Financials
- 12.1.3.4. SWOT Analysis
- 12.1.4 epayLater
- 12.1.4.1. Company Overview
- 12.1.4.2. Products
- 12.1.4.3. Company Financials
- 12.1.4.4. SWOT Analysis
- 12.1.5 Mobikwik ZIP
- 12.1.5.1. Company Overview
- 12.1.5.2. Products
- 12.1.5.3. Company Financials
- 12.1.5.4. SWOT Analysis
- 12.1.6 Flipkart pay later
- 12.1.6.1. Company Overview
- 12.1.6.2. Products
- 12.1.6.3. Company Financials
- 12.1.6.4. SWOT Analysis
- 12.1.7 Olamoney Postpaid
- 12.1.7.1. Company Overview
- 12.1.7.2. Products
- 12.1.7.3. Company Financials
- 12.1.7.4. SWOT Analysis
- 12.1.8 Money Tap
- 12.1.8.1. Company Overview
- 12.1.8.2. Products
- 12.1.8.3. Company Financials
- 12.1.8.4. SWOT Analysis
- 12.1.9 Simpl
- 12.1.9.1. Company Overview
- 12.1.9.2. Products
- 12.1.9.3. Company Financials
- 12.1.9.4. SWOT Analysis
- 12.1.10 Lazy Pay
- 12.1.10.1. Company Overview
- 12.1.10.2. Products
- 12.1.10.3. Company Financials
- 12.1.10.4. SWOT Analysis
- 12.1.11 Flexmoney
- 12.1.11.1. Company Overview
- 12.1.11.2. Products
- 12.1.11.3. Company Financials
- 12.1.11.4. SWOT Analysis
- 12.1.12 Amazon Pay later
- 12.1.12.1. Company Overview
- 12.1.12.2. Products
- 12.1.12.3. Company Financials
- 12.1.12.4. SWOT Analysis
- 12.1.13 Capital float
- 12.1.13.1. Company Overview
- 12.1.13.2. Products
- 12.1.13.3. Company Financials
- 12.1.13.4. SWOT Analysis
- 12.1.14 Slice
- 12.1.14.1. Company Overview
- 12.1.14.2. Products
- 12.1.14.3. Company Financials
- 12.1.14.4. SWOT Analysis
- 12.1.15 Kreditbee
- 12.1.15.1. Company Overview
- 12.1.15.2. Products
- 12.1.15.3. Company Financials
- 12.1.15.4. SWOT Analysis
- 12.1.16 Postpe**List Not Exhaustive
- 12.1.16.1. Company Overview
- 12.1.16.2. Products
- 12.1.16.3. Company Financials
- 12.1.16.4. SWOT Analysis
- 12.1.1 Zest Money BNPL
- 12.2. Market Entropy
- 12.2.1 Company's Key Areas Served
- 12.2.2 Recent Developments
- 12.3. Company Market Share Analysis 2025
- 12.3.1 Top 5 Companies Market Share Analysis
- 12.3.2 Top 3 Companies Market Share Analysis
- 12.4. List of Potential Customers
- 13. Research Methodology
List of Figures
- Figure 1: Global BNPL Industry in India Revenue Breakdown (billion, %) by Region 2025 & 2033
- Figure 2: North America BNPL Industry in India Revenue (billion), by Channel 2025 & 2033
- Figure 3: North America BNPL Industry in India Revenue Share (%), by Channel 2025 & 2033
- Figure 4: North America BNPL Industry in India Revenue (billion), by Enterprise 2025 & 2033
- Figure 5: North America BNPL Industry in India Revenue Share (%), by Enterprise 2025 & 2033
- Figure 6: North America BNPL Industry in India Revenue (billion), by End-user 2025 & 2033
- Figure 7: North America BNPL Industry in India Revenue Share (%), by End-user 2025 & 2033
- Figure 8: North America BNPL Industry in India Revenue (billion), by Country 2025 & 2033
- Figure 9: North America BNPL Industry in India Revenue Share (%), by Country 2025 & 2033
- Figure 10: South America BNPL Industry in India Revenue (billion), by Channel 2025 & 2033
- Figure 11: South America BNPL Industry in India Revenue Share (%), by Channel 2025 & 2033
- Figure 12: South America BNPL Industry in India Revenue (billion), by Enterprise 2025 & 2033
- Figure 13: South America BNPL Industry in India Revenue Share (%), by Enterprise 2025 & 2033
- Figure 14: South America BNPL Industry in India Revenue (billion), by End-user 2025 & 2033
- Figure 15: South America BNPL Industry in India Revenue Share (%), by End-user 2025 & 2033
- Figure 16: South America BNPL Industry in India Revenue (billion), by Country 2025 & 2033
- Figure 17: South America BNPL Industry in India Revenue Share (%), by Country 2025 & 2033
- Figure 18: Europe BNPL Industry in India Revenue (billion), by Channel 2025 & 2033
- Figure 19: Europe BNPL Industry in India Revenue Share (%), by Channel 2025 & 2033
- Figure 20: Europe BNPL Industry in India Revenue (billion), by Enterprise 2025 & 2033
- Figure 21: Europe BNPL Industry in India Revenue Share (%), by Enterprise 2025 & 2033
- Figure 22: Europe BNPL Industry in India Revenue (billion), by End-user 2025 & 2033
- Figure 23: Europe BNPL Industry in India Revenue Share (%), by End-user 2025 & 2033
- Figure 24: Europe BNPL Industry in India Revenue (billion), by Country 2025 & 2033
- Figure 25: Europe BNPL Industry in India Revenue Share (%), by Country 2025 & 2033
- Figure 26: Middle East & Africa BNPL Industry in India Revenue (billion), by Channel 2025 & 2033
- Figure 27: Middle East & Africa BNPL Industry in India Revenue Share (%), by Channel 2025 & 2033
- Figure 28: Middle East & Africa BNPL Industry in India Revenue (billion), by Enterprise 2025 & 2033
- Figure 29: Middle East & Africa BNPL Industry in India Revenue Share (%), by Enterprise 2025 & 2033
- Figure 30: Middle East & Africa BNPL Industry in India Revenue (billion), by End-user 2025 & 2033
- Figure 31: Middle East & Africa BNPL Industry in India Revenue Share (%), by End-user 2025 & 2033
- Figure 32: Middle East & Africa BNPL Industry in India Revenue (billion), by Country 2025 & 2033
- Figure 33: Middle East & Africa BNPL Industry in India Revenue Share (%), by Country 2025 & 2033
- Figure 34: Asia Pacific BNPL Industry in India Revenue (billion), by Channel 2025 & 2033
- Figure 35: Asia Pacific BNPL Industry in India Revenue Share (%), by Channel 2025 & 2033
- Figure 36: Asia Pacific BNPL Industry in India Revenue (billion), by Enterprise 2025 & 2033
- Figure 37: Asia Pacific BNPL Industry in India Revenue Share (%), by Enterprise 2025 & 2033
- Figure 38: Asia Pacific BNPL Industry in India Revenue (billion), by End-user 2025 & 2033
- Figure 39: Asia Pacific BNPL Industry in India Revenue Share (%), by End-user 2025 & 2033
- Figure 40: Asia Pacific BNPL Industry in India Revenue (billion), by Country 2025 & 2033
- Figure 41: Asia Pacific BNPL Industry in India Revenue Share (%), by Country 2025 & 2033
List of Tables
- Table 1: Global BNPL Industry in India Revenue billion Forecast, by Channel 2020 & 2033
- Table 2: Global BNPL Industry in India Revenue billion Forecast, by Enterprise 2020 & 2033
- Table 3: Global BNPL Industry in India Revenue billion Forecast, by End-user 2020 & 2033
- Table 4: Global BNPL Industry in India Revenue billion Forecast, by Region 2020 & 2033
- Table 5: Global BNPL Industry in India Revenue billion Forecast, by Channel 2020 & 2033
- Table 6: Global BNPL Industry in India Revenue billion Forecast, by Enterprise 2020 & 2033
- Table 7: Global BNPL Industry in India Revenue billion Forecast, by End-user 2020 & 2033
- Table 8: Global BNPL Industry in India Revenue billion Forecast, by Country 2020 & 2033
- Table 9: United States BNPL Industry in India Revenue (billion) Forecast, by Application 2020 & 2033
- Table 10: Canada BNPL Industry in India Revenue (billion) Forecast, by Application 2020 & 2033
- Table 11: Mexico BNPL Industry in India Revenue (billion) Forecast, by Application 2020 & 2033
- Table 12: Global BNPL Industry in India Revenue billion Forecast, by Channel 2020 & 2033
- Table 13: Global BNPL Industry in India Revenue billion Forecast, by Enterprise 2020 & 2033
- Table 14: Global BNPL Industry in India Revenue billion Forecast, by End-user 2020 & 2033
- Table 15: Global BNPL Industry in India Revenue billion Forecast, by Country 2020 & 2033
- Table 16: Brazil BNPL Industry in India Revenue (billion) Forecast, by Application 2020 & 2033
- Table 17: Argentina BNPL Industry in India Revenue (billion) Forecast, by Application 2020 & 2033
- Table 18: Rest of South America BNPL Industry in India Revenue (billion) Forecast, by Application 2020 & 2033
- Table 19: Global BNPL Industry in India Revenue billion Forecast, by Channel 2020 & 2033
- Table 20: Global BNPL Industry in India Revenue billion Forecast, by Enterprise 2020 & 2033
- Table 21: Global BNPL Industry in India Revenue billion Forecast, by End-user 2020 & 2033
- Table 22: Global BNPL Industry in India Revenue billion Forecast, by Country 2020 & 2033
- Table 23: United Kingdom BNPL Industry in India Revenue (billion) Forecast, by Application 2020 & 2033
- Table 24: Germany BNPL Industry in India Revenue (billion) Forecast, by Application 2020 & 2033
- Table 25: France BNPL Industry in India Revenue (billion) Forecast, by Application 2020 & 2033
- Table 26: Italy BNPL Industry in India Revenue (billion) Forecast, by Application 2020 & 2033
- Table 27: Spain BNPL Industry in India Revenue (billion) Forecast, by Application 2020 & 2033
- Table 28: Russia BNPL Industry in India Revenue (billion) Forecast, by Application 2020 & 2033
- Table 29: Benelux BNPL Industry in India Revenue (billion) Forecast, by Application 2020 & 2033
- Table 30: Nordics BNPL Industry in India Revenue (billion) Forecast, by Application 2020 & 2033
- Table 31: Rest of Europe BNPL Industry in India Revenue (billion) Forecast, by Application 2020 & 2033
- Table 32: Global BNPL Industry in India Revenue billion Forecast, by Channel 2020 & 2033
- Table 33: Global BNPL Industry in India Revenue billion Forecast, by Enterprise 2020 & 2033
- Table 34: Global BNPL Industry in India Revenue billion Forecast, by End-user 2020 & 2033
- Table 35: Global BNPL Industry in India Revenue billion Forecast, by Country 2020 & 2033
- Table 36: Turkey BNPL Industry in India Revenue (billion) Forecast, by Application 2020 & 2033
- Table 37: Israel BNPL Industry in India Revenue (billion) Forecast, by Application 2020 & 2033
- Table 38: GCC BNPL Industry in India Revenue (billion) Forecast, by Application 2020 & 2033
- Table 39: North Africa BNPL Industry in India Revenue (billion) Forecast, by Application 2020 & 2033
- Table 40: South Africa BNPL Industry in India Revenue (billion) Forecast, by Application 2020 & 2033
- Table 41: Rest of Middle East & Africa BNPL Industry in India Revenue (billion) Forecast, by Application 2020 & 2033
- Table 42: Global BNPL Industry in India Revenue billion Forecast, by Channel 2020 & 2033
- Table 43: Global BNPL Industry in India Revenue billion Forecast, by Enterprise 2020 & 2033
- Table 44: Global BNPL Industry in India Revenue billion Forecast, by End-user 2020 & 2033
- Table 45: Global BNPL Industry in India Revenue billion Forecast, by Country 2020 & 2033
- Table 46: China BNPL Industry in India Revenue (billion) Forecast, by Application 2020 & 2033
- Table 47: India BNPL Industry in India Revenue (billion) Forecast, by Application 2020 & 2033
- Table 48: Japan BNPL Industry in India Revenue (billion) Forecast, by Application 2020 & 2033
- Table 49: South Korea BNPL Industry in India Revenue (billion) Forecast, by Application 2020 & 2033
- Table 50: ASEAN BNPL Industry in India Revenue (billion) Forecast, by Application 2020 & 2033
- Table 51: Oceania BNPL Industry in India Revenue (billion) Forecast, by Application 2020 & 2033
- Table 52: Rest of Asia Pacific BNPL Industry in India Revenue (billion) Forecast, by Application 2020 & 2033
Frequently Asked Questions
1. What is the projected Compound Annual Growth Rate (CAGR) of the BNPL Industry in India?
The projected CAGR is approximately 13.4%.
2. Which companies are prominent players in the BNPL Industry in India?
Key companies in the market include Zest Money BNPL, Free charge, Paytm postpaid, epayLater, Mobikwik ZIP, Flipkart pay later, Olamoney Postpaid, Money Tap, Simpl, Lazy Pay, Flexmoney, Amazon Pay later, Capital float, Slice, Kreditbee, Postpe**List Not Exhaustive.
3. What are the main segments of the BNPL Industry in India?
The market segments include Channel, Enterprise, End-user.
4. Can you provide details about the market size?
The market size is estimated to be USD 21.95 billion as of 2022.
5. What are some drivers contributing to market growth?
Increasing e-commerce adoption; Rising middle class and disposable income; Access to credit and financial inclusion.
6. What are the notable trends driving market growth?
Surging E-commerce and Digital P2M Payments Boosting the Market.
7. Are there any restraints impacting market growth?
Increasing e-commerce adoption; Rising middle class and disposable income; Access to credit and financial inclusion.
8. Can you provide examples of recent developments in the market?
May 2023: ZestMoney plans to be profitable in 6 months. The fintech firm is said to be finalizing a new investment round from its existing shareholders, including Quona Capital, Zip, Omidyar Network India, Flourish VC, and Scarlet Digital. To ensure business continuity, ZestMoney plans to operate as a lending service provider (LSP), partnering with banks and NBFCs to write out loans rather than lending directly from its balance sheet.
9. What pricing options are available for accessing the report?
Pricing options include single-user, multi-user, and enterprise licenses priced at USD 3800, USD 4500, and USD 5800 respectively.
10. Is the market size provided in terms of value or volume?
The market size is provided in terms of value, measured in billion.
11. Are there any specific market keywords associated with the report?
Yes, the market keyword associated with the report is "BNPL Industry in India," which aids in identifying and referencing the specific market segment covered.
12. How do I determine which pricing option suits my needs best?
The pricing options vary based on user requirements and access needs. Individual users may opt for single-user licenses, while businesses requiring broader access may choose multi-user or enterprise licenses for cost-effective access to the report.
13. Are there any additional resources or data provided in the BNPL Industry in India report?
While the report offers comprehensive insights, it's advisable to review the specific contents or supplementary materials provided to ascertain if additional resources or data are available.
14. How can I stay updated on further developments or reports in the BNPL Industry in India?
To stay informed about further developments, trends, and reports in the BNPL Industry in India, consider subscribing to industry newsletters, following relevant companies and organizations, or regularly checking reputable industry news sources and publications.
Methodology
Step 1 - Identification of Relevant Samples Size from Population Database


Step 2 - Approaches for Defining Global Market Size (Value, Volume* & Price*)

Note*: In applicable scenarios
Step 3 - Data Sources
Primary Research
- Web Analytics
- Survey Reports
- Research Institute
- Latest Research Reports
- Opinion Leaders
Secondary Research
- Annual Reports
- White Paper
- Latest Press Release
- Industry Association
- Paid Database
- Investor Presentations

Step 4 - Data Triangulation
Involves using different sources of information in order to increase the validity of a study
These sources are likely to be stakeholders in a program - participants, other researchers, program staff, other community members, and so on.
Then we put all data in single framework & apply various statistical tools to find out the dynamic on the market.
During the analysis stage, feedback from the stakeholder groups would be compared to determine areas of agreement as well as areas of divergence