

Key Insights
The Asia Pacific capital market exchange ecosystem is poised for significant expansion, propelled by increasing financialization, robust economic development across key nations, and proactive government initiatives aimed at fostering capital market growth. The region's diverse economic landscape, a growing middle class, and enhanced investor acumen are collectively driving demand for sophisticated investment products and services. The projected market size is anticipated to reach 1120 billion by 2025, with a compound annual growth rate (CAGR) of 5.48, indicating substantial growth from the base year of 2025 and beyond. Prominent exchanges such as Shanghai, Tokyo, and Hong Kong are pivotal, drawing substantial domestic and international investment. The integration of fintech and algorithmic trading is revolutionizing market operations, boosting efficiency, and sustaining this growth trajectory. Despite potential regulatory complexities and geopolitical considerations, the outlook remains optimistic, with regional governments committed to deepening and diversifying their capital markets.
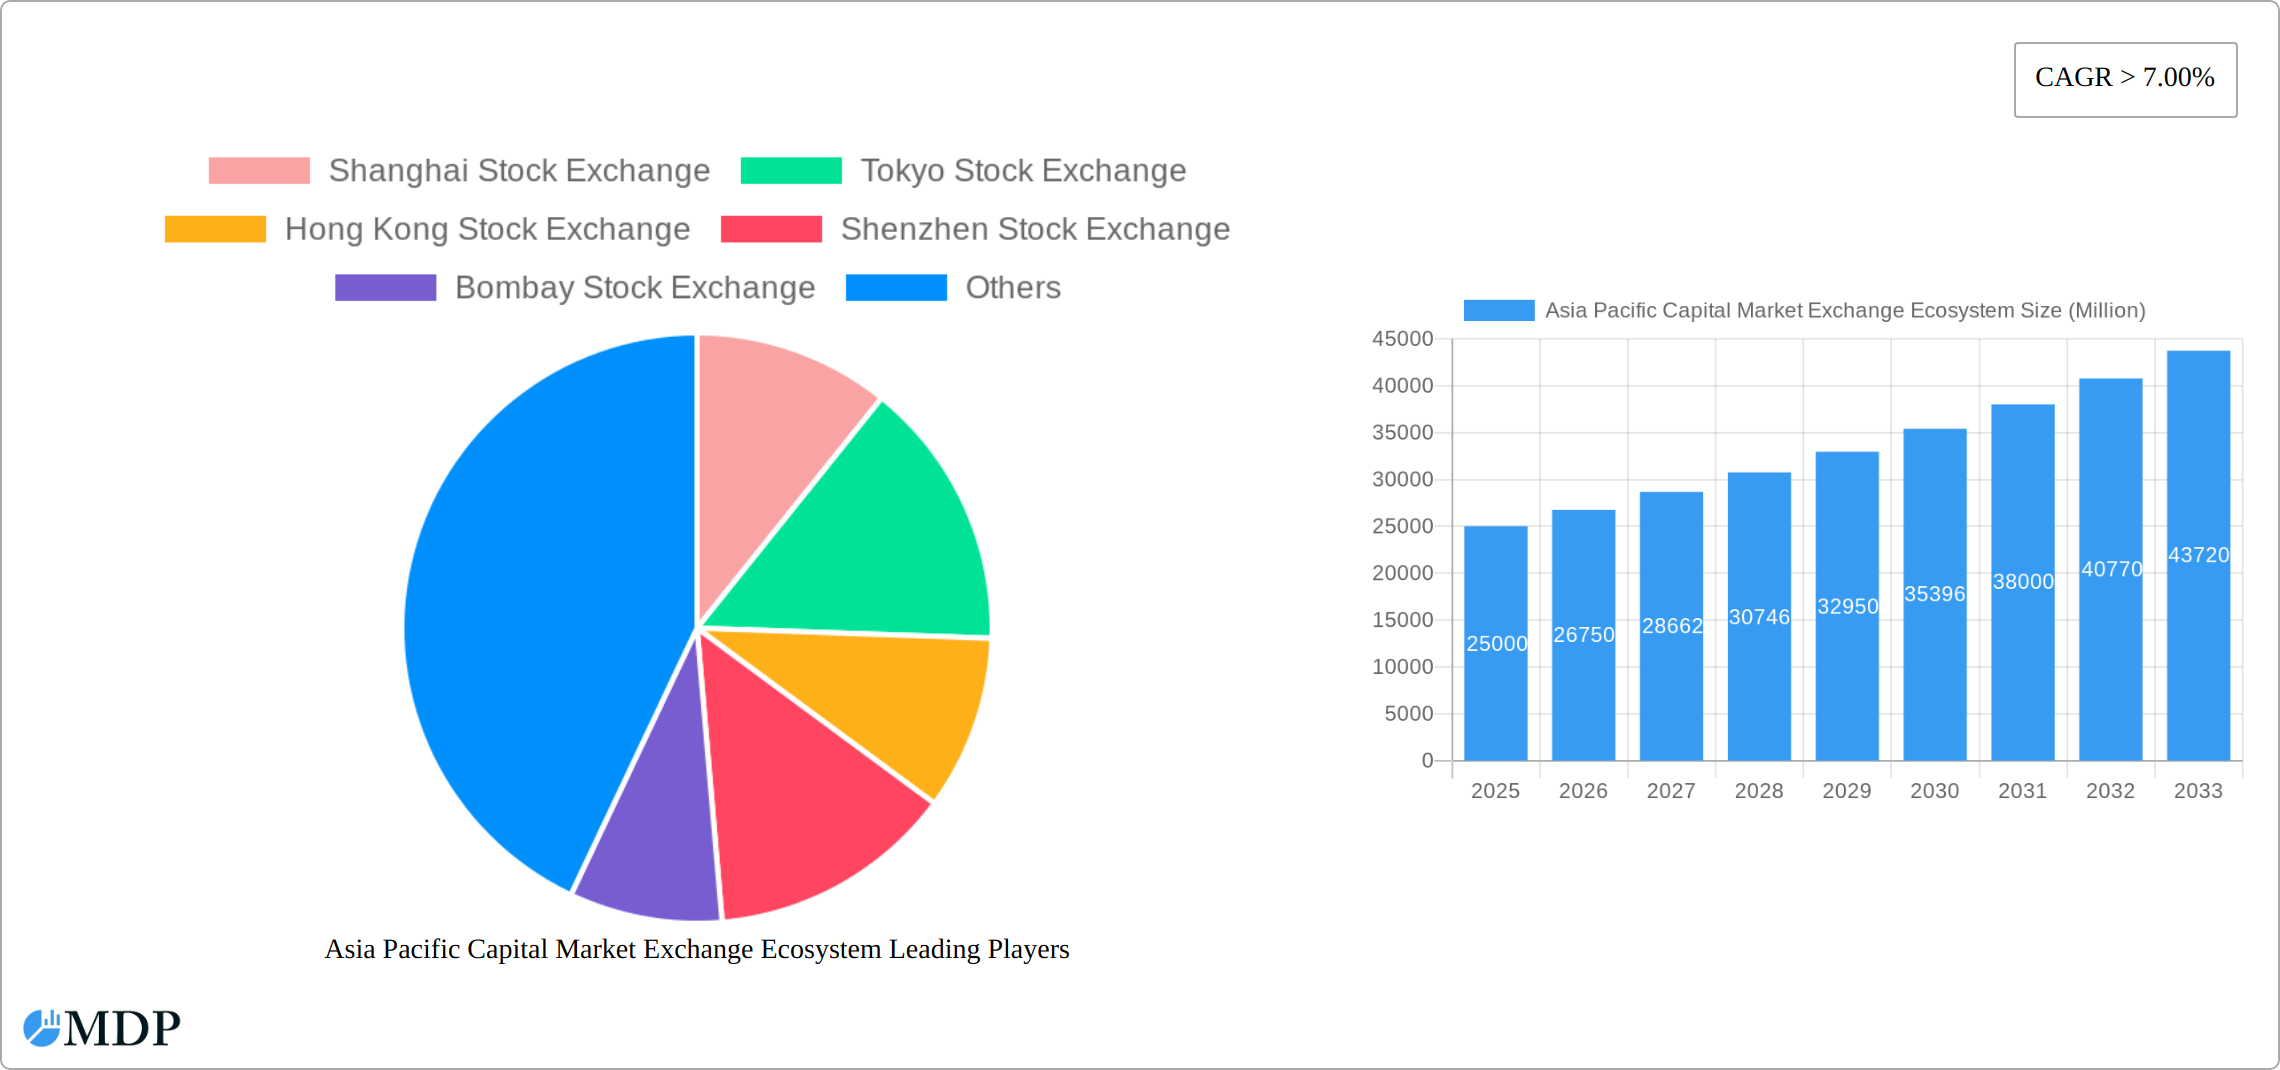
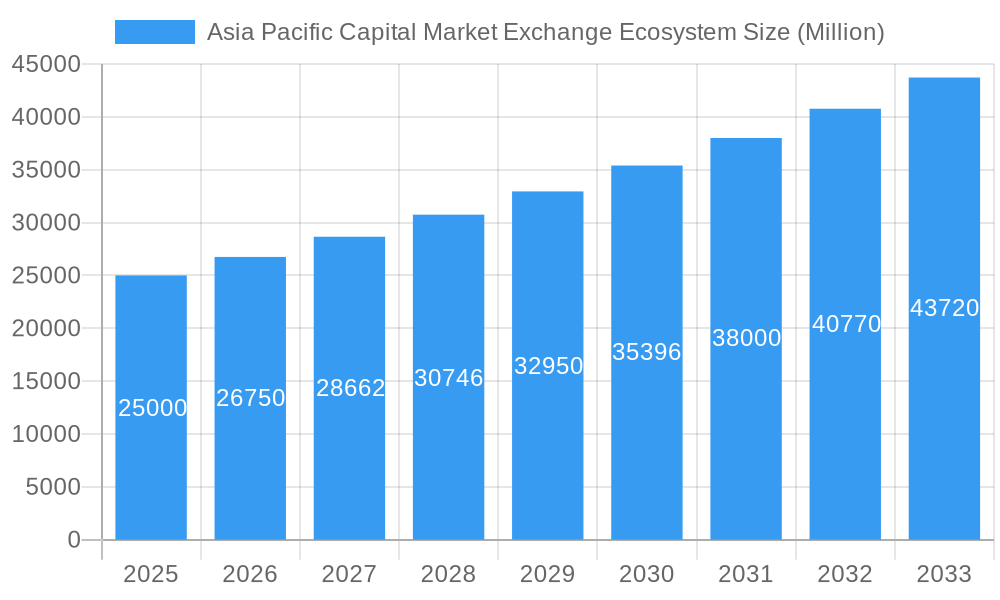
Asia Pacific Capital Market Exchange Ecosystem Market Size (In Million)
Growth dynamics within the Asia Pacific capital market exchange ecosystem are expected to exhibit regional variations, influenced by economic stability, regulatory frameworks, and investor sentiment. While major exchanges like Shanghai, Tokyo, and Hong Kong dominate market share, smaller exchanges and alternative trading platforms play a crucial role in the broader ecosystem. Future developments will likely involve heightened competition and a stronger focus on innovation to attract investors and secure a competitive advantage. Moreover, the incorporation of sustainable finance principles and ESG factors is set to redefine market direction, attracting further investment and shaping forthcoming regulatory landscapes.
Asia Pacific Capital Market Exchange Ecosystem Company Market Share
Asia Pacific Capital Market Exchange Ecosystem: A Comprehensive Market Report (2019-2033)
This in-depth report provides a comprehensive analysis of the Asia Pacific Capital Market Exchange Ecosystem, offering invaluable insights for investors, industry stakeholders, and strategic decision-makers. Covering the period from 2019 to 2033 (Base Year: 2025, Forecast Period: 2025-2033), this report meticulously examines market dynamics, trends, leading players, and future growth prospects across the region. The report leverages extensive data analysis and expert insights to deliver actionable intelligence for navigating this dynamic and evolving landscape. The total market size is predicted to reach xx Million by 2033.
Asia Pacific Capital Market Exchange Ecosystem Market Dynamics & Concentration
The Asia Pacific capital market exchange ecosystem presents a dynamic and multifaceted landscape. While a few prominent exchanges hold significant sway, the region is witnessing a surge in competition fueled by technological advancements, evolving regulatory environments, and an increasing volume of cross-border capital flows. This dynamic interplay is reshaping market concentration and driving strategic adaptations among participants.
- Market Share & Evolution: The leading exchanges, including the Shanghai Stock Exchange, Tokyo Stock Exchange, Hong Kong Stock Exchange, and Shenzhen Stock Exchange, collectively dominate a substantial portion of regional trading volume. However, a nuanced view reveals that the precise market share distribution is fluid, influenced by factors such as new listings, technological adoption rates, and the economic performance of their respective domiciles. (Note: Precise, real-time market share figures are subject to continuous change and are best sourced from up-to-the-minute financial data providers.)
- M&A Activity & Strategic Alliances: Over the past half-decade, the ecosystem has experienced targeted M&A activities and strategic partnerships. These initiatives are largely driven by the pursuit of scale, the desire to expand into burgeoning markets, and the strategic need to diversify product and service offerings. Beyond direct acquisitions, collaborations in areas like technology sharing and market data integration are becoming increasingly prevalent.
- Innovation Drivers: The relentless pace of technological innovation, particularly within the fintech sector, is a primary catalyst for evolution. This includes the development and widespread adoption of sophisticated trading platforms, algorithmic trading strategies, advanced data analytics for market insights, and robust risk management frameworks. Furthermore, regulatory directives aimed at promoting digital transformation, enhancing market accessibility, and facilitating cross-border transactions are critical drivers of innovation.
- Regulatory Frameworks & Harmonization Efforts: The diverse and often disparate regulatory frameworks across Asia Pacific nations present both strategic opportunities and operational complexities. While some regulatory divergence fosters niche market development, ongoing efforts towards harmonization are crucial for promoting seamless cross-border trading, enhancing market efficiency, and attracting international investment. The progress of these harmonization initiatives significantly impacts the future integration of the regional exchange ecosystem.
- Emerging Competitors & Substitutes: The rise of decentralized finance (DeFi) protocols and alternative trading venues represents a nascent but potentially disruptive force. While currently serving a distinct segment of the market, their long-term impact on traditional exchanges, particularly concerning asset tokenization and novel trading mechanisms, warrants close observation.
- End-User Trends & Diversification: The user base is characterized by a spectrum of participants, including large institutional investors, high-net-worth individuals, and a growing cohort of retail investors. The investment strategies and trading behaviors of these groups are intricately linked to macroeconomic conditions, evolving market sentiment, shifts in regulatory landscapes, and the increasing availability of user-friendly digital investment tools.
Asia Pacific Capital Market Exchange Ecosystem Industry Trends & Analysis
The Asia Pacific capital market exchange ecosystem exhibits robust growth, driven by several key trends. Economic expansion in several key economies fuels increased trading activity. Technological disruptions, such as the adoption of blockchain technology and artificial intelligence, are transforming trading processes and improving market efficiency. This is further fueled by evolving consumer preferences, with an increasing demand for digital trading platforms and innovative investment products. Competitive dynamics are characterized by both intense rivalry among established exchanges and the emergence of new, technology-driven players.
The Compound Annual Growth Rate (CAGR) is estimated at xx% for the forecast period (2025-2033). Market penetration of digital trading platforms is expected to exceed xx% by 2033, driven by increased smartphone usage and investor preference for online trading.
Leading Markets & Segments in Asia Pacific Capital Market Exchange Ecosystem
China and Japan currently dominate the Asia Pacific capital market exchange ecosystem, driven by their large economies, well-established financial markets, and supportive government policies. However, other markets, such as Hong Kong, Singapore, and India are experiencing significant growth and are poised to increase their market share in the coming years.
Key Drivers of Dominance:
- China: Robust economic growth, supportive regulatory environment, and massive domestic investor base.
- Japan: Established financial infrastructure, deep liquidity, and a large pool of institutional investors.
- Hong Kong: Strategic geographic location, robust legal framework, and access to international capital markets.
Detailed Dominance Analysis: The dominance of China and Japan is attributed to factors such as size and maturity of their capital markets. However, other countries show promising potential due to their rapid economic development and progressive reforms. For example, India's burgeoning middle class and increased financial inclusion contribute to significant growth potential. The dominance analysis includes a detailed comparative assessment of key metrics, like trading volume, market capitalization, and the number of listed companies, across major markets.
Asia Pacific Capital Market Exchange Ecosystem Product Developments
Recent product innovations focus on enhancing trading efficiency, improving risk management, and expanding the range of available investment products. This includes the introduction of advanced trading platforms, algorithmic trading tools, and digital asset trading capabilities. Competitive advantages are derived from superior technology, efficient regulatory compliance, and strong brand reputation. Technological trends point toward increased automation, greater data analytics capabilities, and the integration of blockchain technology. Market fit is determined by regulatory compliance, investor demand, and overall ease of use.
Key Drivers of Asia Pacific Capital Market Exchange Ecosystem Growth
The robust growth trajectory of the Asia Pacific capital market exchange ecosystem is underpinned by a confluence of powerful factors. Sustained economic expansion across the region directly translates into increased trading volumes and heightened investment activity. Concurrently, rapid technological advancements, exemplified by the widespread implementation of high-frequency trading systems, sophisticated market surveillance tools, and advanced analytics platforms, are significantly boosting operational efficiency and broadening the appeal of these markets to a diverse investor base. Furthermore, a wave of supportive regulatory reforms, strategically designed to attract foreign direct investment, enhance market transparency, and streamline listing processes, are actively stimulating further growth and consolidating the region's position as a global financial hub.
Challenges in the Asia Pacific Capital Market Exchange Ecosystem Market
Despite its growth, the Asia Pacific capital market exchange ecosystem navigates a complex set of challenges. The inherent diversity of regulatory frameworks across different nations acts as a significant impediment to seamless cross-border trading and introduces considerable complexities for global investors. The ever-present and evolving threat of sophisticated cybersecurity breaches and data compromises poses a critical risk to market integrity and investor confidence. Intense competition, not only among established exchanges but also from agile new entrants in the fintech space, exerts continuous pressure on revenue streams and necessitates ongoing investment in innovation. Moreover, persistent geopolitical tensions and inherent macroeconomic uncertainties can exert considerable influence on market sentiment and lead to volatility in trading activity. The quantifiable impact of these challenges is evident in rising compliance costs, potential reductions in trading volumes during periods of heightened uncertainty, and the substantial capital expenditure required for robust cybersecurity infrastructure.
Emerging Opportunities in Asia Pacific Capital Market Exchange Ecosystem
A landscape of compelling emerging opportunities is poised to propel the long-term expansion of the Asia Pacific capital market exchange ecosystem. The accelerating adoption of cutting-edge fintech solutions, including intuitive mobile trading platforms and sophisticated robo-advisory services, is democratizing market access and broadening investor participation. Strategic alliances and collaborative ventures between established exchanges and innovative fintech companies hold immense potential to accelerate product development and elevate the quality of service offerings. Furthermore, ambitious expansion into high-growth emerging markets within the region presents lucrative avenues for established players to diversify their geographic footprint and capitalize on untapped potential. The burgeoning global emphasis on Environmental, Social, and Governance (ESG) investing, coupled with the continued development of sustainable finance initiatives, further strengthens the positive outlook for the ecosystem's future growth and relevance.
Leading Players in the Asia Pacific Capital Market Exchange Ecosystem Sector
Key Milestones in Asia Pacific Capital Market Exchange Ecosystem Industry
- July 2022: The eligible companies listed on Beijing Stock Exchange were allowed to apply for transfer to the Star Market of the Shanghai Stock Exchange. This move facilitated better integration between different tiers of China's capital markets.
- February 2022: The China Securities Regulatory Commission (CSRC) approved the merger of Shenzhen Stock Exchange's main board with the SME board, streamlining the exchange's structure and improving trading efficiency.
Strategic Outlook for Asia Pacific Capital Market Exchange Ecosystem Market
The Asia Pacific capital market exchange ecosystem is poised for continued expansion, driven by strong economic fundamentals, technological advancements, and supportive regulatory reforms. Strategic partnerships and diversification into new product offerings will be crucial for maintaining competitiveness. The integration of fintech solutions and the emergence of new investment products will reshape the market landscape, creating both challenges and opportunities for established and emerging players. The long-term outlook remains positive, with significant growth potential across the region.
Asia Pacific Capital Market Exchange Ecosystem Segmentation
-
1. Type of Market
- 1.1. Primary Market
- 1.2. Secondary Market
-
2. Financial Product
- 2.1. Debt
- 2.2. Equity
-
3. Investors
- 3.1. Retail Investors
- 3.2. Institutional Investors
Asia Pacific Capital Market Exchange Ecosystem Segmentation By Geography
-
1. Asia Pacific
- 1.1. China
- 1.2. Japan
- 1.3. South Korea
- 1.4. India
- 1.5. Australia
- 1.6. New Zealand
- 1.7. Indonesia
- 1.8. Malaysia
- 1.9. Singapore
- 1.10. Thailand
- 1.11. Vietnam
- 1.12. Philippines
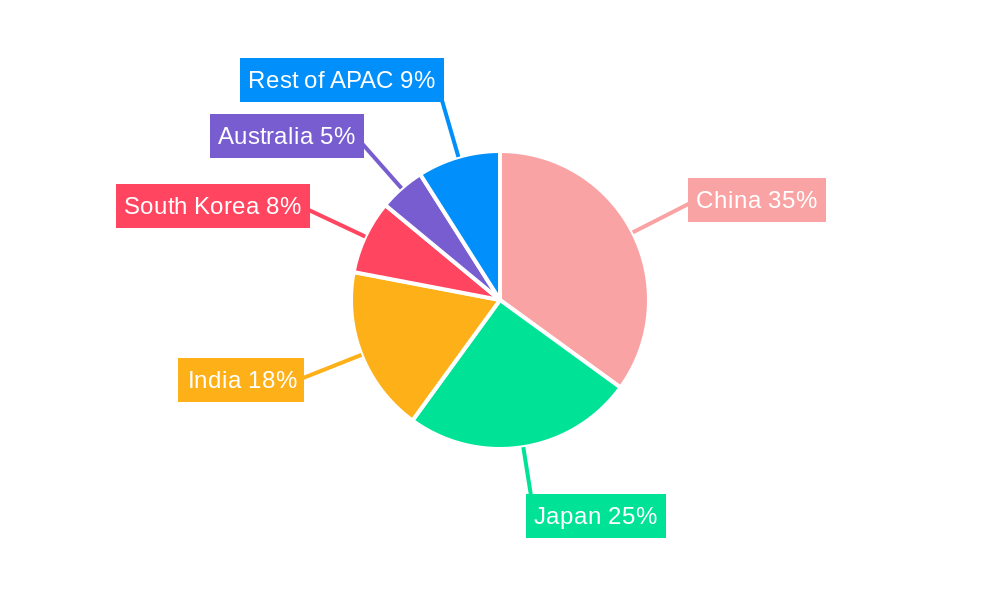
Asia Pacific Capital Market Exchange Ecosystem Regional Market Share
Geographic Coverage of Asia Pacific Capital Market Exchange Ecosystem
Asia Pacific Capital Market Exchange Ecosystem REPORT HIGHLIGHTS
| Aspects | Details |
|---|---|
| Study Period | 2020-2034 |
| Base Year | 2025 |
| Estimated Year | 2026 |
| Forecast Period | 2026-2034 |
| Historical Period | 2020-2025 |
| Growth Rate | CAGR of 5.48% from 2020-2034 |
| Segmentation |
|
Table of Contents
- 1. Introduction
- 1.1. Research Scope
- 1.2. Market Segmentation
- 1.3. Research Objective
- 1.4. Definitions and Assumptions
- 2. Executive Summary
- 2.1. Market Snapshot
- 3. Market Dynamics
- 3.1. Market Drivers
- 3.2. Market Restrains
- 3.3. Market Trends
- 3.4. Market Opportunities
- 4. Market Factor Analysis
- 4.1. Porters Five Forces
- 4.1.1. Bargaining Power of Suppliers
- 4.1.2. Bargaining Power of Buyers
- 4.1.3. Threat of New Entrants
- 4.1.4. Threat of Substitutes
- 4.1.5. Competitive Rivalry
- 4.2. PESTEL analysis
- 4.3. BCG Analysis
- 4.3.1. Stars (High Growth, High Market Share)
- 4.3.2. Cash Cows (Low Growth, High Market Share)
- 4.3.3. Question Mark (High Growth, Low Market Share)
- 4.3.4. Dogs (Low Growth, Low Market Share)
- 4.4. Ansoff Matrix Analysis
- 4.5. Supply Chain Analysis
- 4.6. Regulatory Landscape
- 4.7. Current Market Potential and Opportunity Assessment (TAM–SAM–SOM Framework)
- 4.8. MDP Analyst Note
- 4.1. Porters Five Forces
- 5. Market Analysis, Insights and Forecast 2021-2033
- 5.1. Market Analysis, Insights and Forecast - by Type of Market
- 5.1.1. Primary Market
- 5.1.2. Secondary Market
- 5.2. Market Analysis, Insights and Forecast - by Financial Product
- 5.2.1. Debt
- 5.2.2. Equity
- 5.3. Market Analysis, Insights and Forecast - by Investors
- 5.3.1. Retail Investors
- 5.3.2. Institutional Investors
- 5.4. Market Analysis, Insights and Forecast - by Region
- 5.4.1. Asia Pacific
- 5.1. Market Analysis, Insights and Forecast - by Type of Market
- 6. Asia Pacific Capital Market Exchange Ecosystem Analysis, Insights and Forecast, 2021-2033
- 6.1. Market Analysis, Insights and Forecast - by Type of Market
- 6.1.1. Primary Market
- 6.1.2. Secondary Market
- 6.2. Market Analysis, Insights and Forecast - by Financial Product
- 6.2.1. Debt
- 6.2.2. Equity
- 6.3. Market Analysis, Insights and Forecast - by Investors
- 6.3.1. Retail Investors
- 6.3.2. Institutional Investors
- 6.1. Market Analysis, Insights and Forecast - by Type of Market
- 7. Competitive Analysis
- 7.1. Company Profiles
- 7.1.1 Shanghai Stock Exchange
- 7.1.1.1. Company Overview
- 7.1.1.2. Products
- 7.1.1.3. Company Financials
- 7.1.1.4. SWOT Analysis
- 7.1.2 Tokyo Stock Exchange
- 7.1.2.1. Company Overview
- 7.1.2.2. Products
- 7.1.2.3. Company Financials
- 7.1.2.4. SWOT Analysis
- 7.1.3 Hong Kong Stock Exchange
- 7.1.3.1. Company Overview
- 7.1.3.2. Products
- 7.1.3.3. Company Financials
- 7.1.3.4. SWOT Analysis
- 7.1.4 Shenzhen Stock Exchange
- 7.1.4.1. Company Overview
- 7.1.4.2. Products
- 7.1.4.3. Company Financials
- 7.1.4.4. SWOT Analysis
- 7.1.5 Bombay Stock Exchange
- 7.1.5.1. Company Overview
- 7.1.5.2. Products
- 7.1.5.3. Company Financials
- 7.1.5.4. SWOT Analysis
- 7.1.6 National Stock Exchange
- 7.1.6.1. Company Overview
- 7.1.6.2. Products
- 7.1.6.3. Company Financials
- 7.1.6.4. SWOT Analysis
- 7.1.7 Korea Exchange
- 7.1.7.1. Company Overview
- 7.1.7.2. Products
- 7.1.7.3. Company Financials
- 7.1.7.4. SWOT Analysis
- 7.1.8 Taiwan Stock Exchange
- 7.1.8.1. Company Overview
- 7.1.8.2. Products
- 7.1.8.3. Company Financials
- 7.1.8.4. SWOT Analysis
- 7.1.9 Singapore Exchange
- 7.1.9.1. Company Overview
- 7.1.9.2. Products
- 7.1.9.3. Company Financials
- 7.1.9.4. SWOT Analysis
- 7.1.10 The Stock Exchange of Thailand**List Not Exhaustive
- 7.1.10.1. Company Overview
- 7.1.10.2. Products
- 7.1.10.3. Company Financials
- 7.1.10.4. SWOT Analysis
- 7.1.1 Shanghai Stock Exchange
- 7.2. Market Entropy
- 7.2.1 Company's Key Areas Served
- 7.2.2 Recent Developments
- 7.3. Company Market Share Analysis 2025
- 7.3.1 Top 5 Companies Market Share Analysis
- 7.3.2 Top 3 Companies Market Share Analysis
- 7.4. List of Potential Customers
- 8. Research Methodology
List of Figures
- Figure 1: Asia Pacific Capital Market Exchange Ecosystem Revenue Breakdown (billion, %) by Product 2025 & 2033
- Figure 2: Asia Pacific Capital Market Exchange Ecosystem Share (%) by Company 2025
List of Tables
- Table 1: Asia Pacific Capital Market Exchange Ecosystem Revenue billion Forecast, by Type of Market 2020 & 2033
- Table 2: Asia Pacific Capital Market Exchange Ecosystem Revenue billion Forecast, by Financial Product 2020 & 2033
- Table 3: Asia Pacific Capital Market Exchange Ecosystem Revenue billion Forecast, by Investors 2020 & 2033
- Table 4: Asia Pacific Capital Market Exchange Ecosystem Revenue billion Forecast, by Region 2020 & 2033
- Table 5: Asia Pacific Capital Market Exchange Ecosystem Revenue billion Forecast, by Type of Market 2020 & 2033
- Table 6: Asia Pacific Capital Market Exchange Ecosystem Revenue billion Forecast, by Financial Product 2020 & 2033
- Table 7: Asia Pacific Capital Market Exchange Ecosystem Revenue billion Forecast, by Investors 2020 & 2033
- Table 8: Asia Pacific Capital Market Exchange Ecosystem Revenue billion Forecast, by Country 2020 & 2033
- Table 9: China Asia Pacific Capital Market Exchange Ecosystem Revenue (billion) Forecast, by Application 2020 & 2033
- Table 10: Japan Asia Pacific Capital Market Exchange Ecosystem Revenue (billion) Forecast, by Application 2020 & 2033
- Table 11: South Korea Asia Pacific Capital Market Exchange Ecosystem Revenue (billion) Forecast, by Application 2020 & 2033
- Table 12: India Asia Pacific Capital Market Exchange Ecosystem Revenue (billion) Forecast, by Application 2020 & 2033
- Table 13: Australia Asia Pacific Capital Market Exchange Ecosystem Revenue (billion) Forecast, by Application 2020 & 2033
- Table 14: New Zealand Asia Pacific Capital Market Exchange Ecosystem Revenue (billion) Forecast, by Application 2020 & 2033
- Table 15: Indonesia Asia Pacific Capital Market Exchange Ecosystem Revenue (billion) Forecast, by Application 2020 & 2033
- Table 16: Malaysia Asia Pacific Capital Market Exchange Ecosystem Revenue (billion) Forecast, by Application 2020 & 2033
- Table 17: Singapore Asia Pacific Capital Market Exchange Ecosystem Revenue (billion) Forecast, by Application 2020 & 2033
- Table 18: Thailand Asia Pacific Capital Market Exchange Ecosystem Revenue (billion) Forecast, by Application 2020 & 2033
- Table 19: Vietnam Asia Pacific Capital Market Exchange Ecosystem Revenue (billion) Forecast, by Application 2020 & 2033
- Table 20: Philippines Asia Pacific Capital Market Exchange Ecosystem Revenue (billion) Forecast, by Application 2020 & 2033
Frequently Asked Questions
1. What is the projected Compound Annual Growth Rate (CAGR) of the Asia Pacific Capital Market Exchange Ecosystem?
The projected CAGR is approximately 5.48%.
2. Which companies are prominent players in the Asia Pacific Capital Market Exchange Ecosystem?
Key companies in the market include Shanghai Stock Exchange, Tokyo Stock Exchange, Hong Kong Stock Exchange, Shenzhen Stock Exchange, Bombay Stock Exchange, National Stock Exchange, Korea Exchange, Taiwan Stock Exchange, Singapore Exchange, The Stock Exchange of Thailand**List Not Exhaustive.
3. What are the main segments of the Asia Pacific Capital Market Exchange Ecosystem?
The market segments include Type of Market, Financial Product, Investors.
4. Can you provide details about the market size?
The market size is estimated to be USD 1120 billion as of 2022.
5. What are some drivers contributing to market growth?
N/A
6. What are the notable trends driving market growth?
Increasing Foreign Direct Investment in Various Developing Economies in Asia-Pacific.
7. Are there any restraints impacting market growth?
N/A
8. Can you provide examples of recent developments in the market?
July 2022: The eligible companies listed on Beijing Stock Exchange were allowed to apply for transfer to the Star Market of the Shanghai Stock Exchange. A transfer system is a positive approach for bridge-building efforts between China's multiple layers of the capital market.
9. What pricing options are available for accessing the report?
Pricing options include single-user, multi-user, and enterprise licenses priced at USD 3800, USD 4500, and USD 5800 respectively.
10. Is the market size provided in terms of value or volume?
The market size is provided in terms of value, measured in billion.
11. Are there any specific market keywords associated with the report?
Yes, the market keyword associated with the report is "Asia Pacific Capital Market Exchange Ecosystem," which aids in identifying and referencing the specific market segment covered.
12. How do I determine which pricing option suits my needs best?
The pricing options vary based on user requirements and access needs. Individual users may opt for single-user licenses, while businesses requiring broader access may choose multi-user or enterprise licenses for cost-effective access to the report.
13. Are there any additional resources or data provided in the Asia Pacific Capital Market Exchange Ecosystem report?
While the report offers comprehensive insights, it's advisable to review the specific contents or supplementary materials provided to ascertain if additional resources or data are available.
14. How can I stay updated on further developments or reports in the Asia Pacific Capital Market Exchange Ecosystem?
To stay informed about further developments, trends, and reports in the Asia Pacific Capital Market Exchange Ecosystem, consider subscribing to industry newsletters, following relevant companies and organizations, or regularly checking reputable industry news sources and publications.
Methodology
Step 1 - Identification of Relevant Samples Size from Population Database


Step 2 - Approaches for Defining Global Market Size (Value, Volume* & Price*)

Note*: In applicable scenarios
Step 3 - Data Sources
Primary Research
- Web Analytics
- Survey Reports
- Research Institute
- Latest Research Reports
- Opinion Leaders
Secondary Research
- Annual Reports
- White Paper
- Latest Press Release
- Industry Association
- Paid Database
- Investor Presentations

Step 4 - Data Triangulation
Involves using different sources of information in order to increase the validity of a study
These sources are likely to be stakeholders in a program - participants, other researchers, program staff, other community members, and so on.
Then we put all data in single framework & apply various statistical tools to find out the dynamic on the market.
During the analysis stage, feedback from the stakeholder groups would be compared to determine areas of agreement as well as areas of divergence