

Key Insights
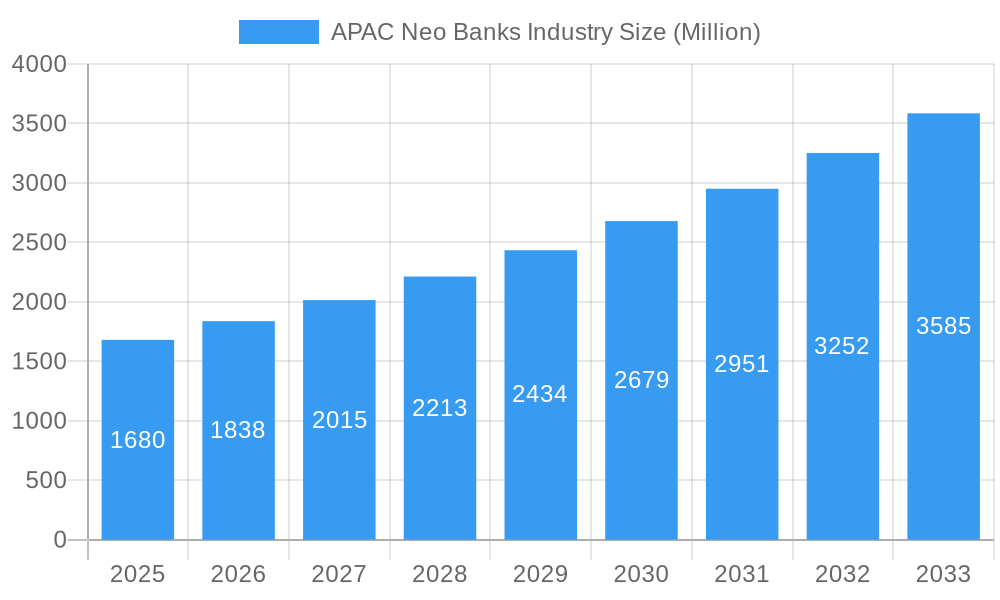
The APAC neo banking industry is experiencing explosive growth, projected to reach a market size of $1.68 billion in 2025 and maintain a Compound Annual Growth Rate (CAGR) exceeding 9% through 2033. This surge is driven by several key factors. Firstly, the region's burgeoning young, tech-savvy population readily embraces digital financial solutions, fueling demand for convenient and user-friendly banking experiences. Secondly, increasing smartphone penetration and robust internet infrastructure provide the ideal platform for neo-banks to thrive. Furthermore, a growing preference for personalized financial products and services, coupled with the limitations of traditional banking models, creates a fertile ground for disruption. Competition is fierce, with established players like WE Bank, Paytm Payments Bank, and SBI Sumishin Net Bank vying for market share alongside innovative startups such as Kakao Bank and Timo. Regulatory changes supporting fintech innovation are also accelerating growth.
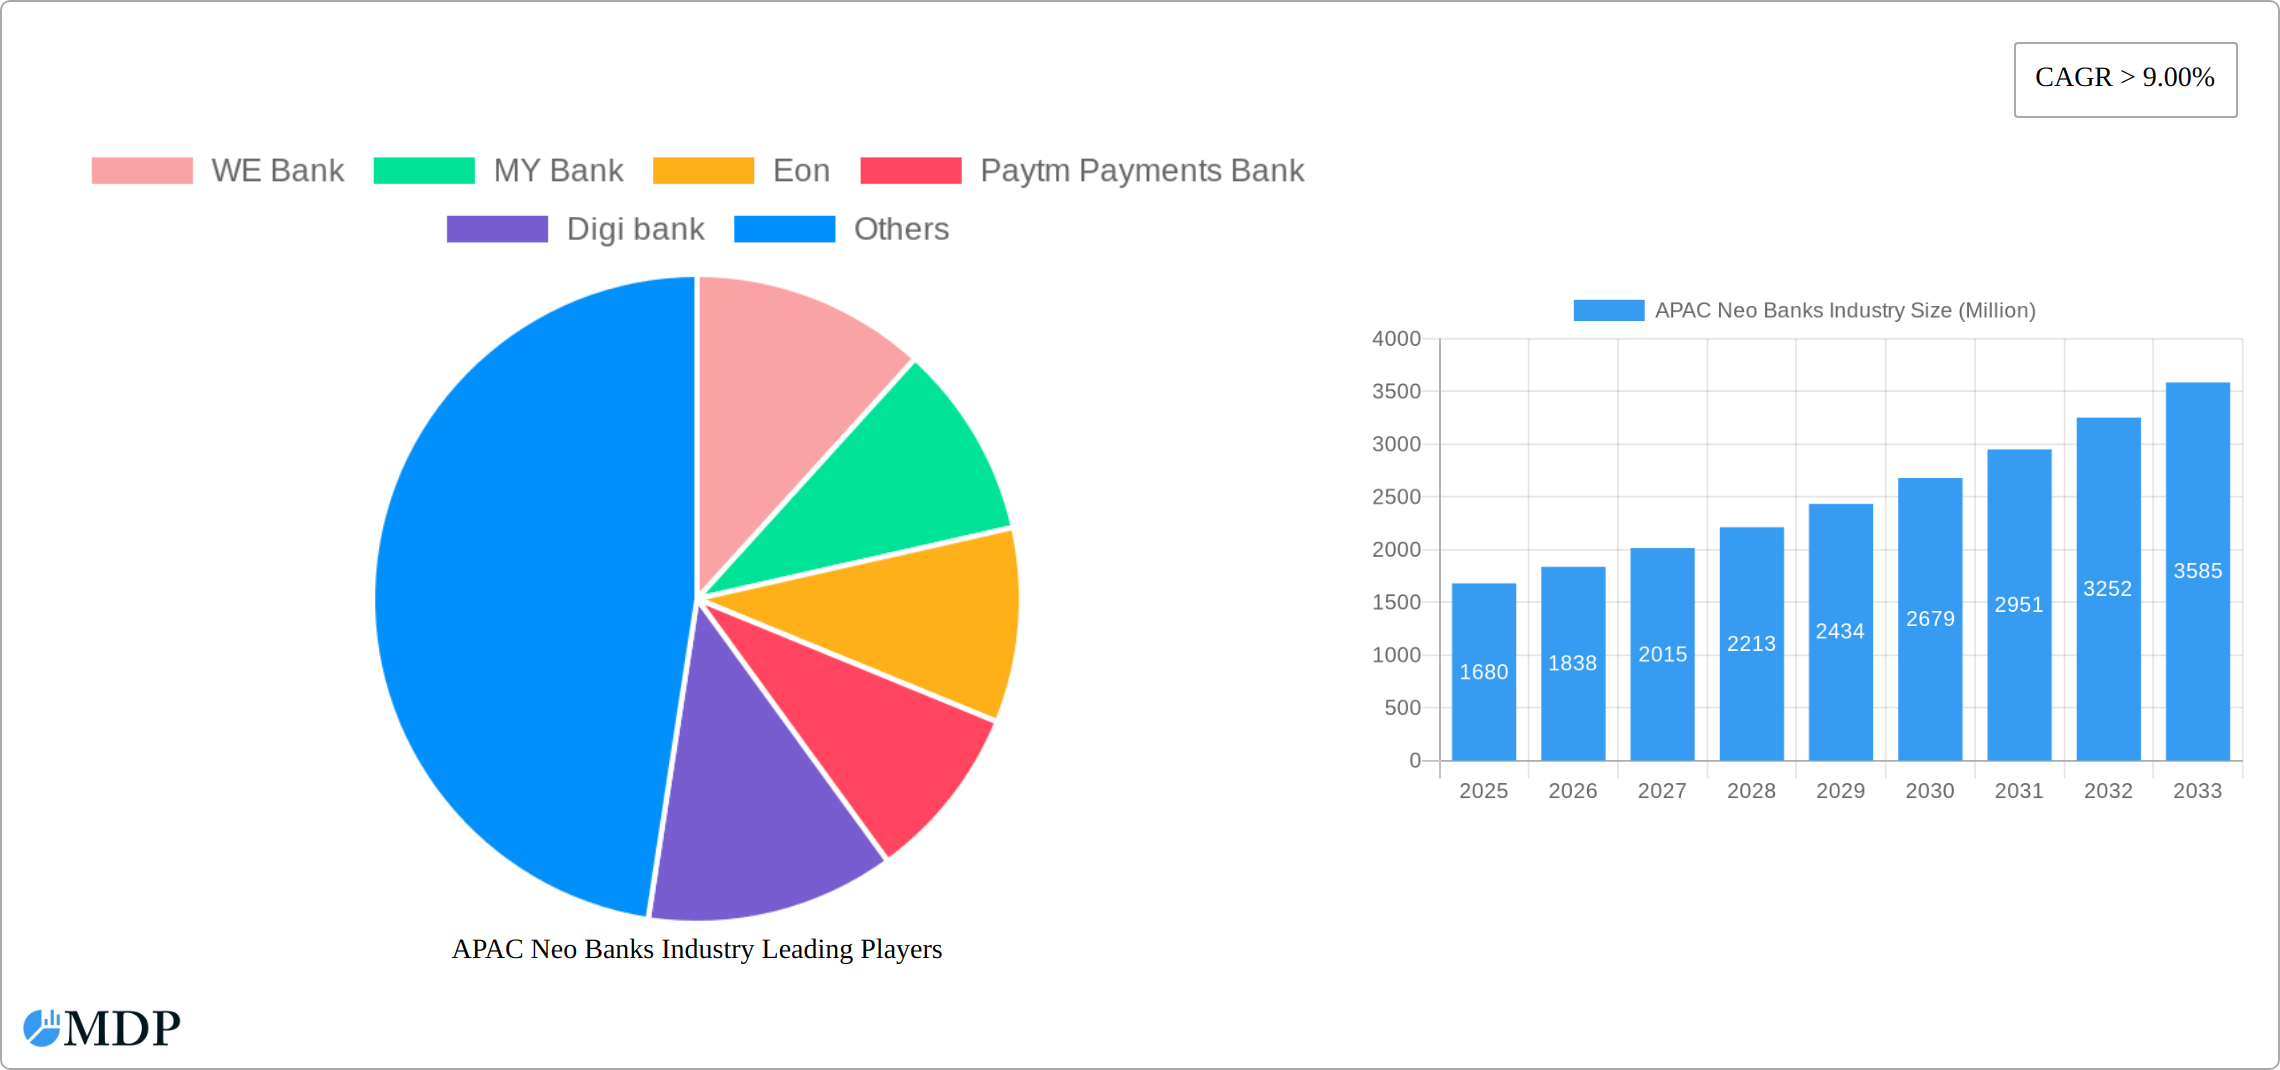
APAC Neo Banks Industry Market Size (In Billion)
However, challenges remain. The industry faces hurdles related to cybersecurity concerns and data privacy regulations. Maintaining customer trust in a digitally-driven environment is paramount. Furthermore, the need for substantial investment in technology and customer acquisition strategies presents an ongoing operational challenge. Successful neo-banks will need to effectively navigate regulatory landscapes, offer competitive pricing, and continually improve user experience to maintain a strong market position. Geographic expansion across varying levels of digital infrastructure within the APAC region also presents a strategic hurdle. The success of players will depend on their ability to adapt their offerings and strategies based on individual country's market dynamics and regulatory environment.
APAC Neo Banks Industry Company Market Share
APAC Neo Banks Industry Report: 2019-2033 Forecast
This comprehensive report provides an in-depth analysis of the APAC Neo Banks industry, offering invaluable insights for stakeholders seeking to navigate this dynamic and rapidly evolving market. With a study period spanning 2019-2033, a base year of 2025, and a forecast period of 2025-2033, this report delivers critical data and actionable strategies for success. The market size is estimated at xx Million in 2025 and projected to reach xx Million by 2033.
APAC Neo Banks Industry Market Dynamics & Concentration
The APAC Neo Banks industry is characterized by intense competition and rapid innovation. Market concentration is relatively fragmented, with no single player dominating. However, several key players, including WE Bank, MY Bank, and Paytm Payments Bank, hold significant market share. The market share of the top 5 players is estimated to reach approximately 40% by 2025. Several interwoven factors are driving these dynamic market forces:
- Innovation Drivers: Continuous advancements in fintech are fueling the development of novel product offerings, sophisticated payment systems, and highly engaging customer experiences.
- Regulatory Frameworks: The diverse and evolving regulatory landscapes across APAC nations significantly influence market entry strategies, operational frameworks, and compliance requirements, presenting both unique opportunities and considerable challenges for Neo Banks.
- Product Substitutes: Traditional banks and established financial service providers represent significant competitive substitutes. To counter this, Neo Banks are compelled to differentiate themselves through superior technological infrastructure and deeply customer-centric service models.
- End-User Trends: The accelerating trends of rising smartphone penetration, increasing digital literacy, and a burgeoning preference for seamless, intuitive digital banking experiences are collectively propelling the rapid adoption and growth of Neo Banks across the region.
- M&A Activities: The industry has experienced a substantial surge in mergers and acquisitions (M&A) in recent years, with an estimated [Insert number of deals, e.g., 50+] deals recorded during the historical period (2019-2024). This consolidation trend is projected to persist and intensify throughout the forecast period, driven by strategic objectives to expand market share, broaden product portfolios, and bolster technological capabilities.
APAC Neo Banks Industry Industry Trends & Analysis
The APAC Neo Banks industry exhibits robust growth, driven by several key factors. The Compound Annual Growth Rate (CAGR) is projected to be xx% during the forecast period (2025-2033). Market penetration is expected to increase significantly, driven by:
- Market Growth Drivers: Increasing financial inclusion, particularly in underserved populations, coupled with the aforementioned technological advancements and consumer preferences, are key catalysts for growth.
- Technological Disruptions: The adoption of AI, machine learning, blockchain technology, and open banking APIs is transforming the industry, fostering efficiency, personalization, and security.
- Consumer Preferences: Consumers increasingly favor convenience, personalization, and transparency in their banking services, leading to a shift towards Neo Banks.
- Competitive Dynamics: The highly competitive landscape fuels innovation and drives the development of new products and services, benefiting consumers through better offerings and lower fees.
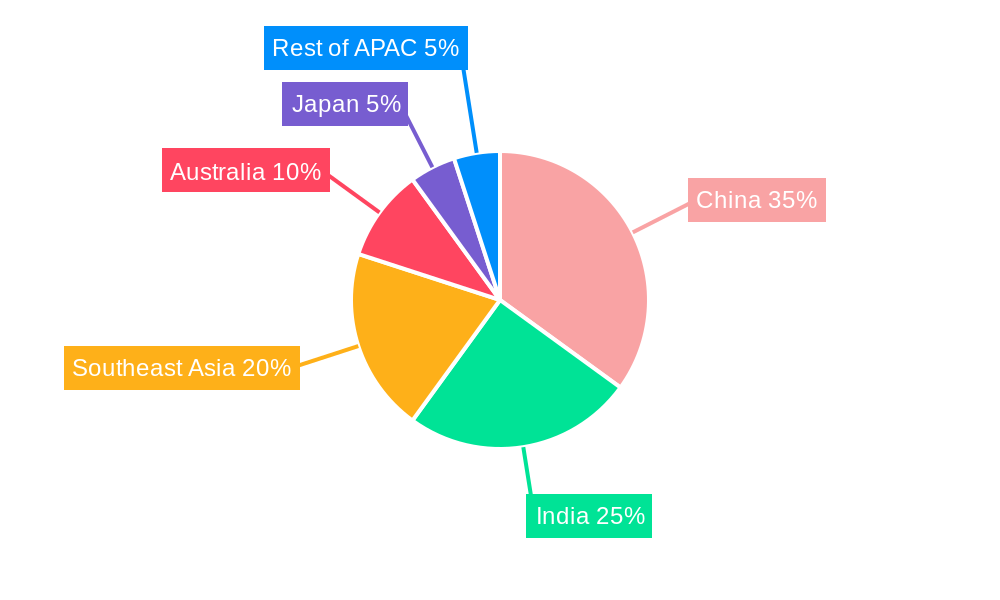
Leading Markets & Segments in APAC Neo Banks Industry
While the entire APAC region is experiencing growth, several markets stand out as leaders. China and India are currently the dominant markets, accounting for approximately xx% of the total market value in 2025. This dominance is attributable to several factors:
- Key Drivers (China & India):
- Large and growing populations: Providing a vast potential customer base.
- Rapid digitalization: High smartphone and internet penetration.
- Supportive government policies: Promoting fintech innovation and financial inclusion.
- Developed infrastructure: Supporting seamless digital transactions.
The dominance of these markets is likely to continue throughout the forecast period, although other countries such as Singapore and Indonesia are also experiencing significant growth.
APAC Neo Banks Industry Product Developments
Neo Banks are at the forefront of product innovation, consistently refining their offerings to meet the dynamic needs of customers and the escalating competitive pressures within the APAC market. This includes the strategic integration of advanced technologies such as AI-powered chatbots for enhanced customer service, the development of personalized financial management tools that offer deep insights, and the creation of seamless integration capabilities with a wide array of other financial services. A significant emerging trend is the design and deployment of highly specialized products meticulously crafted to serve specific demographic segments or address particular financial needs. Examples include tailored micro-loan solutions for small businesses and bespoke investment strategies for emerging professionals. This strategic focus on specialized solutions not only elevates customer engagement but also serves as a powerful differentiator in a crowded market.
Key Drivers of APAC Neo Banks Industry Growth
The rapid expansion of the APAC Neo Banks industry is underpinned by several pivotal growth catalysts:
- Technological Advancements: The widespread adoption and integration of cutting-edge technologies such as Artificial Intelligence (AI), Machine Learning (ML), and Blockchain are revolutionizing banking operations, leading to significant improvements in operational efficiency, enhanced security protocols, and more personalized customer interactions.
- Favorable Regulatory Environment: In many forward-thinking APAC countries, progressive regulatory frameworks are actively fostering an ecosystem conducive to fintech innovation and robust competition, thereby creating a fertile ground for Neo Banks to thrive.
- Rising Digital Literacy and Smartphone Penetration: The continuous increase in digital literacy rates and the ubiquitous availability of smartphones across the region are directly facilitating broader access to and wider adoption of digital banking services, significantly expanding the potential customer base for Neo Banks.
- Growing Demand for Financial Inclusion: Neo Banks are playing a crucial role in democratizing access to essential financial services, particularly for previously underserved and unbanked populations, thereby driving significant growth and positive social impact.
Challenges in the APAC Neo Banks Industry Market
Despite the promising trajectory, the APAC Neo Banks industry must navigate a landscape fraught with several significant challenges:
- Stringent Regulatory Compliance: Adhering to the complex and often divergent regulatory requirements across the multitude of APAC countries presents a substantial hurdle, demanding significant investment in compliance infrastructure and expertise, which can be both intricate and costly.
- Cybersecurity Threats: In an increasingly digital banking environment, the paramount importance of safeguarding sensitive customer data cannot be overstated. The ever-present threat of cyberattacks and data breaches poses a significant risk, with the potential to inflict substantial financial losses and irreparable reputational damage. The estimated cost of such breaches to the industry is projected to be [Insert estimated cost, e.g., $500 Million] annually by 2025.
- Competition from Established Banks: Traditional, incumbent banks are actively undergoing extensive digital transformation initiatives, investing heavily in upgrading their technology and services. This concerted effort poses a formidable and evolving competitive challenge to Neo Banks, requiring continuous innovation and agility.
Emerging Opportunities in APAC Neo Banks Industry
The APAC Neo Banks industry is replete with compelling long-term growth opportunities, promising substantial expansion and market penetration:
- Expansion into Underserved Markets: The vast potential to reach and serve previously unbanked or underbanked populations across the region represents a significant and largely untapped market opportunity, offering considerable scope for growth and impact.
- Strategic Partnerships: Forging strategic alliances and collaborations with other innovative fintech companies, as well as with established traditional financial institutions, can dramatically expand the reach, enhance service capabilities, and accelerate market penetration for Neo Banks.
- Development of Innovative Products: The creation and introduction of niche, highly specialized financial products meticulously tailored to address the unique needs and preferences of specific consumer segments can significantly bolster competitiveness, foster customer loyalty, and open up new revenue streams.
Leading Players in the APAC Neo Banks Industry Sector
- WE Bank
- MY Bank
- Eon
- Paytm Payments Bank
- Digi bank
- Jenius
- SBI Sumishin Net Bank
- Kakao Bank
- K Plus
- Timo
- Volt
- Xinja
- BigPay
- Neat
- List Not Exhaustive
Key Milestones in APAC Neo Banks Industry Industry
- October 2023: Paytm launched the industry’s first alternate ID-based guest checkout solution for merchants, enhancing security and convenience.
- July 2023: Paytm introduced two innovative 4G-enabled payment devices, the Paytm Pocket Soundbox and Paytm Music Soundbox, expanding payment options for merchants.
Strategic Outlook for APAC Neo Banks Industry Market
The APAC Neo Banks industry is poised for continued expansion, driven by technological innovation, evolving consumer preferences, and favorable regulatory developments in key markets. Strategic partnerships, expansion into underserved markets, and the development of innovative, customer-centric products will be crucial for success in this dynamic landscape. The future holds significant potential for growth, with the industry expected to witness substantial market expansion and increased consolidation in the coming years.
APAC Neo Banks Industry Segmentation
-
1. Service Type
- 1.1. Payments
- 1.2. Savings Products
- 1.3. Current Account
- 1.4. Consumer Credit
- 1.5. Loans
- 1.6. Others
-
2. End-User Type
- 2.1. Business Segment
- 2.2. Personal Segment
APAC Neo Banks Industry Segmentation By Geography
-
1. North America
- 1.1. United States
- 1.2. Canada
- 1.3. Mexico
-
2. South America
- 2.1. Brazil
- 2.2. Argentina
- 2.3. Rest of South America
-
3. Europe
- 3.1. United Kingdom
- 3.2. Germany
- 3.3. France
- 3.4. Italy
- 3.5. Spain
- 3.6. Russia
- 3.7. Benelux
- 3.8. Nordics
- 3.9. Rest of Europe
-
4. Middle East & Africa
- 4.1. Turkey
- 4.2. Israel
- 4.3. GCC
- 4.4. North Africa
- 4.5. South Africa
- 4.6. Rest of Middle East & Africa
-
5. Asia Pacific
- 5.1. China
- 5.2. India
- 5.3. Japan
- 5.4. South Korea
- 5.5. ASEAN
- 5.6. Oceania
- 5.7. Rest of Asia Pacific
APAC Neo Banks Industry Regional Market Share
Geographic Coverage of APAC Neo Banks Industry
APAC Neo Banks Industry REPORT HIGHLIGHTS
| Aspects | Details |
|---|---|
| Study Period | 2020-2034 |
| Base Year | 2025 |
| Estimated Year | 2026 |
| Forecast Period | 2026-2034 |
| Historical Period | 2020-2025 |
| Growth Rate | CAGR of > 9.00% from 2020-2034 |
| Segmentation |
|
Table of Contents
- 1. Introduction
- 1.1. Research Scope
- 1.2. Market Segmentation
- 1.3. Research Objective
- 1.4. Definitions and Assumptions
- 2. Executive Summary
- 2.1. Market Snapshot
- 3. Market Dynamics
- 3.1. Market Drivers
- 3.2. Market Restrains
- 3.3. Market Trends
- 3.4. Market Opportunities
- 4. Market Factor Analysis
- 4.1. Porters Five Forces
- 4.1.1. Bargaining Power of Suppliers
- 4.1.2. Bargaining Power of Buyers
- 4.1.3. Threat of New Entrants
- 4.1.4. Threat of Substitutes
- 4.1.5. Competitive Rivalry
- 4.2. PESTEL analysis
- 4.3. BCG Analysis
- 4.3.1. Stars (High Growth, High Market Share)
- 4.3.2. Cash Cows (Low Growth, High Market Share)
- 4.3.3. Question Mark (High Growth, Low Market Share)
- 4.3.4. Dogs (Low Growth, Low Market Share)
- 4.4. Ansoff Matrix Analysis
- 4.5. Supply Chain Analysis
- 4.6. Regulatory Landscape
- 4.7. Current Market Potential and Opportunity Assessment (TAM–SAM–SOM Framework)
- 4.8. MDP Analyst Note
- 4.1. Porters Five Forces
- 5. Market Analysis, Insights and Forecast 2021-2033
- 5.1. Market Analysis, Insights and Forecast - by Service Type
- 5.1.1. Payments
- 5.1.2. Savings Products
- 5.1.3. Current Account
- 5.1.4. Consumer Credit
- 5.1.5. Loans
- 5.1.6. Others
- 5.2. Market Analysis, Insights and Forecast - by End-User Type
- 5.2.1. Business Segment
- 5.2.2. Personal Segment
- 5.3. Market Analysis, Insights and Forecast - by Region
- 5.3.1. North America
- 5.3.2. South America
- 5.3.3. Europe
- 5.3.4. Middle East & Africa
- 5.3.5. Asia Pacific
- 5.1. Market Analysis, Insights and Forecast - by Service Type
- 6. Global APAC Neo Banks Industry Analysis, Insights and Forecast, 2021-2033
- 6.1. Market Analysis, Insights and Forecast - by Service Type
- 6.1.1. Payments
- 6.1.2. Savings Products
- 6.1.3. Current Account
- 6.1.4. Consumer Credit
- 6.1.5. Loans
- 6.1.6. Others
- 6.2. Market Analysis, Insights and Forecast - by End-User Type
- 6.2.1. Business Segment
- 6.2.2. Personal Segment
- 6.1. Market Analysis, Insights and Forecast - by Service Type
- 7. North America APAC Neo Banks Industry Analysis, Insights and Forecast, 2020-2032
- 7.1. Market Analysis, Insights and Forecast - by Service Type
- 7.1.1. Payments
- 7.1.2. Savings Products
- 7.1.3. Current Account
- 7.1.4. Consumer Credit
- 7.1.5. Loans
- 7.1.6. Others
- 7.2. Market Analysis, Insights and Forecast - by End-User Type
- 7.2.1. Business Segment
- 7.2.2. Personal Segment
- 7.1. Market Analysis, Insights and Forecast - by Service Type
- 8. South America APAC Neo Banks Industry Analysis, Insights and Forecast, 2020-2032
- 8.1. Market Analysis, Insights and Forecast - by Service Type
- 8.1.1. Payments
- 8.1.2. Savings Products
- 8.1.3. Current Account
- 8.1.4. Consumer Credit
- 8.1.5. Loans
- 8.1.6. Others
- 8.2. Market Analysis, Insights and Forecast - by End-User Type
- 8.2.1. Business Segment
- 8.2.2. Personal Segment
- 8.1. Market Analysis, Insights and Forecast - by Service Type
- 9. Europe APAC Neo Banks Industry Analysis, Insights and Forecast, 2020-2032
- 9.1. Market Analysis, Insights and Forecast - by Service Type
- 9.1.1. Payments
- 9.1.2. Savings Products
- 9.1.3. Current Account
- 9.1.4. Consumer Credit
- 9.1.5. Loans
- 9.1.6. Others
- 9.2. Market Analysis, Insights and Forecast - by End-User Type
- 9.2.1. Business Segment
- 9.2.2. Personal Segment
- 9.1. Market Analysis, Insights and Forecast - by Service Type
- 10. Middle East & Africa APAC Neo Banks Industry Analysis, Insights and Forecast, 2020-2032
- 10.1. Market Analysis, Insights and Forecast - by Service Type
- 10.1.1. Payments
- 10.1.2. Savings Products
- 10.1.3. Current Account
- 10.1.4. Consumer Credit
- 10.1.5. Loans
- 10.1.6. Others
- 10.2. Market Analysis, Insights and Forecast - by End-User Type
- 10.2.1. Business Segment
- 10.2.2. Personal Segment
- 10.1. Market Analysis, Insights and Forecast - by Service Type
- 11. Asia Pacific APAC Neo Banks Industry Analysis, Insights and Forecast, 2020-2032
- 11.1. Market Analysis, Insights and Forecast - by Service Type
- 11.1.1. Payments
- 11.1.2. Savings Products
- 11.1.3. Current Account
- 11.1.4. Consumer Credit
- 11.1.5. Loans
- 11.1.6. Others
- 11.2. Market Analysis, Insights and Forecast - by End-User Type
- 11.2.1. Business Segment
- 11.2.2. Personal Segment
- 11.1. Market Analysis, Insights and Forecast - by Service Type
- 12. Competitive Analysis
- 12.1. Company Profiles
- 12.1.1 WE Bank
- 12.1.1.1. Company Overview
- 12.1.1.2. Products
- 12.1.1.3. Company Financials
- 12.1.1.4. SWOT Analysis
- 12.1.2 MY Bank
- 12.1.2.1. Company Overview
- 12.1.2.2. Products
- 12.1.2.3. Company Financials
- 12.1.2.4. SWOT Analysis
- 12.1.3 Eon
- 12.1.3.1. Company Overview
- 12.1.3.2. Products
- 12.1.3.3. Company Financials
- 12.1.3.4. SWOT Analysis
- 12.1.4 Paytm Payments Bank
- 12.1.4.1. Company Overview
- 12.1.4.2. Products
- 12.1.4.3. Company Financials
- 12.1.4.4. SWOT Analysis
- 12.1.5 Digi bank
- 12.1.5.1. Company Overview
- 12.1.5.2. Products
- 12.1.5.3. Company Financials
- 12.1.5.4. SWOT Analysis
- 12.1.6 Jenius
- 12.1.6.1. Company Overview
- 12.1.6.2. Products
- 12.1.6.3. Company Financials
- 12.1.6.4. SWOT Analysis
- 12.1.7 SBI Sumishin Net Bank
- 12.1.7.1. Company Overview
- 12.1.7.2. Products
- 12.1.7.3. Company Financials
- 12.1.7.4. SWOT Analysis
- 12.1.8 Kakao Bank
- 12.1.8.1. Company Overview
- 12.1.8.2. Products
- 12.1.8.3. Company Financials
- 12.1.8.4. SWOT Analysis
- 12.1.9 K Plus
- 12.1.9.1. Company Overview
- 12.1.9.2. Products
- 12.1.9.3. Company Financials
- 12.1.9.4. SWOT Analysis
- 12.1.10 Timo
- 12.1.10.1. Company Overview
- 12.1.10.2. Products
- 12.1.10.3. Company Financials
- 12.1.10.4. SWOT Analysis
- 12.1.11 Volt
- 12.1.11.1. Company Overview
- 12.1.11.2. Products
- 12.1.11.3. Company Financials
- 12.1.11.4. SWOT Analysis
- 12.1.12 Xinja
- 12.1.12.1. Company Overview
- 12.1.12.2. Products
- 12.1.12.3. Company Financials
- 12.1.12.4. SWOT Analysis
- 12.1.13 BigPay
- 12.1.13.1. Company Overview
- 12.1.13.2. Products
- 12.1.13.3. Company Financials
- 12.1.13.4. SWOT Analysis
- 12.1.14 Neat**List Not Exhaustive
- 12.1.14.1. Company Overview
- 12.1.14.2. Products
- 12.1.14.3. Company Financials
- 12.1.14.4. SWOT Analysis
- 12.1.1 WE Bank
- 12.2. Market Entropy
- 12.2.1 Company's Key Areas Served
- 12.2.2 Recent Developments
- 12.3. Company Market Share Analysis 2025
- 12.3.1 Top 5 Companies Market Share Analysis
- 12.3.2 Top 3 Companies Market Share Analysis
- 12.4. List of Potential Customers
- 13. Research Methodology
List of Figures
- Figure 1: Global APAC Neo Banks Industry Revenue Breakdown (Million, %) by Region 2025 & 2033
- Figure 2: Global APAC Neo Banks Industry Volume Breakdown (Billion, %) by Region 2025 & 2033
- Figure 3: North America APAC Neo Banks Industry Revenue (Million), by Service Type 2025 & 2033
- Figure 4: North America APAC Neo Banks Industry Volume (Billion), by Service Type 2025 & 2033
- Figure 5: North America APAC Neo Banks Industry Revenue Share (%), by Service Type 2025 & 2033
- Figure 6: North America APAC Neo Banks Industry Volume Share (%), by Service Type 2025 & 2033
- Figure 7: North America APAC Neo Banks Industry Revenue (Million), by End-User Type 2025 & 2033
- Figure 8: North America APAC Neo Banks Industry Volume (Billion), by End-User Type 2025 & 2033
- Figure 9: North America APAC Neo Banks Industry Revenue Share (%), by End-User Type 2025 & 2033
- Figure 10: North America APAC Neo Banks Industry Volume Share (%), by End-User Type 2025 & 2033
- Figure 11: North America APAC Neo Banks Industry Revenue (Million), by Country 2025 & 2033
- Figure 12: North America APAC Neo Banks Industry Volume (Billion), by Country 2025 & 2033
- Figure 13: North America APAC Neo Banks Industry Revenue Share (%), by Country 2025 & 2033
- Figure 14: North America APAC Neo Banks Industry Volume Share (%), by Country 2025 & 2033
- Figure 15: South America APAC Neo Banks Industry Revenue (Million), by Service Type 2025 & 2033
- Figure 16: South America APAC Neo Banks Industry Volume (Billion), by Service Type 2025 & 2033
- Figure 17: South America APAC Neo Banks Industry Revenue Share (%), by Service Type 2025 & 2033
- Figure 18: South America APAC Neo Banks Industry Volume Share (%), by Service Type 2025 & 2033
- Figure 19: South America APAC Neo Banks Industry Revenue (Million), by End-User Type 2025 & 2033
- Figure 20: South America APAC Neo Banks Industry Volume (Billion), by End-User Type 2025 & 2033
- Figure 21: South America APAC Neo Banks Industry Revenue Share (%), by End-User Type 2025 & 2033
- Figure 22: South America APAC Neo Banks Industry Volume Share (%), by End-User Type 2025 & 2033
- Figure 23: South America APAC Neo Banks Industry Revenue (Million), by Country 2025 & 2033
- Figure 24: South America APAC Neo Banks Industry Volume (Billion), by Country 2025 & 2033
- Figure 25: South America APAC Neo Banks Industry Revenue Share (%), by Country 2025 & 2033
- Figure 26: South America APAC Neo Banks Industry Volume Share (%), by Country 2025 & 2033
- Figure 27: Europe APAC Neo Banks Industry Revenue (Million), by Service Type 2025 & 2033
- Figure 28: Europe APAC Neo Banks Industry Volume (Billion), by Service Type 2025 & 2033
- Figure 29: Europe APAC Neo Banks Industry Revenue Share (%), by Service Type 2025 & 2033
- Figure 30: Europe APAC Neo Banks Industry Volume Share (%), by Service Type 2025 & 2033
- Figure 31: Europe APAC Neo Banks Industry Revenue (Million), by End-User Type 2025 & 2033
- Figure 32: Europe APAC Neo Banks Industry Volume (Billion), by End-User Type 2025 & 2033
- Figure 33: Europe APAC Neo Banks Industry Revenue Share (%), by End-User Type 2025 & 2033
- Figure 34: Europe APAC Neo Banks Industry Volume Share (%), by End-User Type 2025 & 2033
- Figure 35: Europe APAC Neo Banks Industry Revenue (Million), by Country 2025 & 2033
- Figure 36: Europe APAC Neo Banks Industry Volume (Billion), by Country 2025 & 2033
- Figure 37: Europe APAC Neo Banks Industry Revenue Share (%), by Country 2025 & 2033
- Figure 38: Europe APAC Neo Banks Industry Volume Share (%), by Country 2025 & 2033
- Figure 39: Middle East & Africa APAC Neo Banks Industry Revenue (Million), by Service Type 2025 & 2033
- Figure 40: Middle East & Africa APAC Neo Banks Industry Volume (Billion), by Service Type 2025 & 2033
- Figure 41: Middle East & Africa APAC Neo Banks Industry Revenue Share (%), by Service Type 2025 & 2033
- Figure 42: Middle East & Africa APAC Neo Banks Industry Volume Share (%), by Service Type 2025 & 2033
- Figure 43: Middle East & Africa APAC Neo Banks Industry Revenue (Million), by End-User Type 2025 & 2033
- Figure 44: Middle East & Africa APAC Neo Banks Industry Volume (Billion), by End-User Type 2025 & 2033
- Figure 45: Middle East & Africa APAC Neo Banks Industry Revenue Share (%), by End-User Type 2025 & 2033
- Figure 46: Middle East & Africa APAC Neo Banks Industry Volume Share (%), by End-User Type 2025 & 2033
- Figure 47: Middle East & Africa APAC Neo Banks Industry Revenue (Million), by Country 2025 & 2033
- Figure 48: Middle East & Africa APAC Neo Banks Industry Volume (Billion), by Country 2025 & 2033
- Figure 49: Middle East & Africa APAC Neo Banks Industry Revenue Share (%), by Country 2025 & 2033
- Figure 50: Middle East & Africa APAC Neo Banks Industry Volume Share (%), by Country 2025 & 2033
- Figure 51: Asia Pacific APAC Neo Banks Industry Revenue (Million), by Service Type 2025 & 2033
- Figure 52: Asia Pacific APAC Neo Banks Industry Volume (Billion), by Service Type 2025 & 2033
- Figure 53: Asia Pacific APAC Neo Banks Industry Revenue Share (%), by Service Type 2025 & 2033
- Figure 54: Asia Pacific APAC Neo Banks Industry Volume Share (%), by Service Type 2025 & 2033
- Figure 55: Asia Pacific APAC Neo Banks Industry Revenue (Million), by End-User Type 2025 & 2033
- Figure 56: Asia Pacific APAC Neo Banks Industry Volume (Billion), by End-User Type 2025 & 2033
- Figure 57: Asia Pacific APAC Neo Banks Industry Revenue Share (%), by End-User Type 2025 & 2033
- Figure 58: Asia Pacific APAC Neo Banks Industry Volume Share (%), by End-User Type 2025 & 2033
- Figure 59: Asia Pacific APAC Neo Banks Industry Revenue (Million), by Country 2025 & 2033
- Figure 60: Asia Pacific APAC Neo Banks Industry Volume (Billion), by Country 2025 & 2033
- Figure 61: Asia Pacific APAC Neo Banks Industry Revenue Share (%), by Country 2025 & 2033
- Figure 62: Asia Pacific APAC Neo Banks Industry Volume Share (%), by Country 2025 & 2033
List of Tables
- Table 1: Global APAC Neo Banks Industry Revenue Million Forecast, by Service Type 2020 & 2033
- Table 2: Global APAC Neo Banks Industry Volume Billion Forecast, by Service Type 2020 & 2033
- Table 3: Global APAC Neo Banks Industry Revenue Million Forecast, by End-User Type 2020 & 2033
- Table 4: Global APAC Neo Banks Industry Volume Billion Forecast, by End-User Type 2020 & 2033
- Table 5: Global APAC Neo Banks Industry Revenue Million Forecast, by Region 2020 & 2033
- Table 6: Global APAC Neo Banks Industry Volume Billion Forecast, by Region 2020 & 2033
- Table 7: Global APAC Neo Banks Industry Revenue Million Forecast, by Service Type 2020 & 2033
- Table 8: Global APAC Neo Banks Industry Volume Billion Forecast, by Service Type 2020 & 2033
- Table 9: Global APAC Neo Banks Industry Revenue Million Forecast, by End-User Type 2020 & 2033
- Table 10: Global APAC Neo Banks Industry Volume Billion Forecast, by End-User Type 2020 & 2033
- Table 11: Global APAC Neo Banks Industry Revenue Million Forecast, by Country 2020 & 2033
- Table 12: Global APAC Neo Banks Industry Volume Billion Forecast, by Country 2020 & 2033
- Table 13: United States APAC Neo Banks Industry Revenue (Million) Forecast, by Application 2020 & 2033
- Table 14: United States APAC Neo Banks Industry Volume (Billion) Forecast, by Application 2020 & 2033
- Table 15: Canada APAC Neo Banks Industry Revenue (Million) Forecast, by Application 2020 & 2033
- Table 16: Canada APAC Neo Banks Industry Volume (Billion) Forecast, by Application 2020 & 2033
- Table 17: Mexico APAC Neo Banks Industry Revenue (Million) Forecast, by Application 2020 & 2033
- Table 18: Mexico APAC Neo Banks Industry Volume (Billion) Forecast, by Application 2020 & 2033
- Table 19: Global APAC Neo Banks Industry Revenue Million Forecast, by Service Type 2020 & 2033
- Table 20: Global APAC Neo Banks Industry Volume Billion Forecast, by Service Type 2020 & 2033
- Table 21: Global APAC Neo Banks Industry Revenue Million Forecast, by End-User Type 2020 & 2033
- Table 22: Global APAC Neo Banks Industry Volume Billion Forecast, by End-User Type 2020 & 2033
- Table 23: Global APAC Neo Banks Industry Revenue Million Forecast, by Country 2020 & 2033
- Table 24: Global APAC Neo Banks Industry Volume Billion Forecast, by Country 2020 & 2033
- Table 25: Brazil APAC Neo Banks Industry Revenue (Million) Forecast, by Application 2020 & 2033
- Table 26: Brazil APAC Neo Banks Industry Volume (Billion) Forecast, by Application 2020 & 2033
- Table 27: Argentina APAC Neo Banks Industry Revenue (Million) Forecast, by Application 2020 & 2033
- Table 28: Argentina APAC Neo Banks Industry Volume (Billion) Forecast, by Application 2020 & 2033
- Table 29: Rest of South America APAC Neo Banks Industry Revenue (Million) Forecast, by Application 2020 & 2033
- Table 30: Rest of South America APAC Neo Banks Industry Volume (Billion) Forecast, by Application 2020 & 2033
- Table 31: Global APAC Neo Banks Industry Revenue Million Forecast, by Service Type 2020 & 2033
- Table 32: Global APAC Neo Banks Industry Volume Billion Forecast, by Service Type 2020 & 2033
- Table 33: Global APAC Neo Banks Industry Revenue Million Forecast, by End-User Type 2020 & 2033
- Table 34: Global APAC Neo Banks Industry Volume Billion Forecast, by End-User Type 2020 & 2033
- Table 35: Global APAC Neo Banks Industry Revenue Million Forecast, by Country 2020 & 2033
- Table 36: Global APAC Neo Banks Industry Volume Billion Forecast, by Country 2020 & 2033
- Table 37: United Kingdom APAC Neo Banks Industry Revenue (Million) Forecast, by Application 2020 & 2033
- Table 38: United Kingdom APAC Neo Banks Industry Volume (Billion) Forecast, by Application 2020 & 2033
- Table 39: Germany APAC Neo Banks Industry Revenue (Million) Forecast, by Application 2020 & 2033
- Table 40: Germany APAC Neo Banks Industry Volume (Billion) Forecast, by Application 2020 & 2033
- Table 41: France APAC Neo Banks Industry Revenue (Million) Forecast, by Application 2020 & 2033
- Table 42: France APAC Neo Banks Industry Volume (Billion) Forecast, by Application 2020 & 2033
- Table 43: Italy APAC Neo Banks Industry Revenue (Million) Forecast, by Application 2020 & 2033
- Table 44: Italy APAC Neo Banks Industry Volume (Billion) Forecast, by Application 2020 & 2033
- Table 45: Spain APAC Neo Banks Industry Revenue (Million) Forecast, by Application 2020 & 2033
- Table 46: Spain APAC Neo Banks Industry Volume (Billion) Forecast, by Application 2020 & 2033
- Table 47: Russia APAC Neo Banks Industry Revenue (Million) Forecast, by Application 2020 & 2033
- Table 48: Russia APAC Neo Banks Industry Volume (Billion) Forecast, by Application 2020 & 2033
- Table 49: Benelux APAC Neo Banks Industry Revenue (Million) Forecast, by Application 2020 & 2033
- Table 50: Benelux APAC Neo Banks Industry Volume (Billion) Forecast, by Application 2020 & 2033
- Table 51: Nordics APAC Neo Banks Industry Revenue (Million) Forecast, by Application 2020 & 2033
- Table 52: Nordics APAC Neo Banks Industry Volume (Billion) Forecast, by Application 2020 & 2033
- Table 53: Rest of Europe APAC Neo Banks Industry Revenue (Million) Forecast, by Application 2020 & 2033
- Table 54: Rest of Europe APAC Neo Banks Industry Volume (Billion) Forecast, by Application 2020 & 2033
- Table 55: Global APAC Neo Banks Industry Revenue Million Forecast, by Service Type 2020 & 2033
- Table 56: Global APAC Neo Banks Industry Volume Billion Forecast, by Service Type 2020 & 2033
- Table 57: Global APAC Neo Banks Industry Revenue Million Forecast, by End-User Type 2020 & 2033
- Table 58: Global APAC Neo Banks Industry Volume Billion Forecast, by End-User Type 2020 & 2033
- Table 59: Global APAC Neo Banks Industry Revenue Million Forecast, by Country 2020 & 2033
- Table 60: Global APAC Neo Banks Industry Volume Billion Forecast, by Country 2020 & 2033
- Table 61: Turkey APAC Neo Banks Industry Revenue (Million) Forecast, by Application 2020 & 2033
- Table 62: Turkey APAC Neo Banks Industry Volume (Billion) Forecast, by Application 2020 & 2033
- Table 63: Israel APAC Neo Banks Industry Revenue (Million) Forecast, by Application 2020 & 2033
- Table 64: Israel APAC Neo Banks Industry Volume (Billion) Forecast, by Application 2020 & 2033
- Table 65: GCC APAC Neo Banks Industry Revenue (Million) Forecast, by Application 2020 & 2033
- Table 66: GCC APAC Neo Banks Industry Volume (Billion) Forecast, by Application 2020 & 2033
- Table 67: North Africa APAC Neo Banks Industry Revenue (Million) Forecast, by Application 2020 & 2033
- Table 68: North Africa APAC Neo Banks Industry Volume (Billion) Forecast, by Application 2020 & 2033
- Table 69: South Africa APAC Neo Banks Industry Revenue (Million) Forecast, by Application 2020 & 2033
- Table 70: South Africa APAC Neo Banks Industry Volume (Billion) Forecast, by Application 2020 & 2033
- Table 71: Rest of Middle East & Africa APAC Neo Banks Industry Revenue (Million) Forecast, by Application 2020 & 2033
- Table 72: Rest of Middle East & Africa APAC Neo Banks Industry Volume (Billion) Forecast, by Application 2020 & 2033
- Table 73: Global APAC Neo Banks Industry Revenue Million Forecast, by Service Type 2020 & 2033
- Table 74: Global APAC Neo Banks Industry Volume Billion Forecast, by Service Type 2020 & 2033
- Table 75: Global APAC Neo Banks Industry Revenue Million Forecast, by End-User Type 2020 & 2033
- Table 76: Global APAC Neo Banks Industry Volume Billion Forecast, by End-User Type 2020 & 2033
- Table 77: Global APAC Neo Banks Industry Revenue Million Forecast, by Country 2020 & 2033
- Table 78: Global APAC Neo Banks Industry Volume Billion Forecast, by Country 2020 & 2033
- Table 79: China APAC Neo Banks Industry Revenue (Million) Forecast, by Application 2020 & 2033
- Table 80: China APAC Neo Banks Industry Volume (Billion) Forecast, by Application 2020 & 2033
- Table 81: India APAC Neo Banks Industry Revenue (Million) Forecast, by Application 2020 & 2033
- Table 82: India APAC Neo Banks Industry Volume (Billion) Forecast, by Application 2020 & 2033
- Table 83: Japan APAC Neo Banks Industry Revenue (Million) Forecast, by Application 2020 & 2033
- Table 84: Japan APAC Neo Banks Industry Volume (Billion) Forecast, by Application 2020 & 2033
- Table 85: South Korea APAC Neo Banks Industry Revenue (Million) Forecast, by Application 2020 & 2033
- Table 86: South Korea APAC Neo Banks Industry Volume (Billion) Forecast, by Application 2020 & 2033
- Table 87: ASEAN APAC Neo Banks Industry Revenue (Million) Forecast, by Application 2020 & 2033
- Table 88: ASEAN APAC Neo Banks Industry Volume (Billion) Forecast, by Application 2020 & 2033
- Table 89: Oceania APAC Neo Banks Industry Revenue (Million) Forecast, by Application 2020 & 2033
- Table 90: Oceania APAC Neo Banks Industry Volume (Billion) Forecast, by Application 2020 & 2033
- Table 91: Rest of Asia Pacific APAC Neo Banks Industry Revenue (Million) Forecast, by Application 2020 & 2033
- Table 92: Rest of Asia Pacific APAC Neo Banks Industry Volume (Billion) Forecast, by Application 2020 & 2033
Frequently Asked Questions
1. What is the projected Compound Annual Growth Rate (CAGR) of the APAC Neo Banks Industry?
The projected CAGR is approximately > 9.00%.
2. Which companies are prominent players in the APAC Neo Banks Industry?
Key companies in the market include WE Bank, MY Bank, Eon, Paytm Payments Bank, Digi bank, Jenius, SBI Sumishin Net Bank, Kakao Bank, K Plus, Timo, Volt, Xinja, BigPay, Neat**List Not Exhaustive.
3. What are the main segments of the APAC Neo Banks Industry?
The market segments include Service Type, End-User Type.
4. Can you provide details about the market size?
The market size is estimated to be USD 1.68 Million as of 2022.
5. What are some drivers contributing to market growth?
Increase in Internet Penetration is Driving the Market.
6. What are the notable trends driving market growth?
Raise in Mobile Penetration and High Unbanked Adults in the Region.
7. Are there any restraints impacting market growth?
Increase in Internet Penetration is Driving the Market.
8. Can you provide examples of recent developments in the market?
In October 2023, Paytm launched the industry’s first alternate ID-based guest checkout solution for merchants. Tokenisation masks the 16-digit debit or credit card number with a unique token that is specific to one’s card to prevent misuse and theft from merchant websites.
9. What pricing options are available for accessing the report?
Pricing options include single-user, multi-user, and enterprise licenses priced at USD 4750, USD 5250, and USD 8750 respectively.
10. Is the market size provided in terms of value or volume?
The market size is provided in terms of value, measured in Million and volume, measured in Billion.
11. Are there any specific market keywords associated with the report?
Yes, the market keyword associated with the report is "APAC Neo Banks Industry," which aids in identifying and referencing the specific market segment covered.
12. How do I determine which pricing option suits my needs best?
The pricing options vary based on user requirements and access needs. Individual users may opt for single-user licenses, while businesses requiring broader access may choose multi-user or enterprise licenses for cost-effective access to the report.
13. Are there any additional resources or data provided in the APAC Neo Banks Industry report?
While the report offers comprehensive insights, it's advisable to review the specific contents or supplementary materials provided to ascertain if additional resources or data are available.
14. How can I stay updated on further developments or reports in the APAC Neo Banks Industry?
To stay informed about further developments, trends, and reports in the APAC Neo Banks Industry, consider subscribing to industry newsletters, following relevant companies and organizations, or regularly checking reputable industry news sources and publications.
Methodology
Step 1 - Identification of Relevant Samples Size from Population Database


Step 2 - Approaches for Defining Global Market Size (Value, Volume* & Price*)

Note*: In applicable scenarios
Step 3 - Data Sources
Primary Research
- Web Analytics
- Survey Reports
- Research Institute
- Latest Research Reports
- Opinion Leaders
Secondary Research
- Annual Reports
- White Paper
- Latest Press Release
- Industry Association
- Paid Database
- Investor Presentations

Step 4 - Data Triangulation
Involves using different sources of information in order to increase the validity of a study
These sources are likely to be stakeholders in a program - participants, other researchers, program staff, other community members, and so on.
Then we put all data in single framework & apply various statistical tools to find out the dynamic on the market.
During the analysis stage, feedback from the stakeholder groups would be compared to determine areas of agreement as well as areas of divergence