

Key Insights
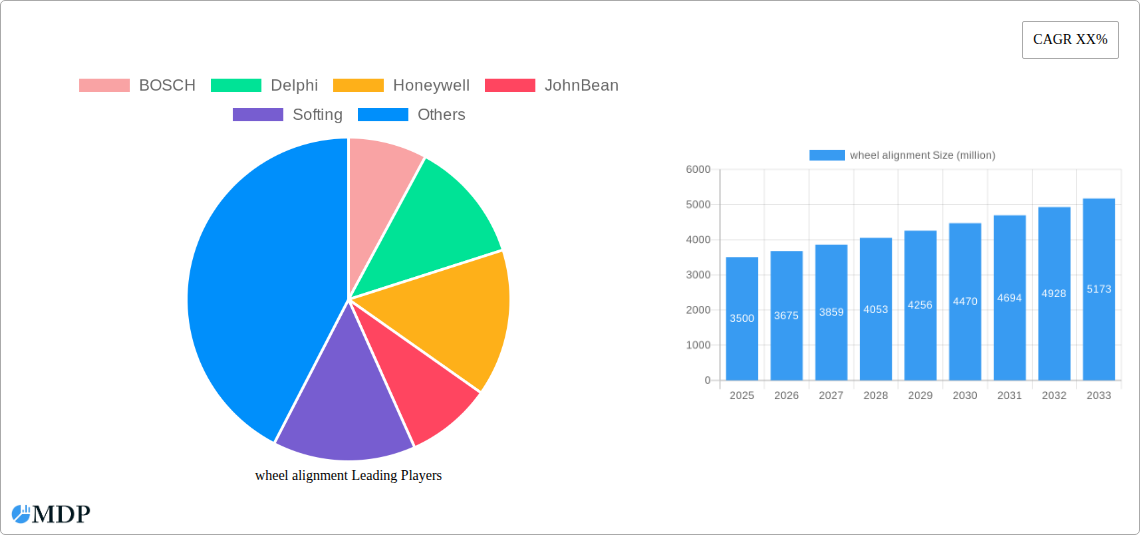
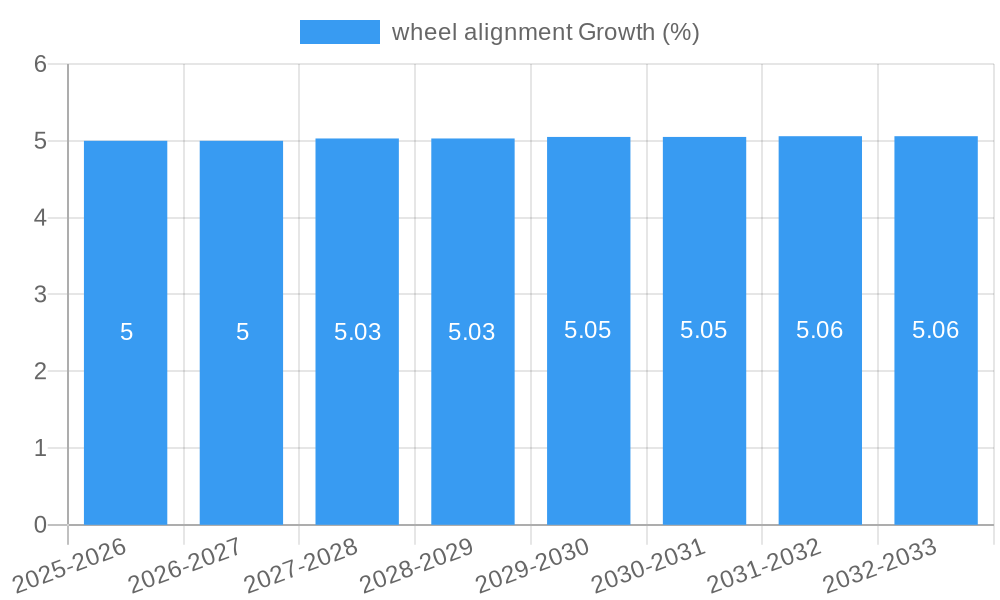
The global wheel alignment market is poised for significant expansion, projected to reach a substantial market size of approximately $3.5 billion by 2025, and is expected to grow at a robust Compound Annual Growth Rate (CAGR) of around 5.5% through 2033. This growth is primarily fueled by the increasing global vehicle parc, encompassing a burgeoning number of passenger cars, commercial trucks, buses, and tractors. As vehicles become more sophisticated with advanced suspension systems and tire technologies, the demand for precise wheel alignment services intensifies. Furthermore, the growing awareness among vehicle owners and fleet managers regarding the benefits of proper wheel alignment – including enhanced tire longevity, improved fuel efficiency, and optimal vehicle handling and safety – is a critical driver for market expansion. The increasing adoption of advanced driver-assistance systems (ADAS) also necessitates accurate wheel alignment, as these systems rely on precise sensor calibration, which is directly impacted by wheel positioning.
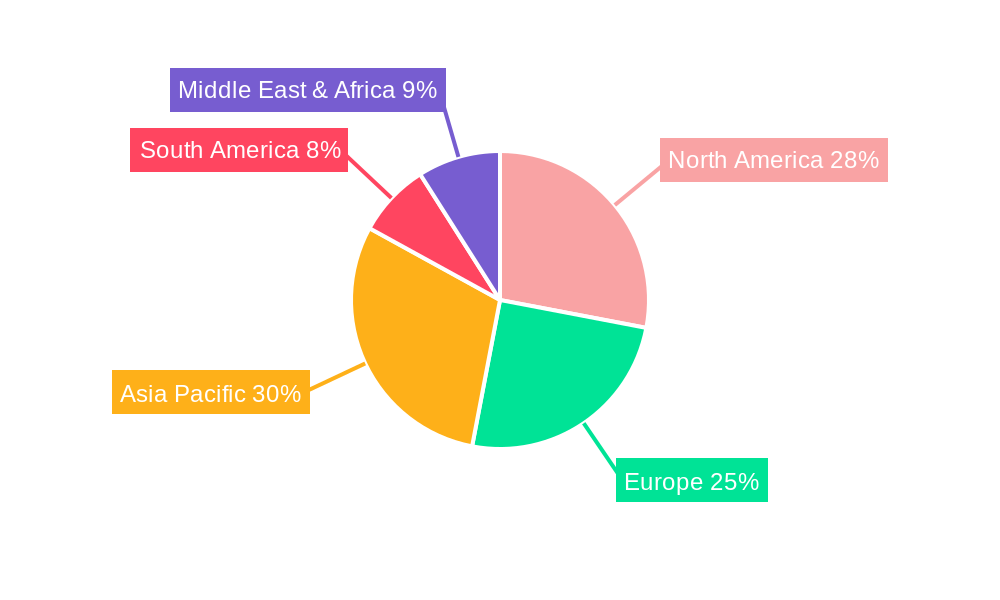
The market is segmented into two primary types: Two-Wheel Alignment and Four-Wheel Alignment, with the latter dominating due to its application across a wider range of vehicles and its comprehensive correction capabilities. Applications span across Trucks, Buses, Tractor Trailers, Cars, and Others, with the passenger car segment exhibiting the highest demand due to sheer volume. Key restraints that may temper growth include the high initial cost of sophisticated alignment equipment, particularly for smaller workshops, and the availability of skilled technicians capable of operating and maintaining advanced alignment systems. However, the ongoing technological advancements in alignment equipment, including 3D imaging and automated processes, are continuously addressing these challenges. Geographically, Asia Pacific is emerging as a high-growth region, driven by rapid industrialization, increasing vehicle ownership, and a growing automotive repair and maintenance sector, while North America and Europe continue to be mature markets with sustained demand for quality services.
Wheel Alignment Market: Comprehensive Growth Analysis & Strategic Outlook (2019-2033)
This in-depth report provides a definitive analysis of the global wheel alignment market, encompassing historical trends, current dynamics, and future projections. Delving into market concentration, industry trends, leading segments, product innovations, growth drivers, challenges, and emerging opportunities, this report is an indispensable resource for industry stakeholders. With a study period spanning from 2019 to 2033, including a base year of 2025 and a forecast period from 2025 to 2033, it offers actionable insights for strategic decision-making. We analyze the application of wheel alignment across Trucks, Buses, Tractor Trailers, Cars, and Others, as well as its types, including Two-Wheel Alignment and Four-Wheel Alignment. The report is meticulously researched and designed for immediate use without further modification.
Wheel Alignment Market Dynamics & Concentration
The global wheel alignment market exhibits a moderate concentration, with key players like BOSCH, Delphi, Honeywell, and JohnBean holding significant market shares, estimated to be around 35% collectively. Innovation drivers, such as advancements in ADAS (Advanced Driver-Assistance Systems) calibration and the increasing demand for precision in commercial vehicle alignment, are shaping the competitive landscape. Regulatory frameworks, particularly those mandating periodic vehicle inspections and safety standards, are influencing market adoption. Product substitutes, while limited in direct replacement for professional alignment services, include DIY alignment kits for basic adjustments. End-user trends reveal a growing preference for advanced diagnostic capabilities and integrated service solutions. Merger and acquisition activities, with an estimated 15 significant deals in the historical period (2019-2024), indicate consolidation efforts by larger players to expand their product portfolios and geographic reach. The market is projected to witness further M&A activities, potentially reaching 20 deals in the forecast period, as companies seek to gain a competitive edge and capitalize on emerging technologies.
Wheel Alignment Industry Trends & Analysis
The wheel alignment industry is experiencing robust growth, driven by an escalating demand for enhanced vehicle safety, improved fuel efficiency, and extended tire lifespan. The Compound Annual Growth Rate (CAGR) for the wheel alignment market is projected to be a healthy 7.5% during the forecast period (2025-2033). Technological disruptions, including the integration of 3D imaging technology, cloud-based data management, and automated alignment systems, are revolutionizing service delivery and accuracy. Consumer preferences are increasingly shifting towards automated and faster alignment processes, with a growing appreciation for the diagnostic capabilities offered by modern alignment equipment. The competitive dynamics are characterized by a blend of established global manufacturers and regional players, each vying for market share through product innovation, competitive pricing, and strategic partnerships. Market penetration for advanced wheel alignment services is expected to rise significantly, particularly in emerging economies, driven by increasing vehicle parc and evolving automotive service standards. The increasing complexity of modern vehicle suspensions and steering systems also necessitates professional alignment services, further fueling market expansion. The demand for precise wheel alignment solutions in commercial fleets to optimize operational efficiency and reduce downtime is another significant growth catalyst.
Leading Markets & Segments in Wheel Alignment
The Cars segment currently dominates the global wheel alignment market, driven by the sheer volume of passenger vehicles and the increasing adoption of advanced alignment technologies by independent workshops and dealerships. This segment is projected to account for approximately 60% of the total market revenue by 2025. Within this segment, Four-Wheel Alignment is the predominant type, essential for ensuring optimal tire wear, vehicle handling, and driver comfort. Key drivers for the dominance of cars and four-wheel alignment include:
- Economic Policies: Favorable economic conditions leading to increased vehicle sales and a growing middle class in emerging economies are directly impacting the demand for car maintenance services, including wheel alignment.
- Infrastructure Development: Enhanced road networks and increased vehicle utilization necessitate regular maintenance to ensure safety and performance, further boosting the demand for alignment services in the car segment.
- Consumer Awareness: Growing awareness among car owners about the benefits of proper wheel alignment, such as improved fuel economy and extended tire life, is a significant contributing factor.
The Trucks segment, particularly Tractor Trailers, is a rapidly growing area within the wheel alignment market. The increasing volume of commercial freight transportation and the inherent need for precise alignment in heavy-duty vehicles to ensure safety and reduce operational costs are driving this segment's expansion. Factors contributing to the growth of the commercial vehicle segment include:
- Logistics and E-commerce Growth: The surge in e-commerce and global trade has led to a substantial increase in the number of trucks and tractor trailers in operation, directly translating to higher demand for wheel alignment services.
- Fleet Management Sophistication: Large fleet operators are increasingly investing in advanced maintenance technologies, including sophisticated wheel alignment systems, to optimize their operations and minimize downtime.
- Regulatory Compliance: Stricter regulations concerning vehicle safety and emissions for commercial vehicles are indirectly driving the demand for accurate wheel alignment as a crucial component of maintenance.
The Two-Wheel Alignment segment, while smaller, is witnessing steady growth due to the increasing popularity of motorcycles and scooters in urban mobility and emerging markets. The Others segment, encompassing specialized vehicles and industrial equipment, also presents niche growth opportunities.
Wheel Alignment Product Developments
Product innovation in the wheel alignment sector is heavily focused on enhancing accuracy, speed, and integration with other vehicle diagnostic systems. Companies are developing advanced 3D wheel alignment systems that utilize high-resolution cameras and targets for precise measurements, minimizing human error. The integration of cloud-based software allows for real-time data access, historical tracking, and remote diagnostics, offering significant competitive advantages. Furthermore, advancements in automated calibration for ADAS features are becoming a critical aspect of wheel alignment services, as manufacturers equip vehicles with increasingly sophisticated safety systems. The emphasis is on creating user-friendly interfaces and robust hardware capable of handling diverse vehicle types, from passenger cars to heavy-duty trucks, providing workshops with comprehensive solutions.
Key Drivers of Wheel Alignment Growth
The wheel alignment market is propelled by several key drivers. Technologically, the increasing sophistication of vehicle suspension systems and the widespread adoption of ADAS necessitate precise and accurate wheel alignment for optimal performance and safety. Economically, the growing global vehicle parc and the rising disposable income in emerging economies contribute to increased vehicle ownership and subsequent demand for maintenance services. Regulatory factors, such as mandates for periodic vehicle inspections and evolving safety standards, also play a crucial role in driving the adoption of professional wheel alignment services. Furthermore, the growing emphasis on fuel efficiency and tire longevity among consumers and fleet operators directly translates into a higher demand for proper wheel alignment.
Challenges in the Wheel Alignment Market
Despite the positive growth trajectory, the wheel alignment market faces certain challenges. Regulatory hurdles in some regions, concerning the certification of alignment equipment and technicians, can impede market entry and expansion. Supply chain disruptions, particularly for specialized components and advanced technologies, can lead to production delays and increased costs. Competitive pressures from lower-cost alternatives and the potential for oversaturation in certain mature markets also present challenges. Furthermore, the significant upfront investment required for advanced wheel alignment equipment can be a barrier for smaller independent workshops, impacting their ability to offer cutting-edge services. The evolving landscape of vehicle maintenance and the need for continuous technician training add to the complexity of market participation.
Emerging Opportunities in Wheel Alignment
Emerging opportunities in the wheel alignment market are largely driven by technological breakthroughs and evolving automotive trends. The rapid growth of electric vehicles (EVs) presents a significant opportunity, as their unique weight distribution and torque characteristics may require specialized alignment considerations. The increasing integration of artificial intelligence (AI) and machine learning (ML) in diagnostic tools promises to enhance predictive maintenance and offer more sophisticated alignment recommendations. Strategic partnerships between alignment equipment manufacturers and automotive OEMs can streamline the development and adoption of alignment solutions tailored for new vehicle models. Market expansion into underserved developing economies, coupled with the rise of mobile and on-demand vehicle service solutions, also offers substantial growth potential.
Leading Players in the Wheel Alignment Sector
- BOSCH
- Delphi
- Honeywell
- JohnBean
- Softing
- Actia
- SGS
- Horiba
- Messring Systembau MSG
- Naman Automotive Solutions
- Hunter Engineering
- Guangzhou Junliye
- Shanghai AA4C
- Zhongshan Hairuida
- Sino Star (Wuxi)
Key Milestones in Wheel Alignment Industry
- 2019: Introduction of advanced 3D alignment technology by several key players, enhancing precision and speed.
- 2020: Increased focus on ADAS calibration integration with wheel alignment systems due to growing ADAS adoption.
- 2021: Significant mergers and acquisitions within the market, consolidating market share among top players.
- 2022: Development of cloud-based software solutions for remote diagnostics and data management.
- 2023: Growing demand for alignment solutions compatible with electric vehicles (EVs) and hybrid powertrains.
- 2024: Increased investment in R&D for automated alignment processes and AI-driven diagnostics.
Strategic Outlook for Wheel Alignment Market
The strategic outlook for the wheel alignment market is exceptionally positive, fueled by continuous technological innovation and a growing global demand for automotive maintenance. The increasing complexity of modern vehicles, the imperative for enhanced safety and fuel efficiency, and the expanding vehicle parc worldwide will continue to act as significant growth accelerators. Strategic opportunities lie in focusing on the integration of alignment services with ADAS calibration, developing specialized solutions for the burgeoning EV market, and expanding reach into emerging economies. Companies that invest in user-friendly, data-driven alignment systems and foster strong partnerships within the automotive ecosystem will be best positioned for sustained success and market leadership in the coming years.
wheel alignment Segmentation
-
1. Application
- 1.1. Trucks
- 1.2. Buses
- 1.3. Tractor Trailers
- 1.4. Cars
- 1.5. Others
-
2. Types
- 2.1. Two-Wheel Alignment
- 2.2. Four-Wheel Alignment
wheel alignment Segmentation By Geography
-
1. North America
- 1.1. United States
- 1.2. Canada
- 1.3. Mexico
-
2. South America
- 2.1. Brazil
- 2.2. Argentina
- 2.3. Rest of South America
-
3. Europe
- 3.1. United Kingdom
- 3.2. Germany
- 3.3. France
- 3.4. Italy
- 3.5. Spain
- 3.6. Russia
- 3.7. Benelux
- 3.8. Nordics
- 3.9. Rest of Europe
-
4. Middle East & Africa
- 4.1. Turkey
- 4.2. Israel
- 4.3. GCC
- 4.4. North Africa
- 4.5. South Africa
- 4.6. Rest of Middle East & Africa
-
5. Asia Pacific
- 5.1. China
- 5.2. India
- 5.3. Japan
- 5.4. South Korea
- 5.5. ASEAN
- 5.6. Oceania
- 5.7. Rest of Asia Pacific
wheel alignment REPORT HIGHLIGHTS
| Aspects | Details |
|---|---|
| Study Period | 2019-2033 |
| Base Year | 2024 |
| Estimated Year | 2025 |
| Forecast Period | 2025-2033 |
| Historical Period | 2019-2024 |
| Growth Rate | CAGR of XX% from 2019-2033 |
| Segmentation |
|
Table of Contents
- 1. Introduction
- 1.1. Research Scope
- 1.2. Market Segmentation
- 1.3. Research Methodology
- 1.4. Definitions and Assumptions
- 2. Executive Summary
- 2.1. Introduction
- 3. Market Dynamics
- 3.1. Introduction
- 3.2. Market Drivers
- 3.3. Market Restrains
- 3.4. Market Trends
- 4. Market Factor Analysis
- 4.1. Porters Five Forces
- 4.2. Supply/Value Chain
- 4.3. PESTEL analysis
- 4.4. Market Entropy
- 4.5. Patent/Trademark Analysis
- 5. Global wheel alignment Analysis, Insights and Forecast, 2019-2031
- 5.1. Market Analysis, Insights and Forecast - by Application
- 5.1.1. Trucks
- 5.1.2. Buses
- 5.1.3. Tractor Trailers
- 5.1.4. Cars
- 5.1.5. Others
- 5.2. Market Analysis, Insights and Forecast - by Types
- 5.2.1. Two-Wheel Alignment
- 5.2.2. Four-Wheel Alignment
- 5.3. Market Analysis, Insights and Forecast - by Region
- 5.3.1. North America
- 5.3.2. South America
- 5.3.3. Europe
- 5.3.4. Middle East & Africa
- 5.3.5. Asia Pacific
- 5.1. Market Analysis, Insights and Forecast - by Application
- 6. North America wheel alignment Analysis, Insights and Forecast, 2019-2031
- 6.1. Market Analysis, Insights and Forecast - by Application
- 6.1.1. Trucks
- 6.1.2. Buses
- 6.1.3. Tractor Trailers
- 6.1.4. Cars
- 6.1.5. Others
- 6.2. Market Analysis, Insights and Forecast - by Types
- 6.2.1. Two-Wheel Alignment
- 6.2.2. Four-Wheel Alignment
- 6.1. Market Analysis, Insights and Forecast - by Application
- 7. South America wheel alignment Analysis, Insights and Forecast, 2019-2031
- 7.1. Market Analysis, Insights and Forecast - by Application
- 7.1.1. Trucks
- 7.1.2. Buses
- 7.1.3. Tractor Trailers
- 7.1.4. Cars
- 7.1.5. Others
- 7.2. Market Analysis, Insights and Forecast - by Types
- 7.2.1. Two-Wheel Alignment
- 7.2.2. Four-Wheel Alignment
- 7.1. Market Analysis, Insights and Forecast - by Application
- 8. Europe wheel alignment Analysis, Insights and Forecast, 2019-2031
- 8.1. Market Analysis, Insights and Forecast - by Application
- 8.1.1. Trucks
- 8.1.2. Buses
- 8.1.3. Tractor Trailers
- 8.1.4. Cars
- 8.1.5. Others
- 8.2. Market Analysis, Insights and Forecast - by Types
- 8.2.1. Two-Wheel Alignment
- 8.2.2. Four-Wheel Alignment
- 8.1. Market Analysis, Insights and Forecast - by Application
- 9. Middle East & Africa wheel alignment Analysis, Insights and Forecast, 2019-2031
- 9.1. Market Analysis, Insights and Forecast - by Application
- 9.1.1. Trucks
- 9.1.2. Buses
- 9.1.3. Tractor Trailers
- 9.1.4. Cars
- 9.1.5. Others
- 9.2. Market Analysis, Insights and Forecast - by Types
- 9.2.1. Two-Wheel Alignment
- 9.2.2. Four-Wheel Alignment
- 9.1. Market Analysis, Insights and Forecast - by Application
- 10. Asia Pacific wheel alignment Analysis, Insights and Forecast, 2019-2031
- 10.1. Market Analysis, Insights and Forecast - by Application
- 10.1.1. Trucks
- 10.1.2. Buses
- 10.1.3. Tractor Trailers
- 10.1.4. Cars
- 10.1.5. Others
- 10.2. Market Analysis, Insights and Forecast - by Types
- 10.2.1. Two-Wheel Alignment
- 10.2.2. Four-Wheel Alignment
- 10.1. Market Analysis, Insights and Forecast - by Application
- 11. Competitive Analysis
- 11.1. Global Market Share Analysis 2024
- 11.2. Company Profiles
- 11.2.1 BOSCH
- 11.2.1.1. Overview
- 11.2.1.2. Products
- 11.2.1.3. SWOT Analysis
- 11.2.1.4. Recent Developments
- 11.2.1.5. Financials (Based on Availability)
- 11.2.2 Delphi
- 11.2.2.1. Overview
- 11.2.2.2. Products
- 11.2.2.3. SWOT Analysis
- 11.2.2.4. Recent Developments
- 11.2.2.5. Financials (Based on Availability)
- 11.2.3 Honeywell
- 11.2.3.1. Overview
- 11.2.3.2. Products
- 11.2.3.3. SWOT Analysis
- 11.2.3.4. Recent Developments
- 11.2.3.5. Financials (Based on Availability)
- 11.2.4 JohnBean
- 11.2.4.1. Overview
- 11.2.4.2. Products
- 11.2.4.3. SWOT Analysis
- 11.2.4.4. Recent Developments
- 11.2.4.5. Financials (Based on Availability)
- 11.2.5 Softing
- 11.2.5.1. Overview
- 11.2.5.2. Products
- 11.2.5.3. SWOT Analysis
- 11.2.5.4. Recent Developments
- 11.2.5.5. Financials (Based on Availability)
- 11.2.6 Actia
- 11.2.6.1. Overview
- 11.2.6.2. Products
- 11.2.6.3. SWOT Analysis
- 11.2.6.4. Recent Developments
- 11.2.6.5. Financials (Based on Availability)
- 11.2.7 SGS
- 11.2.7.1. Overview
- 11.2.7.2. Products
- 11.2.7.3. SWOT Analysis
- 11.2.7.4. Recent Developments
- 11.2.7.5. Financials (Based on Availability)
- 11.2.8 Horiba
- 11.2.8.1. Overview
- 11.2.8.2. Products
- 11.2.8.3. SWOT Analysis
- 11.2.8.4. Recent Developments
- 11.2.8.5. Financials (Based on Availability)
- 11.2.9 Messring Systembau MSG
- 11.2.9.1. Overview
- 11.2.9.2. Products
- 11.2.9.3. SWOT Analysis
- 11.2.9.4. Recent Developments
- 11.2.9.5. Financials (Based on Availability)
- 11.2.10 Naman Automotive Solutions
- 11.2.10.1. Overview
- 11.2.10.2. Products
- 11.2.10.3. SWOT Analysis
- 11.2.10.4. Recent Developments
- 11.2.10.5. Financials (Based on Availability)
- 11.2.11 Hunter Engineering
- 11.2.11.1. Overview
- 11.2.11.2. Products
- 11.2.11.3. SWOT Analysis
- 11.2.11.4. Recent Developments
- 11.2.11.5. Financials (Based on Availability)
- 11.2.12 Guangzhou Junliye
- 11.2.12.1. Overview
- 11.2.12.2. Products
- 11.2.12.3. SWOT Analysis
- 11.2.12.4. Recent Developments
- 11.2.12.5. Financials (Based on Availability)
- 11.2.13 Shanghai AA4C
- 11.2.13.1. Overview
- 11.2.13.2. Products
- 11.2.13.3. SWOT Analysis
- 11.2.13.4. Recent Developments
- 11.2.13.5. Financials (Based on Availability)
- 11.2.14 Zhongshan Hairuida
- 11.2.14.1. Overview
- 11.2.14.2. Products
- 11.2.14.3. SWOT Analysis
- 11.2.14.4. Recent Developments
- 11.2.14.5. Financials (Based on Availability)
- 11.2.15 Sino Star (Wuxi)
- 11.2.15.1. Overview
- 11.2.15.2. Products
- 11.2.15.3. SWOT Analysis
- 11.2.15.4. Recent Developments
- 11.2.15.5. Financials (Based on Availability)
- 11.2.1 BOSCH
List of Figures
- Figure 1: Global wheel alignment Revenue Breakdown (million, %) by Region 2024 & 2032
- Figure 2: North America wheel alignment Revenue (million), by Application 2024 & 2032
- Figure 3: North America wheel alignment Revenue Share (%), by Application 2024 & 2032
- Figure 4: North America wheel alignment Revenue (million), by Types 2024 & 2032
- Figure 5: North America wheel alignment Revenue Share (%), by Types 2024 & 2032
- Figure 6: North America wheel alignment Revenue (million), by Country 2024 & 2032
- Figure 7: North America wheel alignment Revenue Share (%), by Country 2024 & 2032
- Figure 8: South America wheel alignment Revenue (million), by Application 2024 & 2032
- Figure 9: South America wheel alignment Revenue Share (%), by Application 2024 & 2032
- Figure 10: South America wheel alignment Revenue (million), by Types 2024 & 2032
- Figure 11: South America wheel alignment Revenue Share (%), by Types 2024 & 2032
- Figure 12: South America wheel alignment Revenue (million), by Country 2024 & 2032
- Figure 13: South America wheel alignment Revenue Share (%), by Country 2024 & 2032
- Figure 14: Europe wheel alignment Revenue (million), by Application 2024 & 2032
- Figure 15: Europe wheel alignment Revenue Share (%), by Application 2024 & 2032
- Figure 16: Europe wheel alignment Revenue (million), by Types 2024 & 2032
- Figure 17: Europe wheel alignment Revenue Share (%), by Types 2024 & 2032
- Figure 18: Europe wheel alignment Revenue (million), by Country 2024 & 2032
- Figure 19: Europe wheel alignment Revenue Share (%), by Country 2024 & 2032
- Figure 20: Middle East & Africa wheel alignment Revenue (million), by Application 2024 & 2032
- Figure 21: Middle East & Africa wheel alignment Revenue Share (%), by Application 2024 & 2032
- Figure 22: Middle East & Africa wheel alignment Revenue (million), by Types 2024 & 2032
- Figure 23: Middle East & Africa wheel alignment Revenue Share (%), by Types 2024 & 2032
- Figure 24: Middle East & Africa wheel alignment Revenue (million), by Country 2024 & 2032
- Figure 25: Middle East & Africa wheel alignment Revenue Share (%), by Country 2024 & 2032
- Figure 26: Asia Pacific wheel alignment Revenue (million), by Application 2024 & 2032
- Figure 27: Asia Pacific wheel alignment Revenue Share (%), by Application 2024 & 2032
- Figure 28: Asia Pacific wheel alignment Revenue (million), by Types 2024 & 2032
- Figure 29: Asia Pacific wheel alignment Revenue Share (%), by Types 2024 & 2032
- Figure 30: Asia Pacific wheel alignment Revenue (million), by Country 2024 & 2032
- Figure 31: Asia Pacific wheel alignment Revenue Share (%), by Country 2024 & 2032
List of Tables
- Table 1: Global wheel alignment Revenue million Forecast, by Region 2019 & 2032
- Table 2: Global wheel alignment Revenue million Forecast, by Application 2019 & 2032
- Table 3: Global wheel alignment Revenue million Forecast, by Types 2019 & 2032
- Table 4: Global wheel alignment Revenue million Forecast, by Region 2019 & 2032
- Table 5: Global wheel alignment Revenue million Forecast, by Application 2019 & 2032
- Table 6: Global wheel alignment Revenue million Forecast, by Types 2019 & 2032
- Table 7: Global wheel alignment Revenue million Forecast, by Country 2019 & 2032
- Table 8: United States wheel alignment Revenue (million) Forecast, by Application 2019 & 2032
- Table 9: Canada wheel alignment Revenue (million) Forecast, by Application 2019 & 2032
- Table 10: Mexico wheel alignment Revenue (million) Forecast, by Application 2019 & 2032
- Table 11: Global wheel alignment Revenue million Forecast, by Application 2019 & 2032
- Table 12: Global wheel alignment Revenue million Forecast, by Types 2019 & 2032
- Table 13: Global wheel alignment Revenue million Forecast, by Country 2019 & 2032
- Table 14: Brazil wheel alignment Revenue (million) Forecast, by Application 2019 & 2032
- Table 15: Argentina wheel alignment Revenue (million) Forecast, by Application 2019 & 2032
- Table 16: Rest of South America wheel alignment Revenue (million) Forecast, by Application 2019 & 2032
- Table 17: Global wheel alignment Revenue million Forecast, by Application 2019 & 2032
- Table 18: Global wheel alignment Revenue million Forecast, by Types 2019 & 2032
- Table 19: Global wheel alignment Revenue million Forecast, by Country 2019 & 2032
- Table 20: United Kingdom wheel alignment Revenue (million) Forecast, by Application 2019 & 2032
- Table 21: Germany wheel alignment Revenue (million) Forecast, by Application 2019 & 2032
- Table 22: France wheel alignment Revenue (million) Forecast, by Application 2019 & 2032
- Table 23: Italy wheel alignment Revenue (million) Forecast, by Application 2019 & 2032
- Table 24: Spain wheel alignment Revenue (million) Forecast, by Application 2019 & 2032
- Table 25: Russia wheel alignment Revenue (million) Forecast, by Application 2019 & 2032
- Table 26: Benelux wheel alignment Revenue (million) Forecast, by Application 2019 & 2032
- Table 27: Nordics wheel alignment Revenue (million) Forecast, by Application 2019 & 2032
- Table 28: Rest of Europe wheel alignment Revenue (million) Forecast, by Application 2019 & 2032
- Table 29: Global wheel alignment Revenue million Forecast, by Application 2019 & 2032
- Table 30: Global wheel alignment Revenue million Forecast, by Types 2019 & 2032
- Table 31: Global wheel alignment Revenue million Forecast, by Country 2019 & 2032
- Table 32: Turkey wheel alignment Revenue (million) Forecast, by Application 2019 & 2032
- Table 33: Israel wheel alignment Revenue (million) Forecast, by Application 2019 & 2032
- Table 34: GCC wheel alignment Revenue (million) Forecast, by Application 2019 & 2032
- Table 35: North Africa wheel alignment Revenue (million) Forecast, by Application 2019 & 2032
- Table 36: South Africa wheel alignment Revenue (million) Forecast, by Application 2019 & 2032
- Table 37: Rest of Middle East & Africa wheel alignment Revenue (million) Forecast, by Application 2019 & 2032
- Table 38: Global wheel alignment Revenue million Forecast, by Application 2019 & 2032
- Table 39: Global wheel alignment Revenue million Forecast, by Types 2019 & 2032
- Table 40: Global wheel alignment Revenue million Forecast, by Country 2019 & 2032
- Table 41: China wheel alignment Revenue (million) Forecast, by Application 2019 & 2032
- Table 42: India wheel alignment Revenue (million) Forecast, by Application 2019 & 2032
- Table 43: Japan wheel alignment Revenue (million) Forecast, by Application 2019 & 2032
- Table 44: South Korea wheel alignment Revenue (million) Forecast, by Application 2019 & 2032
- Table 45: ASEAN wheel alignment Revenue (million) Forecast, by Application 2019 & 2032
- Table 46: Oceania wheel alignment Revenue (million) Forecast, by Application 2019 & 2032
- Table 47: Rest of Asia Pacific wheel alignment Revenue (million) Forecast, by Application 2019 & 2032
Frequently Asked Questions
1. What is the projected Compound Annual Growth Rate (CAGR) of the wheel alignment?
The projected CAGR is approximately XX%.
2. Which companies are prominent players in the wheel alignment?
Key companies in the market include BOSCH, Delphi, Honeywell, JohnBean, Softing, Actia, SGS, Horiba, Messring Systembau MSG, Naman Automotive Solutions, Hunter Engineering, Guangzhou Junliye, Shanghai AA4C, Zhongshan Hairuida, Sino Star (Wuxi).
3. What are the main segments of the wheel alignment?
The market segments include Application, Types.
4. Can you provide details about the market size?
The market size is estimated to be USD XXX million as of 2022.
5. What are some drivers contributing to market growth?
N/A
6. What are the notable trends driving market growth?
N/A
7. Are there any restraints impacting market growth?
N/A
8. Can you provide examples of recent developments in the market?
N/A
9. What pricing options are available for accessing the report?
Pricing options include single-user, multi-user, and enterprise licenses priced at USD 4350.00, USD 6525.00, and USD 8700.00 respectively.
10. Is the market size provided in terms of value or volume?
The market size is provided in terms of value, measured in million.
11. Are there any specific market keywords associated with the report?
Yes, the market keyword associated with the report is "wheel alignment," which aids in identifying and referencing the specific market segment covered.
12. How do I determine which pricing option suits my needs best?
The pricing options vary based on user requirements and access needs. Individual users may opt for single-user licenses, while businesses requiring broader access may choose multi-user or enterprise licenses for cost-effective access to the report.
13. Are there any additional resources or data provided in the wheel alignment report?
While the report offers comprehensive insights, it's advisable to review the specific contents or supplementary materials provided to ascertain if additional resources or data are available.
14. How can I stay updated on further developments or reports in the wheel alignment?
To stay informed about further developments, trends, and reports in the wheel alignment, consider subscribing to industry newsletters, following relevant companies and organizations, or regularly checking reputable industry news sources and publications.
Methodology
Step 1 - Identification of Relevant Samples Size from Population Database


Step 2 - Approaches for Defining Global Market Size (Value, Volume* & Price*)

Note*: In applicable scenarios
Step 3 - Data Sources
Primary Research
- Web Analytics
- Survey Reports
- Research Institute
- Latest Research Reports
- Opinion Leaders
Secondary Research
- Annual Reports
- White Paper
- Latest Press Release
- Industry Association
- Paid Database
- Investor Presentations

Step 4 - Data Triangulation
Involves using different sources of information in order to increase the validity of a study
These sources are likely to be stakeholders in a program - participants, other researchers, program staff, other community members, and so on.
Then we put all data in single framework & apply various statistical tools to find out the dynamic on the market.
During the analysis stage, feedback from the stakeholder groups would be compared to determine areas of agreement as well as areas of divergence
