

Key Insights
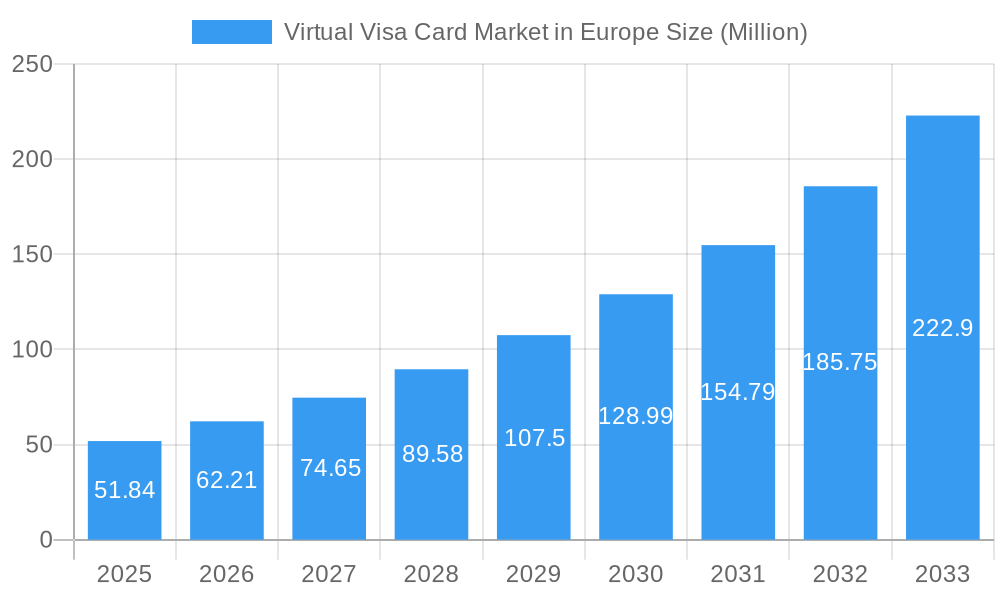
The European virtual Visa card market, valued at €51.84 million in 2025, is experiencing robust growth, projected to expand at a compound annual growth rate (CAGR) of 20% from 2025 to 2033. This surge is fueled by several key factors. The increasing adoption of digital payment solutions across Europe, driven by enhanced convenience and security, is a primary driver. Furthermore, the rising prevalence of e-commerce and online transactions necessitates secure and efficient payment methods, directly benefiting the virtual card market. The expansion of fintech companies offering innovative virtual card solutions, such as WEX Inc, Skrill, Qonto, Marqeta Inc, Stripe, Mastercard Inc, and others, contributes significantly to market growth. These companies are constantly innovating with features like enhanced security protocols, flexible spending controls, and seamless integration with various platforms, further driving adoption. Regulatory changes supporting digital financial services and increased consumer trust in digital payment technologies also positively impact market expansion. The market is segmented based on card type (prepaid, corporate, etc.), user demographics, and transaction value, allowing for targeted market penetration strategies. The growth trajectory is expected to remain strong throughout the forecast period due to the ongoing digitization of the European economy.
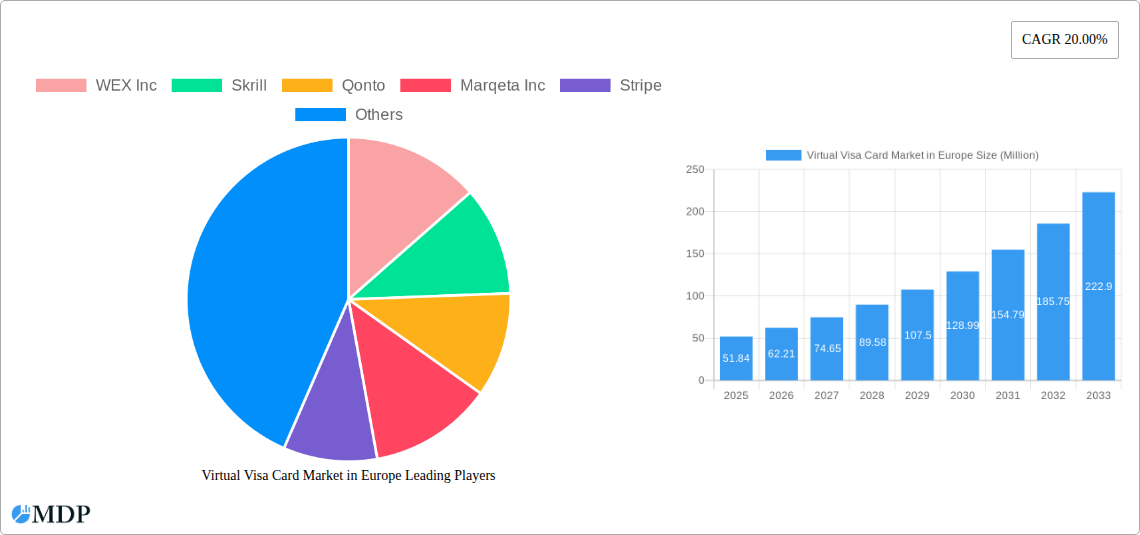
Virtual Visa Card Market in Europe Market Size (In Million)
The competitive landscape is highly dynamic, with established players like Mastercard and emerging fintechs vying for market share. Competition is primarily driven by innovation in features, pricing strategies, and geographic expansion. While challenges remain, such as potential security vulnerabilities and the need for robust consumer education, the long-term outlook for the European virtual Visa card market remains positive. The market's growth is likely to be influenced by advancements in biometric authentication, the integration of blockchain technology, and the increasing adoption of embedded finance solutions. The continued expansion of mobile payment applications and the growing preference for contactless transactions will further solidify the market's upward trajectory. Therefore, investing in and closely monitoring the evolving technological landscape is crucial for both existing and new market entrants.
Virtual Visa Card Market in Europe Company Market Share
Virtual Visa Card Market in Europe: A Comprehensive Report (2019-2033)
This in-depth report provides a comprehensive analysis of the burgeoning Virtual Visa Card Market in Europe, offering invaluable insights for industry stakeholders, investors, and strategists. We delve into market dynamics, competitive landscapes, technological advancements, and future growth projections, covering the period from 2019 to 2033, with a focus on 2025. The report leverages extensive research and data analysis to present a clear, actionable overview of this rapidly evolving sector. Expect detailed breakdowns of market segments, leading players, and emerging trends, enabling informed decision-making in this dynamic market. The total market size in 2025 is estimated at €XX Million.
Virtual Visa Card Market in Europe Market Dynamics & Concentration
The European virtual visa card market is experiencing robust growth, driven by the increasing adoption of digital payment solutions, the rise of fintech companies, and supportive regulatory frameworks. Market concentration is moderately high, with several major players holding significant market share. However, the market is also characterized by considerable dynamism, with ongoing mergers and acquisitions (M&A) activity, new entrants, and innovative product launches. The estimated market share for the top 5 players in 2025 is approximately 60%, indicating a moderately consolidated market.
- Innovation Drivers: Rapid technological advancements in payment processing, enhanced security features, and the integration of virtual cards with various platforms are major drivers.
- Regulatory Frameworks: The evolving regulatory landscape in Europe, including PSD2 and open banking initiatives, is both a challenge and an opportunity, fostering innovation while demanding compliance.
- Product Substitutes: While virtual cards offer significant advantages, traditional payment methods and other digital wallets remain competitive substitutes. However, the convenience and security offered by virtual cards are gradually increasing market penetration.
- End-User Trends: Businesses and consumers increasingly favor the convenience, security, and control afforded by virtual cards for both online and offline transactions. The growth of e-commerce and the increasing adoption of mobile payments are key contributing factors.
- M&A Activities: The number of M&A deals in the virtual card market has increased significantly in recent years (xx deals in 2024), reflecting the strategic importance of this sector and the consolidation underway.
Virtual Visa Card Market in Europe Industry Trends & Analysis
The European virtual visa card market is experiencing significant growth, with a Compound Annual Growth Rate (CAGR) of xx% projected from 2025 to 2033. This growth is fueled by several key factors:
- Market Growth Drivers: The expanding e-commerce sector, increasing smartphone penetration, the growing popularity of mobile payments, and the rising demand for secure and convenient payment solutions are all driving the adoption of virtual visa cards.
- Technological Disruptions: Innovations such as biometric authentication, tokenization, and blockchain technology are enhancing security and user experience, further propelling market growth.
- Consumer Preferences: Consumers increasingly prefer the convenience and flexibility of virtual cards, which allow for easy tracking of expenses and enhanced control over spending.
- Competitive Dynamics: Intense competition among established players and the emergence of new fintech companies are fostering innovation and driving down prices, benefiting consumers. Market penetration in 2025 is estimated at xx%.
Leading Markets & Segments in Virtual Visa Card Market in Europe
The UK, Germany, and France are currently the leading markets for virtual visa cards in Europe. The high concentration of fintech companies and a digitally advanced population contribute to this dominance.
- Key Drivers in Leading Markets:
- UK: Strong fintech ecosystem, high e-commerce penetration, and early adoption of digital payments.
- Germany: Large and established economy, increasing digitalization, and growing demand for secure payment solutions.
- France: Expanding digital infrastructure, supportive regulatory environment, and increasing consumer adoption of mobile payments.
The business segment demonstrates the highest growth potential, driven by the need for efficient expense management and improved security for business transactions.
Virtual Visa Card Market in Europe Product Developments
Recent innovations in virtual visa cards include enhanced security features, such as biometric authentication and tokenization, improved user interfaces, and integration with various business management platforms. This enhances the overall user experience and strengthens market competitiveness by offering tailored solutions for different consumer needs and business sizes.
Key Drivers of Virtual Visa Card Market in Europe Growth
The growth of the virtual visa card market in Europe is propelled by several key factors:
- Technological Advancements: The continuous development of secure payment technologies, including tokenization and biometric authentication, enhances user trust and adoption.
- Economic Factors: The rise of e-commerce and the increasing preference for digital payments are major contributors to market expansion.
- Regulatory Support: Favorable regulatory frameworks and initiatives promoting digitalization within the European Union further stimulate market growth.
Challenges in the Virtual Visa Card Market in Europe Market
Despite significant growth potential, the virtual visa card market faces several challenges:
- Regulatory Hurdles: Compliance with evolving data privacy regulations, such as GDPR, poses a significant challenge for market players.
- Security Concerns: The risk of fraud and data breaches remains a major concern, requiring robust security measures to ensure consumer trust.
- Competitive Pressure: Intense competition among established players and new entrants requires continuous innovation and differentiation strategies to maintain market share. This translates to a projected xx% reduction in average profit margins by 2028.
Emerging Opportunities in Virtual Visa Card Market in Europe
The virtual visa card market presents significant long-term growth opportunities, driven by:
- Technological Breakthroughs: The emergence of new technologies, such as blockchain and AI, will further enhance security and efficiency in payment processing.
- Strategic Partnerships: Collaborations between fintech companies, banks, and merchants will facilitate wider adoption and market expansion.
- Market Expansion: The increasing digitalization of economies in emerging European markets presents significant opportunities for market growth.
Leading Players in the Virtual Visa Card Market in Europe Sector
- WEX Inc
- Skrill
- Qonto
- Marqeta Inc
- Stripe
- Mastercard Inc
- MineralTree
- Klarna
- Bunq
- Aion bank
- Monese Mastercard
- Revolut
- Wirecard
List Not Exhaustive
Key Milestones in Virtual Visa Card Market in Europe Industry
- September 2023: Lloyds Bank launched a new virtual card for businesses in partnership with Visa, simplifying payment processes and enhancing spending control.
- September 2023: Wallester, a virtual card solutions provider, partnered with Transferra, a European fintech provider, to expand its European operations and enhance transaction security.
Strategic Outlook for Virtual Visa Card Market in Europe Market
The future of the European virtual visa card market is bright, with continued growth driven by technological innovation, increasing digital adoption, and supportive regulatory environments. Strategic partnerships, expansion into new markets, and the development of innovative products and services will be crucial for success in this dynamic and competitive landscape. The market is expected to reach €XX Million by 2033, driven by sustained growth in e-commerce and the ongoing digital transformation of the European economy.
Virtual Visa Card Market in Europe Segmentation
-
1. Product type
- 1.1. B2B Virtual cards
- 1.2. B2C Remote Payments Virtual Cards
- 1.3. B2C POC Virtual Cards
-
2. End-user
- 2.1. Consumer use
- 2.2. Business use
Virtual Visa Card Market in Europe Segmentation By Geography
-
1. North America
- 1.1. United States
- 1.2. Canada
- 1.3. Mexico
-
2. South America
- 2.1. Brazil
- 2.2. Argentina
- 2.3. Rest of South America
-
3. Europe
- 3.1. United Kingdom
- 3.2. Germany
- 3.3. France
- 3.4. Italy
- 3.5. Spain
- 3.6. Russia
- 3.7. Benelux
- 3.8. Nordics
- 3.9. Rest of Europe
-
4. Middle East & Africa
- 4.1. Turkey
- 4.2. Israel
- 4.3. GCC
- 4.4. North Africa
- 4.5. South Africa
- 4.6. Rest of Middle East & Africa
-
5. Asia Pacific
- 5.1. China
- 5.2. India
- 5.3. Japan
- 5.4. South Korea
- 5.5. ASEAN
- 5.6. Oceania
- 5.7. Rest of Asia Pacific
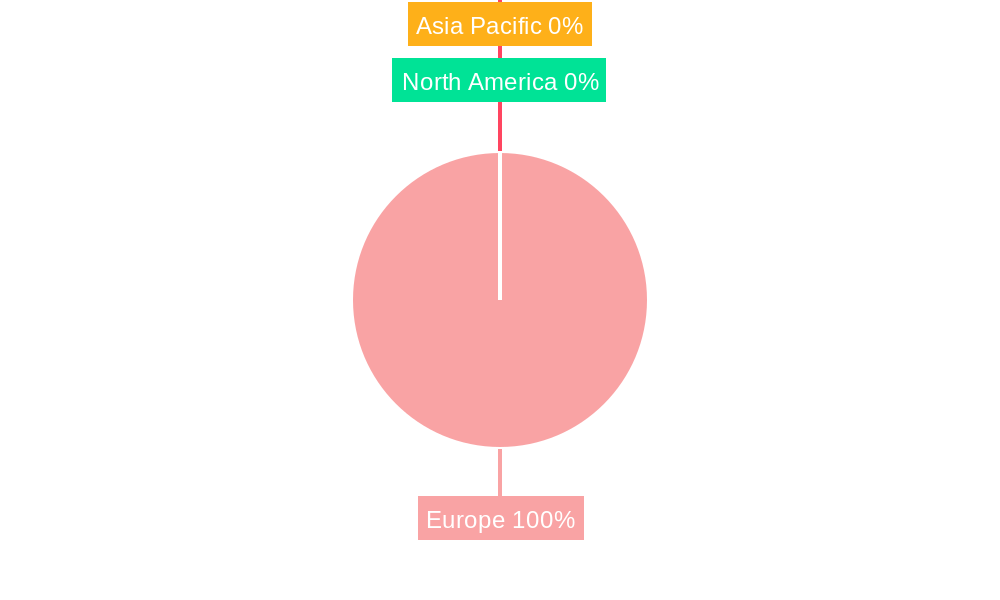
Virtual Visa Card Market in Europe Regional Market Share
Geographic Coverage of Virtual Visa Card Market in Europe
Virtual Visa Card Market in Europe REPORT HIGHLIGHTS
| Aspects | Details |
|---|---|
| Study Period | 2020-2034 |
| Base Year | 2025 |
| Estimated Year | 2026 |
| Forecast Period | 2026-2034 |
| Historical Period | 2020-2025 |
| Growth Rate | CAGR of 20.00% from 2020-2034 |
| Segmentation |
|
Table of Contents
- 1. Introduction
- 1.1. Research Scope
- 1.2. Market Segmentation
- 1.3. Research Objective
- 1.4. Definitions and Assumptions
- 2. Executive Summary
- 2.1. Market Snapshot
- 3. Market Dynamics
- 3.1. Market Drivers
- 3.2. Market Restrains
- 3.3. Market Trends
- 3.4. Market Opportunities
- 4. Market Factor Analysis
- 4.1. Porters Five Forces
- 4.1.1. Bargaining Power of Suppliers
- 4.1.2. Bargaining Power of Buyers
- 4.1.3. Threat of New Entrants
- 4.1.4. Threat of Substitutes
- 4.1.5. Competitive Rivalry
- 4.2. PESTEL analysis
- 4.3. BCG Analysis
- 4.3.1. Stars (High Growth, High Market Share)
- 4.3.2. Cash Cows (Low Growth, High Market Share)
- 4.3.3. Question Mark (High Growth, Low Market Share)
- 4.3.4. Dogs (Low Growth, Low Market Share)
- 4.4. Ansoff Matrix Analysis
- 4.5. Supply Chain Analysis
- 4.6. Regulatory Landscape
- 4.7. Current Market Potential and Opportunity Assessment (TAM–SAM–SOM Framework)
- 4.8. MDP Analyst Note
- 4.1. Porters Five Forces
- 5. Market Analysis, Insights and Forecast 2021-2033
- 5.1. Market Analysis, Insights and Forecast - by Product type
- 5.1.1. B2B Virtual cards
- 5.1.2. B2C Remote Payments Virtual Cards
- 5.1.3. B2C POC Virtual Cards
- 5.2. Market Analysis, Insights and Forecast - by End-user
- 5.2.1. Consumer use
- 5.2.2. Business use
- 5.3. Market Analysis, Insights and Forecast - by Region
- 5.3.1. North America
- 5.3.2. South America
- 5.3.3. Europe
- 5.3.4. Middle East & Africa
- 5.3.5. Asia Pacific
- 5.1. Market Analysis, Insights and Forecast - by Product type
- 6. Global Virtual Visa Card Market in Europe Analysis, Insights and Forecast, 2021-2033
- 6.1. Market Analysis, Insights and Forecast - by Product type
- 6.1.1. B2B Virtual cards
- 6.1.2. B2C Remote Payments Virtual Cards
- 6.1.3. B2C POC Virtual Cards
- 6.2. Market Analysis, Insights and Forecast - by End-user
- 6.2.1. Consumer use
- 6.2.2. Business use
- 6.1. Market Analysis, Insights and Forecast - by Product type
- 7. North America Virtual Visa Card Market in Europe Analysis, Insights and Forecast, 2020-2032
- 7.1. Market Analysis, Insights and Forecast - by Product type
- 7.1.1. B2B Virtual cards
- 7.1.2. B2C Remote Payments Virtual Cards
- 7.1.3. B2C POC Virtual Cards
- 7.2. Market Analysis, Insights and Forecast - by End-user
- 7.2.1. Consumer use
- 7.2.2. Business use
- 7.1. Market Analysis, Insights and Forecast - by Product type
- 8. South America Virtual Visa Card Market in Europe Analysis, Insights and Forecast, 2020-2032
- 8.1. Market Analysis, Insights and Forecast - by Product type
- 8.1.1. B2B Virtual cards
- 8.1.2. B2C Remote Payments Virtual Cards
- 8.1.3. B2C POC Virtual Cards
- 8.2. Market Analysis, Insights and Forecast - by End-user
- 8.2.1. Consumer use
- 8.2.2. Business use
- 8.1. Market Analysis, Insights and Forecast - by Product type
- 9. Europe Virtual Visa Card Market in Europe Analysis, Insights and Forecast, 2020-2032
- 9.1. Market Analysis, Insights and Forecast - by Product type
- 9.1.1. B2B Virtual cards
- 9.1.2. B2C Remote Payments Virtual Cards
- 9.1.3. B2C POC Virtual Cards
- 9.2. Market Analysis, Insights and Forecast - by End-user
- 9.2.1. Consumer use
- 9.2.2. Business use
- 9.1. Market Analysis, Insights and Forecast - by Product type
- 10. Middle East & Africa Virtual Visa Card Market in Europe Analysis, Insights and Forecast, 2020-2032
- 10.1. Market Analysis, Insights and Forecast - by Product type
- 10.1.1. B2B Virtual cards
- 10.1.2. B2C Remote Payments Virtual Cards
- 10.1.3. B2C POC Virtual Cards
- 10.2. Market Analysis, Insights and Forecast - by End-user
- 10.2.1. Consumer use
- 10.2.2. Business use
- 10.1. Market Analysis, Insights and Forecast - by Product type
- 11. Asia Pacific Virtual Visa Card Market in Europe Analysis, Insights and Forecast, 2020-2032
- 11.1. Market Analysis, Insights and Forecast - by Product type
- 11.1.1. B2B Virtual cards
- 11.1.2. B2C Remote Payments Virtual Cards
- 11.1.3. B2C POC Virtual Cards
- 11.2. Market Analysis, Insights and Forecast - by End-user
- 11.2.1. Consumer use
- 11.2.2. Business use
- 11.1. Market Analysis, Insights and Forecast - by Product type
- 12. Competitive Analysis
- 12.1. Company Profiles
- 12.1.1 WEX Inc
- 12.1.1.1. Company Overview
- 12.1.1.2. Products
- 12.1.1.3. Company Financials
- 12.1.1.4. SWOT Analysis
- 12.1.2 Skrill
- 12.1.2.1. Company Overview
- 12.1.2.2. Products
- 12.1.2.3. Company Financials
- 12.1.2.4. SWOT Analysis
- 12.1.3 Qonto
- 12.1.3.1. Company Overview
- 12.1.3.2. Products
- 12.1.3.3. Company Financials
- 12.1.3.4. SWOT Analysis
- 12.1.4 Marqeta Inc
- 12.1.4.1. Company Overview
- 12.1.4.2. Products
- 12.1.4.3. Company Financials
- 12.1.4.4. SWOT Analysis
- 12.1.5 Stripe
- 12.1.5.1. Company Overview
- 12.1.5.2. Products
- 12.1.5.3. Company Financials
- 12.1.5.4. SWOT Analysis
- 12.1.6 Master card Inc
- 12.1.6.1. Company Overview
- 12.1.6.2. Products
- 12.1.6.3. Company Financials
- 12.1.6.4. SWOT Analysis
- 12.1.7 MineralTree
- 12.1.7.1. Company Overview
- 12.1.7.2. Products
- 12.1.7.3. Company Financials
- 12.1.7.4. SWOT Analysis
- 12.1.8 Klarna
- 12.1.8.1. Company Overview
- 12.1.8.2. Products
- 12.1.8.3. Company Financials
- 12.1.8.4. SWOT Analysis
- 12.1.9 Bunq
- 12.1.9.1. Company Overview
- 12.1.9.2. Products
- 12.1.9.3. Company Financials
- 12.1.9.4. SWOT Analysis
- 12.1.10 Aion bank
- 12.1.10.1. Company Overview
- 12.1.10.2. Products
- 12.1.10.3. Company Financials
- 12.1.10.4. SWOT Analysis
- 12.1.11 Monese Mastercard
- 12.1.11.1. Company Overview
- 12.1.11.2. Products
- 12.1.11.3. Company Financials
- 12.1.11.4. SWOT Analysis
- 12.1.12 Revolut
- 12.1.12.1. Company Overview
- 12.1.12.2. Products
- 12.1.12.3. Company Financials
- 12.1.12.4. SWOT Analysis
- 12.1.13 Wirecard**List Not Exhaustive
- 12.1.13.1. Company Overview
- 12.1.13.2. Products
- 12.1.13.3. Company Financials
- 12.1.13.4. SWOT Analysis
- 12.1.1 WEX Inc
- 12.2. Market Entropy
- 12.2.1 Company's Key Areas Served
- 12.2.2 Recent Developments
- 12.3. Company Market Share Analysis 2025
- 12.3.1 Top 5 Companies Market Share Analysis
- 12.3.2 Top 3 Companies Market Share Analysis
- 12.4. List of Potential Customers
- 13. Research Methodology
List of Figures
- Figure 1: Global Virtual Visa Card Market in Europe Revenue Breakdown (Million, %) by Region 2025 & 2033
- Figure 2: Global Virtual Visa Card Market in Europe Volume Breakdown (Billion, %) by Region 2025 & 2033
- Figure 3: North America Virtual Visa Card Market in Europe Revenue (Million), by Product type 2025 & 2033
- Figure 4: North America Virtual Visa Card Market in Europe Volume (Billion), by Product type 2025 & 2033
- Figure 5: North America Virtual Visa Card Market in Europe Revenue Share (%), by Product type 2025 & 2033
- Figure 6: North America Virtual Visa Card Market in Europe Volume Share (%), by Product type 2025 & 2033
- Figure 7: North America Virtual Visa Card Market in Europe Revenue (Million), by End-user 2025 & 2033
- Figure 8: North America Virtual Visa Card Market in Europe Volume (Billion), by End-user 2025 & 2033
- Figure 9: North America Virtual Visa Card Market in Europe Revenue Share (%), by End-user 2025 & 2033
- Figure 10: North America Virtual Visa Card Market in Europe Volume Share (%), by End-user 2025 & 2033
- Figure 11: North America Virtual Visa Card Market in Europe Revenue (Million), by Country 2025 & 2033
- Figure 12: North America Virtual Visa Card Market in Europe Volume (Billion), by Country 2025 & 2033
- Figure 13: North America Virtual Visa Card Market in Europe Revenue Share (%), by Country 2025 & 2033
- Figure 14: North America Virtual Visa Card Market in Europe Volume Share (%), by Country 2025 & 2033
- Figure 15: South America Virtual Visa Card Market in Europe Revenue (Million), by Product type 2025 & 2033
- Figure 16: South America Virtual Visa Card Market in Europe Volume (Billion), by Product type 2025 & 2033
- Figure 17: South America Virtual Visa Card Market in Europe Revenue Share (%), by Product type 2025 & 2033
- Figure 18: South America Virtual Visa Card Market in Europe Volume Share (%), by Product type 2025 & 2033
- Figure 19: South America Virtual Visa Card Market in Europe Revenue (Million), by End-user 2025 & 2033
- Figure 20: South America Virtual Visa Card Market in Europe Volume (Billion), by End-user 2025 & 2033
- Figure 21: South America Virtual Visa Card Market in Europe Revenue Share (%), by End-user 2025 & 2033
- Figure 22: South America Virtual Visa Card Market in Europe Volume Share (%), by End-user 2025 & 2033
- Figure 23: South America Virtual Visa Card Market in Europe Revenue (Million), by Country 2025 & 2033
- Figure 24: South America Virtual Visa Card Market in Europe Volume (Billion), by Country 2025 & 2033
- Figure 25: South America Virtual Visa Card Market in Europe Revenue Share (%), by Country 2025 & 2033
- Figure 26: South America Virtual Visa Card Market in Europe Volume Share (%), by Country 2025 & 2033
- Figure 27: Europe Virtual Visa Card Market in Europe Revenue (Million), by Product type 2025 & 2033
- Figure 28: Europe Virtual Visa Card Market in Europe Volume (Billion), by Product type 2025 & 2033
- Figure 29: Europe Virtual Visa Card Market in Europe Revenue Share (%), by Product type 2025 & 2033
- Figure 30: Europe Virtual Visa Card Market in Europe Volume Share (%), by Product type 2025 & 2033
- Figure 31: Europe Virtual Visa Card Market in Europe Revenue (Million), by End-user 2025 & 2033
- Figure 32: Europe Virtual Visa Card Market in Europe Volume (Billion), by End-user 2025 & 2033
- Figure 33: Europe Virtual Visa Card Market in Europe Revenue Share (%), by End-user 2025 & 2033
- Figure 34: Europe Virtual Visa Card Market in Europe Volume Share (%), by End-user 2025 & 2033
- Figure 35: Europe Virtual Visa Card Market in Europe Revenue (Million), by Country 2025 & 2033
- Figure 36: Europe Virtual Visa Card Market in Europe Volume (Billion), by Country 2025 & 2033
- Figure 37: Europe Virtual Visa Card Market in Europe Revenue Share (%), by Country 2025 & 2033
- Figure 38: Europe Virtual Visa Card Market in Europe Volume Share (%), by Country 2025 & 2033
- Figure 39: Middle East & Africa Virtual Visa Card Market in Europe Revenue (Million), by Product type 2025 & 2033
- Figure 40: Middle East & Africa Virtual Visa Card Market in Europe Volume (Billion), by Product type 2025 & 2033
- Figure 41: Middle East & Africa Virtual Visa Card Market in Europe Revenue Share (%), by Product type 2025 & 2033
- Figure 42: Middle East & Africa Virtual Visa Card Market in Europe Volume Share (%), by Product type 2025 & 2033
- Figure 43: Middle East & Africa Virtual Visa Card Market in Europe Revenue (Million), by End-user 2025 & 2033
- Figure 44: Middle East & Africa Virtual Visa Card Market in Europe Volume (Billion), by End-user 2025 & 2033
- Figure 45: Middle East & Africa Virtual Visa Card Market in Europe Revenue Share (%), by End-user 2025 & 2033
- Figure 46: Middle East & Africa Virtual Visa Card Market in Europe Volume Share (%), by End-user 2025 & 2033
- Figure 47: Middle East & Africa Virtual Visa Card Market in Europe Revenue (Million), by Country 2025 & 2033
- Figure 48: Middle East & Africa Virtual Visa Card Market in Europe Volume (Billion), by Country 2025 & 2033
- Figure 49: Middle East & Africa Virtual Visa Card Market in Europe Revenue Share (%), by Country 2025 & 2033
- Figure 50: Middle East & Africa Virtual Visa Card Market in Europe Volume Share (%), by Country 2025 & 2033
- Figure 51: Asia Pacific Virtual Visa Card Market in Europe Revenue (Million), by Product type 2025 & 2033
- Figure 52: Asia Pacific Virtual Visa Card Market in Europe Volume (Billion), by Product type 2025 & 2033
- Figure 53: Asia Pacific Virtual Visa Card Market in Europe Revenue Share (%), by Product type 2025 & 2033
- Figure 54: Asia Pacific Virtual Visa Card Market in Europe Volume Share (%), by Product type 2025 & 2033
- Figure 55: Asia Pacific Virtual Visa Card Market in Europe Revenue (Million), by End-user 2025 & 2033
- Figure 56: Asia Pacific Virtual Visa Card Market in Europe Volume (Billion), by End-user 2025 & 2033
- Figure 57: Asia Pacific Virtual Visa Card Market in Europe Revenue Share (%), by End-user 2025 & 2033
- Figure 58: Asia Pacific Virtual Visa Card Market in Europe Volume Share (%), by End-user 2025 & 2033
- Figure 59: Asia Pacific Virtual Visa Card Market in Europe Revenue (Million), by Country 2025 & 2033
- Figure 60: Asia Pacific Virtual Visa Card Market in Europe Volume (Billion), by Country 2025 & 2033
- Figure 61: Asia Pacific Virtual Visa Card Market in Europe Revenue Share (%), by Country 2025 & 2033
- Figure 62: Asia Pacific Virtual Visa Card Market in Europe Volume Share (%), by Country 2025 & 2033
List of Tables
- Table 1: Global Virtual Visa Card Market in Europe Revenue Million Forecast, by Product type 2020 & 2033
- Table 2: Global Virtual Visa Card Market in Europe Volume Billion Forecast, by Product type 2020 & 2033
- Table 3: Global Virtual Visa Card Market in Europe Revenue Million Forecast, by End-user 2020 & 2033
- Table 4: Global Virtual Visa Card Market in Europe Volume Billion Forecast, by End-user 2020 & 2033
- Table 5: Global Virtual Visa Card Market in Europe Revenue Million Forecast, by Region 2020 & 2033
- Table 6: Global Virtual Visa Card Market in Europe Volume Billion Forecast, by Region 2020 & 2033
- Table 7: Global Virtual Visa Card Market in Europe Revenue Million Forecast, by Product type 2020 & 2033
- Table 8: Global Virtual Visa Card Market in Europe Volume Billion Forecast, by Product type 2020 & 2033
- Table 9: Global Virtual Visa Card Market in Europe Revenue Million Forecast, by End-user 2020 & 2033
- Table 10: Global Virtual Visa Card Market in Europe Volume Billion Forecast, by End-user 2020 & 2033
- Table 11: Global Virtual Visa Card Market in Europe Revenue Million Forecast, by Country 2020 & 2033
- Table 12: Global Virtual Visa Card Market in Europe Volume Billion Forecast, by Country 2020 & 2033
- Table 13: United States Virtual Visa Card Market in Europe Revenue (Million) Forecast, by Application 2020 & 2033
- Table 14: United States Virtual Visa Card Market in Europe Volume (Billion) Forecast, by Application 2020 & 2033
- Table 15: Canada Virtual Visa Card Market in Europe Revenue (Million) Forecast, by Application 2020 & 2033
- Table 16: Canada Virtual Visa Card Market in Europe Volume (Billion) Forecast, by Application 2020 & 2033
- Table 17: Mexico Virtual Visa Card Market in Europe Revenue (Million) Forecast, by Application 2020 & 2033
- Table 18: Mexico Virtual Visa Card Market in Europe Volume (Billion) Forecast, by Application 2020 & 2033
- Table 19: Global Virtual Visa Card Market in Europe Revenue Million Forecast, by Product type 2020 & 2033
- Table 20: Global Virtual Visa Card Market in Europe Volume Billion Forecast, by Product type 2020 & 2033
- Table 21: Global Virtual Visa Card Market in Europe Revenue Million Forecast, by End-user 2020 & 2033
- Table 22: Global Virtual Visa Card Market in Europe Volume Billion Forecast, by End-user 2020 & 2033
- Table 23: Global Virtual Visa Card Market in Europe Revenue Million Forecast, by Country 2020 & 2033
- Table 24: Global Virtual Visa Card Market in Europe Volume Billion Forecast, by Country 2020 & 2033
- Table 25: Brazil Virtual Visa Card Market in Europe Revenue (Million) Forecast, by Application 2020 & 2033
- Table 26: Brazil Virtual Visa Card Market in Europe Volume (Billion) Forecast, by Application 2020 & 2033
- Table 27: Argentina Virtual Visa Card Market in Europe Revenue (Million) Forecast, by Application 2020 & 2033
- Table 28: Argentina Virtual Visa Card Market in Europe Volume (Billion) Forecast, by Application 2020 & 2033
- Table 29: Rest of South America Virtual Visa Card Market in Europe Revenue (Million) Forecast, by Application 2020 & 2033
- Table 30: Rest of South America Virtual Visa Card Market in Europe Volume (Billion) Forecast, by Application 2020 & 2033
- Table 31: Global Virtual Visa Card Market in Europe Revenue Million Forecast, by Product type 2020 & 2033
- Table 32: Global Virtual Visa Card Market in Europe Volume Billion Forecast, by Product type 2020 & 2033
- Table 33: Global Virtual Visa Card Market in Europe Revenue Million Forecast, by End-user 2020 & 2033
- Table 34: Global Virtual Visa Card Market in Europe Volume Billion Forecast, by End-user 2020 & 2033
- Table 35: Global Virtual Visa Card Market in Europe Revenue Million Forecast, by Country 2020 & 2033
- Table 36: Global Virtual Visa Card Market in Europe Volume Billion Forecast, by Country 2020 & 2033
- Table 37: United Kingdom Virtual Visa Card Market in Europe Revenue (Million) Forecast, by Application 2020 & 2033
- Table 38: United Kingdom Virtual Visa Card Market in Europe Volume (Billion) Forecast, by Application 2020 & 2033
- Table 39: Germany Virtual Visa Card Market in Europe Revenue (Million) Forecast, by Application 2020 & 2033
- Table 40: Germany Virtual Visa Card Market in Europe Volume (Billion) Forecast, by Application 2020 & 2033
- Table 41: France Virtual Visa Card Market in Europe Revenue (Million) Forecast, by Application 2020 & 2033
- Table 42: France Virtual Visa Card Market in Europe Volume (Billion) Forecast, by Application 2020 & 2033
- Table 43: Italy Virtual Visa Card Market in Europe Revenue (Million) Forecast, by Application 2020 & 2033
- Table 44: Italy Virtual Visa Card Market in Europe Volume (Billion) Forecast, by Application 2020 & 2033
- Table 45: Spain Virtual Visa Card Market in Europe Revenue (Million) Forecast, by Application 2020 & 2033
- Table 46: Spain Virtual Visa Card Market in Europe Volume (Billion) Forecast, by Application 2020 & 2033
- Table 47: Russia Virtual Visa Card Market in Europe Revenue (Million) Forecast, by Application 2020 & 2033
- Table 48: Russia Virtual Visa Card Market in Europe Volume (Billion) Forecast, by Application 2020 & 2033
- Table 49: Benelux Virtual Visa Card Market in Europe Revenue (Million) Forecast, by Application 2020 & 2033
- Table 50: Benelux Virtual Visa Card Market in Europe Volume (Billion) Forecast, by Application 2020 & 2033
- Table 51: Nordics Virtual Visa Card Market in Europe Revenue (Million) Forecast, by Application 2020 & 2033
- Table 52: Nordics Virtual Visa Card Market in Europe Volume (Billion) Forecast, by Application 2020 & 2033
- Table 53: Rest of Europe Virtual Visa Card Market in Europe Revenue (Million) Forecast, by Application 2020 & 2033
- Table 54: Rest of Europe Virtual Visa Card Market in Europe Volume (Billion) Forecast, by Application 2020 & 2033
- Table 55: Global Virtual Visa Card Market in Europe Revenue Million Forecast, by Product type 2020 & 2033
- Table 56: Global Virtual Visa Card Market in Europe Volume Billion Forecast, by Product type 2020 & 2033
- Table 57: Global Virtual Visa Card Market in Europe Revenue Million Forecast, by End-user 2020 & 2033
- Table 58: Global Virtual Visa Card Market in Europe Volume Billion Forecast, by End-user 2020 & 2033
- Table 59: Global Virtual Visa Card Market in Europe Revenue Million Forecast, by Country 2020 & 2033
- Table 60: Global Virtual Visa Card Market in Europe Volume Billion Forecast, by Country 2020 & 2033
- Table 61: Turkey Virtual Visa Card Market in Europe Revenue (Million) Forecast, by Application 2020 & 2033
- Table 62: Turkey Virtual Visa Card Market in Europe Volume (Billion) Forecast, by Application 2020 & 2033
- Table 63: Israel Virtual Visa Card Market in Europe Revenue (Million) Forecast, by Application 2020 & 2033
- Table 64: Israel Virtual Visa Card Market in Europe Volume (Billion) Forecast, by Application 2020 & 2033
- Table 65: GCC Virtual Visa Card Market in Europe Revenue (Million) Forecast, by Application 2020 & 2033
- Table 66: GCC Virtual Visa Card Market in Europe Volume (Billion) Forecast, by Application 2020 & 2033
- Table 67: North Africa Virtual Visa Card Market in Europe Revenue (Million) Forecast, by Application 2020 & 2033
- Table 68: North Africa Virtual Visa Card Market in Europe Volume (Billion) Forecast, by Application 2020 & 2033
- Table 69: South Africa Virtual Visa Card Market in Europe Revenue (Million) Forecast, by Application 2020 & 2033
- Table 70: South Africa Virtual Visa Card Market in Europe Volume (Billion) Forecast, by Application 2020 & 2033
- Table 71: Rest of Middle East & Africa Virtual Visa Card Market in Europe Revenue (Million) Forecast, by Application 2020 & 2033
- Table 72: Rest of Middle East & Africa Virtual Visa Card Market in Europe Volume (Billion) Forecast, by Application 2020 & 2033
- Table 73: Global Virtual Visa Card Market in Europe Revenue Million Forecast, by Product type 2020 & 2033
- Table 74: Global Virtual Visa Card Market in Europe Volume Billion Forecast, by Product type 2020 & 2033
- Table 75: Global Virtual Visa Card Market in Europe Revenue Million Forecast, by End-user 2020 & 2033
- Table 76: Global Virtual Visa Card Market in Europe Volume Billion Forecast, by End-user 2020 & 2033
- Table 77: Global Virtual Visa Card Market in Europe Revenue Million Forecast, by Country 2020 & 2033
- Table 78: Global Virtual Visa Card Market in Europe Volume Billion Forecast, by Country 2020 & 2033
- Table 79: China Virtual Visa Card Market in Europe Revenue (Million) Forecast, by Application 2020 & 2033
- Table 80: China Virtual Visa Card Market in Europe Volume (Billion) Forecast, by Application 2020 & 2033
- Table 81: India Virtual Visa Card Market in Europe Revenue (Million) Forecast, by Application 2020 & 2033
- Table 82: India Virtual Visa Card Market in Europe Volume (Billion) Forecast, by Application 2020 & 2033
- Table 83: Japan Virtual Visa Card Market in Europe Revenue (Million) Forecast, by Application 2020 & 2033
- Table 84: Japan Virtual Visa Card Market in Europe Volume (Billion) Forecast, by Application 2020 & 2033
- Table 85: South Korea Virtual Visa Card Market in Europe Revenue (Million) Forecast, by Application 2020 & 2033
- Table 86: South Korea Virtual Visa Card Market in Europe Volume (Billion) Forecast, by Application 2020 & 2033
- Table 87: ASEAN Virtual Visa Card Market in Europe Revenue (Million) Forecast, by Application 2020 & 2033
- Table 88: ASEAN Virtual Visa Card Market in Europe Volume (Billion) Forecast, by Application 2020 & 2033
- Table 89: Oceania Virtual Visa Card Market in Europe Revenue (Million) Forecast, by Application 2020 & 2033
- Table 90: Oceania Virtual Visa Card Market in Europe Volume (Billion) Forecast, by Application 2020 & 2033
- Table 91: Rest of Asia Pacific Virtual Visa Card Market in Europe Revenue (Million) Forecast, by Application 2020 & 2033
- Table 92: Rest of Asia Pacific Virtual Visa Card Market in Europe Volume (Billion) Forecast, by Application 2020 & 2033
Frequently Asked Questions
1. What is the projected Compound Annual Growth Rate (CAGR) of the Virtual Visa Card Market in Europe?
The projected CAGR is approximately 20.00%.
2. Which companies are prominent players in the Virtual Visa Card Market in Europe?
Key companies in the market include WEX Inc, Skrill, Qonto, Marqeta Inc, Stripe, Master card Inc, MineralTree, Klarna, Bunq, Aion bank, Monese Mastercard, Revolut, Wirecard**List Not Exhaustive.
3. What are the main segments of the Virtual Visa Card Market in Europe?
The market segments include Product type, End-user.
4. Can you provide details about the market size?
The market size is estimated to be USD 51.84 Million as of 2022.
5. What are some drivers contributing to market growth?
Rising in Adoption of Digital Payment Method; Increase in Adoption of Virtual Card Payments by E-Commerce Business.
6. What are the notable trends driving market growth?
Rising Digital Payment.
7. Are there any restraints impacting market growth?
Rising in Adoption of Digital Payment Method; Increase in Adoption of Virtual Card Payments by E-Commerce Business.
8. Can you provide examples of recent developments in the market?
In September 2023, Lloyds Bank launched a new virtual card for its businesses in partnership with Visa. The virtual card payment service will be available to Lloyds customers and is designed for users to control and track spending with the simplification of the payment process. Visa Commercial Pay exists as a virtual payment solution providing the technology to help businesses simplify and streamline their payments in a secure and controlled way.
9. What pricing options are available for accessing the report?
Pricing options include single-user, multi-user, and enterprise licenses priced at USD 4750, USD 4950, and USD 6800 respectively.
10. Is the market size provided in terms of value or volume?
The market size is provided in terms of value, measured in Million and volume, measured in Billion.
11. Are there any specific market keywords associated with the report?
Yes, the market keyword associated with the report is "Virtual Visa Card Market in Europe," which aids in identifying and referencing the specific market segment covered.
12. How do I determine which pricing option suits my needs best?
The pricing options vary based on user requirements and access needs. Individual users may opt for single-user licenses, while businesses requiring broader access may choose multi-user or enterprise licenses for cost-effective access to the report.
13. Are there any additional resources or data provided in the Virtual Visa Card Market in Europe report?
While the report offers comprehensive insights, it's advisable to review the specific contents or supplementary materials provided to ascertain if additional resources or data are available.
14. How can I stay updated on further developments or reports in the Virtual Visa Card Market in Europe?
To stay informed about further developments, trends, and reports in the Virtual Visa Card Market in Europe, consider subscribing to industry newsletters, following relevant companies and organizations, or regularly checking reputable industry news sources and publications.
Methodology
Step 1 - Identification of Relevant Samples Size from Population Database


Step 2 - Approaches for Defining Global Market Size (Value, Volume* & Price*)

Note*: In applicable scenarios
Step 3 - Data Sources
Primary Research
- Web Analytics
- Survey Reports
- Research Institute
- Latest Research Reports
- Opinion Leaders
Secondary Research
- Annual Reports
- White Paper
- Latest Press Release
- Industry Association
- Paid Database
- Investor Presentations

Step 4 - Data Triangulation
Involves using different sources of information in order to increase the validity of a study
These sources are likely to be stakeholders in a program - participants, other researchers, program staff, other community members, and so on.
Then we put all data in single framework & apply various statistical tools to find out the dynamic on the market.
During the analysis stage, feedback from the stakeholder groups would be compared to determine areas of agreement as well as areas of divergence