

Key Insights
The United States vans market is projected for robust growth, with an estimated CAGR of 5.73% from 2025 to 2033. The market size for 2025 is estimated at $11.79 billion. Key growth drivers include the burgeoning e-commerce sector, necessitating efficient last-mile delivery solutions, and the increasing demand for passenger vans driven by recreational activities. The transition towards sustainable transportation is also influencing the market, with hybrid and electric van adoption expected to accelerate despite current challenges related to initial costs and charging infrastructure. Competitive dynamics among established automotive manufacturers and emerging electric vehicle (EV) producers will foster innovation and potential price adjustments.
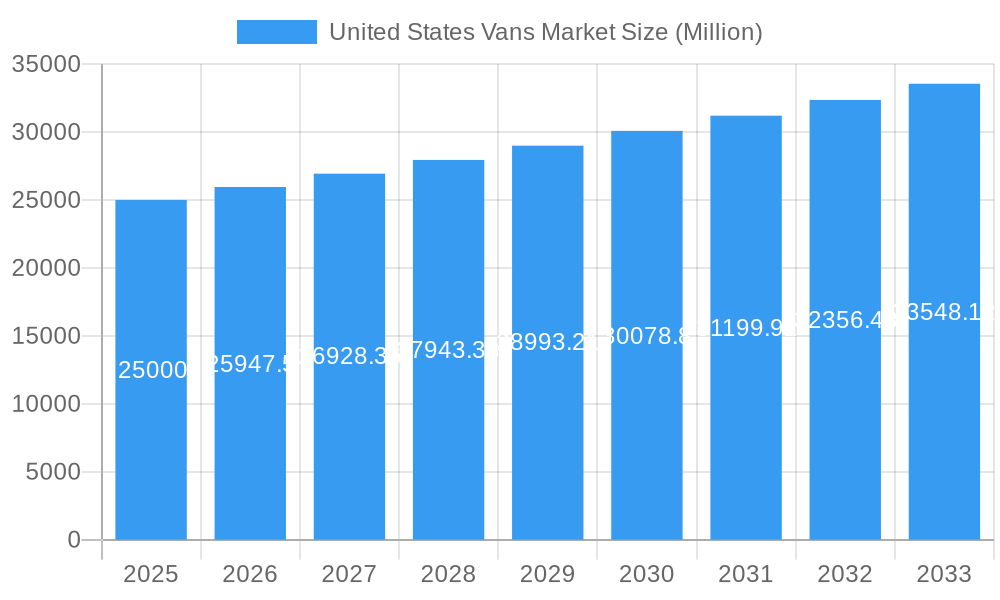
United States Vans Market Market Size (In Billion)
Market segmentation by propulsion type reveals a shift towards hybrid and electric vans, with gasoline-powered models currently dominating. However, the market share for electric and hybrid variants is forecast to grow steadily. Regionally, North America, particularly the United States, exhibits strong demand driven by economic and lifestyle trends. Emerging opportunities exist in other regions contingent on infrastructure development and economic conditions. Leading players such as Ford, GM, and Ram, alongside technological advancements, are poised to fuel further market expansion. Key restraints include fuel price volatility, raw material costs, and supply chain disruptions, which can impact manufacturing and pricing.
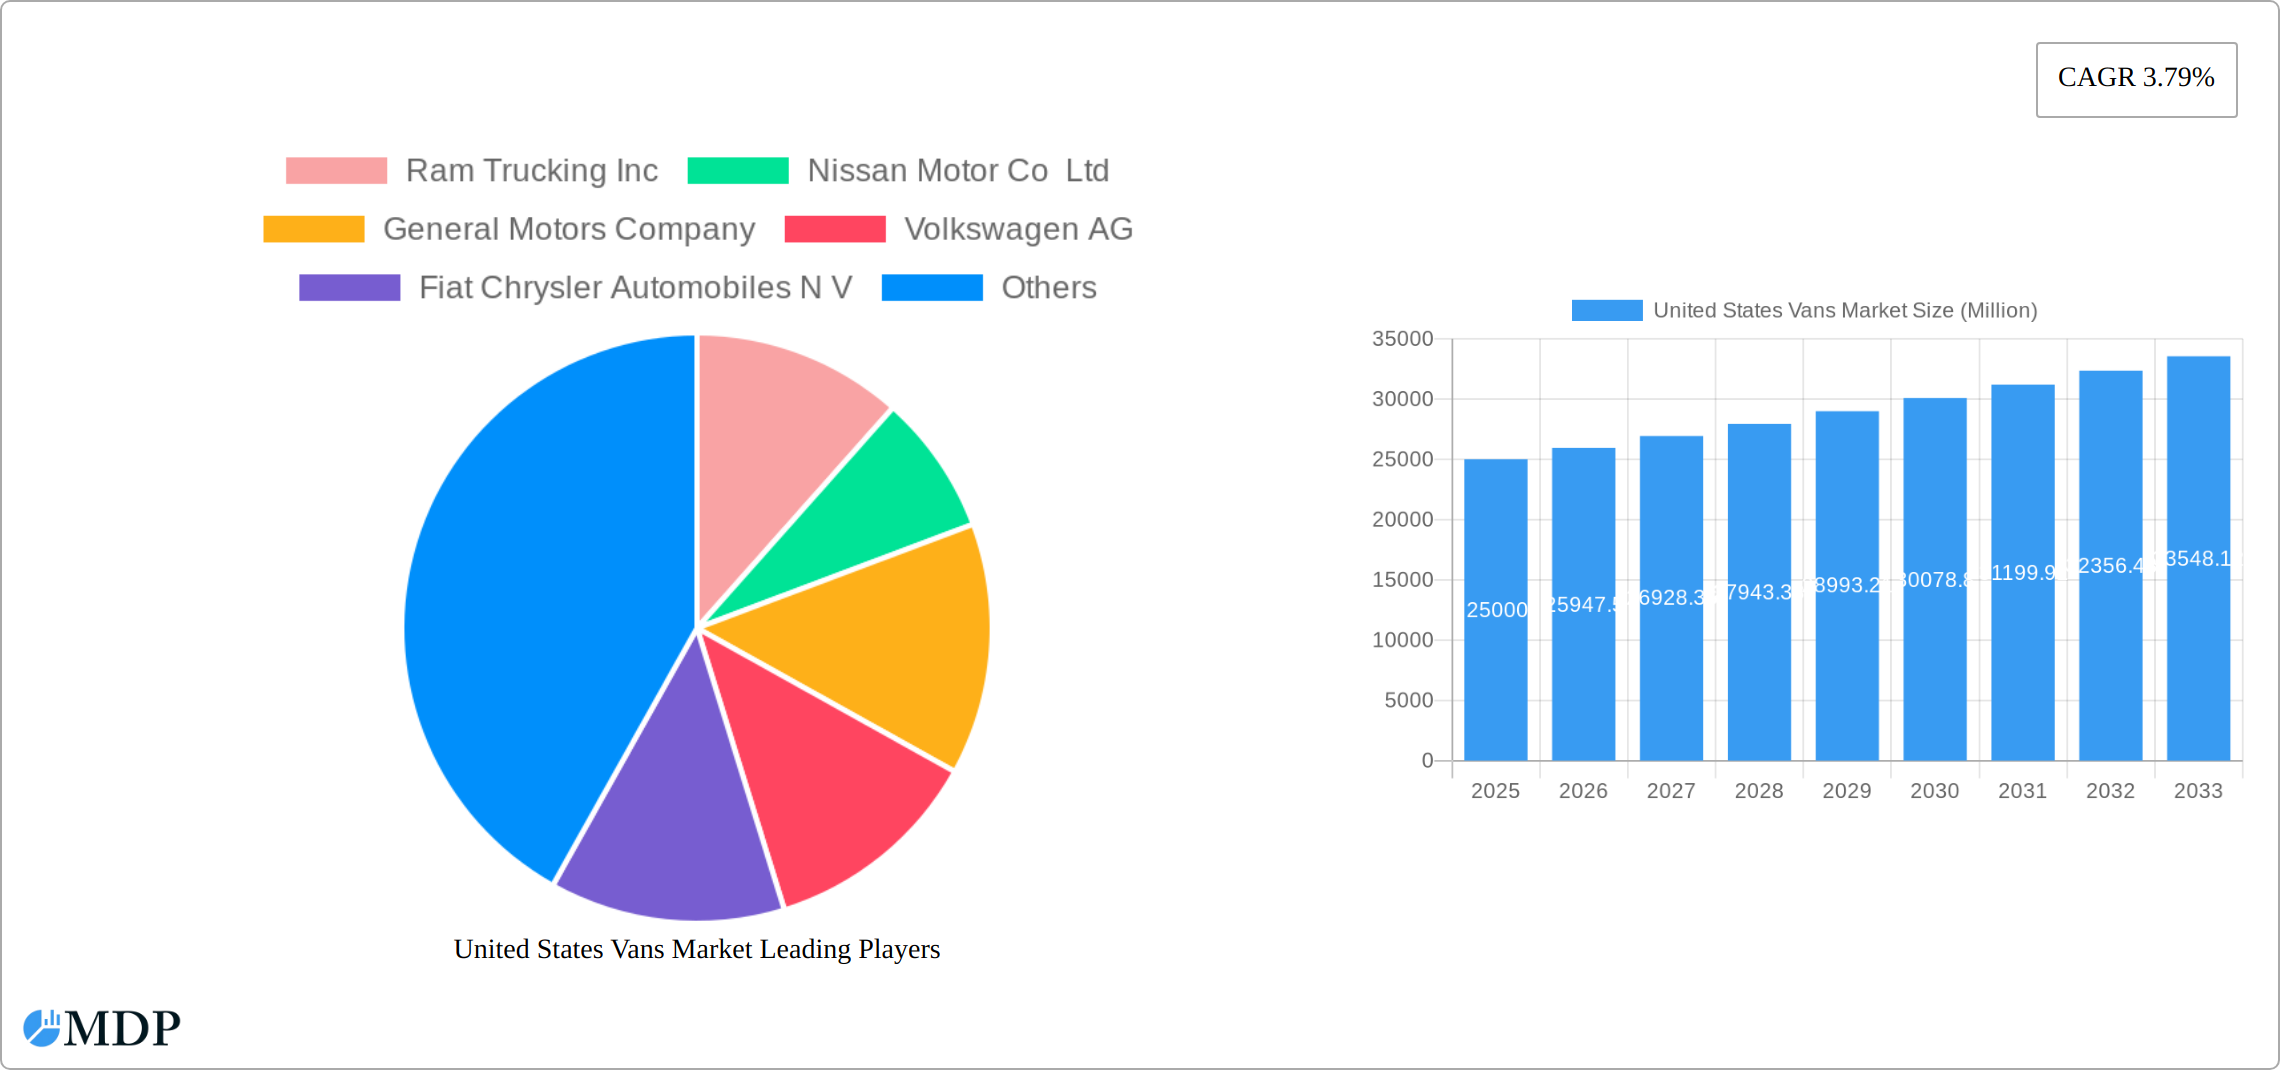
United States Vans Market Company Market Share
United States Vans Market: Growth, Trends, and Forecast (2025-2033)
This comprehensive report analyzes the United States vans market, detailing dynamics, industry trends, key players, and future growth opportunities. Spanning a forecast period of 2025-2033, with a base year of 2025, this report offers critical insights for stakeholders, investors, and businesses navigating this evolving market. Analysis incorporates historical data from 2019-2024 and market performance projections through 2033.
United States Vans Market Market Dynamics & Concentration
The United States vans market is characterized by a dynamic and evolving landscape, featuring a moderately concentrated structure with prominent established players and emerging innovators. Key factors shaping market concentration include significant economies of scale enjoyed by larger manufacturers, strong brand loyalty and recognition, and the continuous pursuit of technological advancements. A primary catalyst for growth is innovation, particularly the rapid integration and development of electric and hybrid powertrains. Stringent environmental regulations, designed to curb emissions, are a pivotal influence on product development strategies, compelling manufacturers to prioritize cleaner, more fuel-efficient, and sustainable vehicle solutions. The market also contends with the influence of substitute products, such as robust light-duty trucks and highly specialized cargo vehicles, which cater to specific operational needs and vie for market share accordingly. End-user trends are a critical determinant, with a pronounced demand for enhanced cargo capacity and superior fuel efficiency driving significant adaptations in product design and specifications. Over the past five years, the sector has witnessed a strategic pace of mergers and acquisitions (M&A), with approximately **[Insert Number]** key deals recorded. These transactions have largely focused on consolidating existing market share, expanding technological capabilities, and accelerating the adoption of next-generation powertrains. Detailed market share data for leading manufacturers, alongside in-depth analysis of these dynamics, is comprehensively presented within this report.
- Market Share: Ford Motor Company is projected to hold an estimated **[Insert Percentage]%** market share in 2025, closely followed by General Motors Company (**[Insert Percentage]%**) and Stellantis (**[Insert Percentage]%**). Other significant contributors to the market include Nissan Motor Co Ltd, Volkswagen AG, and Daimler AG.
- M&A Activity: An average of **[Insert Number]** M&A deals per year have been recorded between 2019 and 2024, underscoring ongoing consolidation and strategic alignment within the industry.
United States Vans Market Industry Trends & Analysis
The US vans market is experiencing robust growth, driven by rising e-commerce activity, a surge in last-mile delivery services, and increased construction activity. The Compound Annual Growth Rate (CAGR) from 2025 to 2033 is projected to be xx%. Technological advancements, specifically in electrification and autonomous driving capabilities, are disrupting the market, creating new opportunities and challenges. Consumer preferences are shifting toward fuel-efficient, technologically advanced vans with increased safety features. Competitive dynamics are intense, with established players vying for market share through product innovation, strategic partnerships, and aggressive marketing campaigns. Market penetration of electric vans is expected to reach xx% by 2033, fueled by government incentives and environmental awareness. The report provides an in-depth analysis of these trends, and their impact on market dynamics including detailed forecasting of market segments.
Leading Markets & Segments in United States Vans Market
The dominant segment within the US vans market remains the gasoline-powered van sector, which commanded approximately **[Insert Percentage]%** of the market share in 2025. However, the hybrid and electric vehicle (HEV/EV) segment is experiencing accelerated growth, propelled by advancements in battery technology, increasing consumer environmental consciousness, and supportive policy frameworks. California emerges as a vanguard market for HEV/EV vans, largely attributed to its aggressive emission reduction targets, robust government incentives, and a proactive stance on promoting electric mobility initiatives.
- Key Drivers of Gasoline Van Dominance: Widespread and established refueling infrastructure, a generally lower initial vehicle acquisition cost, and broader vehicle availability continue to underpin the dominance of gasoline-powered vans.
- Key Drivers of HEV/EV Van Growth: Government incentives, escalating fuel prices, significant improvements in battery longevity and charging speeds, and evolving environmental regulations are key enablers for the burgeoning HEV/EV van segment.
While the gasoline-powered segment currently leads, its market share is anticipated to gradually decrease as advancements in battery technology continue and the total cost of ownership for EV vans becomes increasingly competitive.
United States Vans Market Product Developments
Recent product developments in the US vans market are largely focused on enhancing fuel efficiency, integrating advanced driver-assistance systems (ADAS), and improving cargo capacity. The integration of telematics and connectivity features is gaining traction, enabling real-time vehicle monitoring and fleet management optimization. Manufacturers are actively pursuing lightweight materials and aerodynamic designs to further boost fuel economy. The market is witnessing a significant shift towards electric and hybrid powertrains, reflecting growing environmental concerns and government regulations.
Key Drivers of United States Vans Market Growth
Several factors are contributing to the growth of the US vans market. Firstly, the booming e-commerce sector necessitates efficient last-mile delivery solutions. Secondly, the construction industry’s expansion drives demand for robust cargo vans. Thirdly, government incentives and regulations promoting fuel efficiency and electric mobility are accelerating the adoption of environmentally friendly vans. Finally, technological advancements lead to improved vehicle performance and safety features.
Challenges in the United States Vans Market Market
The US vans market faces challenges including supply chain disruptions which can lead to increased production costs and delays, and fluctuating fuel prices. The increasing cost of raw materials including semiconductor chips, battery components, and steel, directly impacts production costs. Intense competition among established players further presents a challenge.
Emerging Opportunities in United States Vans Market
The integration of autonomous driving technology presents a significant opportunity for growth. Furthermore, the increasing adoption of telematics and connectivity features offers opportunities for data-driven optimization of fleet management. The expansion of the electric vehicle infrastructure and development of charging networks will fuel the growth of electric vans in the coming years. Strategic partnerships between manufacturers and logistics companies can further accelerate the market's growth.
Leading Players in the United States Vans Market Sector
- Ford Motor Company
- General Motors Company
- Stellantis (Fiat Chrysler Automobiles N V)
- Daimler AG (Mercedes-Benz AG)
- Volkswagen AG
- Nissan Motor Co Ltd
- Ram Trucking Inc
- Workhorse Group Inc
- IVECO S p A
- GM Motor (Chevrolet)
Key Milestones in United States Vans Market Industry
- June 2023: FORD NEXT introduced a pioneering pilot program offering flexible electric vehicle leasing options tailored for Uber drivers in select U.S. metropolitan areas. This strategic initiative is instrumental in accelerating the adoption of electric vehicles within the burgeoning ride-sharing economy.
- June 2023: Stellantis fulfilled a substantial order of 12,500 Ram ProMaster EV units to Merchants Fleet, a significant transaction that highlights the escalating demand for electric commercial van solutions.
- June 2023: Mercedes-Benz announced the expanded availability of its advanced DRIVE PILOT Level 3 autonomous driving system in California, marking a critical advancement in autonomous vehicle technology and its practical application within the U.S. automotive market.
Strategic Outlook for United States Vans Market Market
The United States vans market is on a trajectory for sustained and robust growth, underpinned by continuous technological innovation, a dynamic shift in consumer preferences towards sustainable options, and supportive government policies aimed at promoting eco-friendly transportation. Strategic alliances, substantial investments in research and development (R&D), and proactive expansion into new and niche market segments will be paramount for achieving competitive advantage and long-term success. The increasing integration and adoption of electric and autonomous vehicle technologies are set to profoundly reshape the market's trajectory in the coming years. The future prosperity of this market will largely depend on the development of groundbreaking solutions that not only meet the evolving needs of diverse customer bases but also consistently adhere to and anticipate increasingly stringent environmental regulations.
United States Vans Market Segmentation
-
1. Propulsion Type
-
1.1. Hybrid and Electric Vehicles
-
1.1.1. By Fuel Category
- 1.1.1.1. BEV
- 1.1.1.2. HEV
-
1.1.1. By Fuel Category
-
1.2. ICE
- 1.2.1. Diesel
- 1.2.2. Gasoline
-
1.1. Hybrid and Electric Vehicles
United States Vans Market Segmentation By Geography
- 1. United States
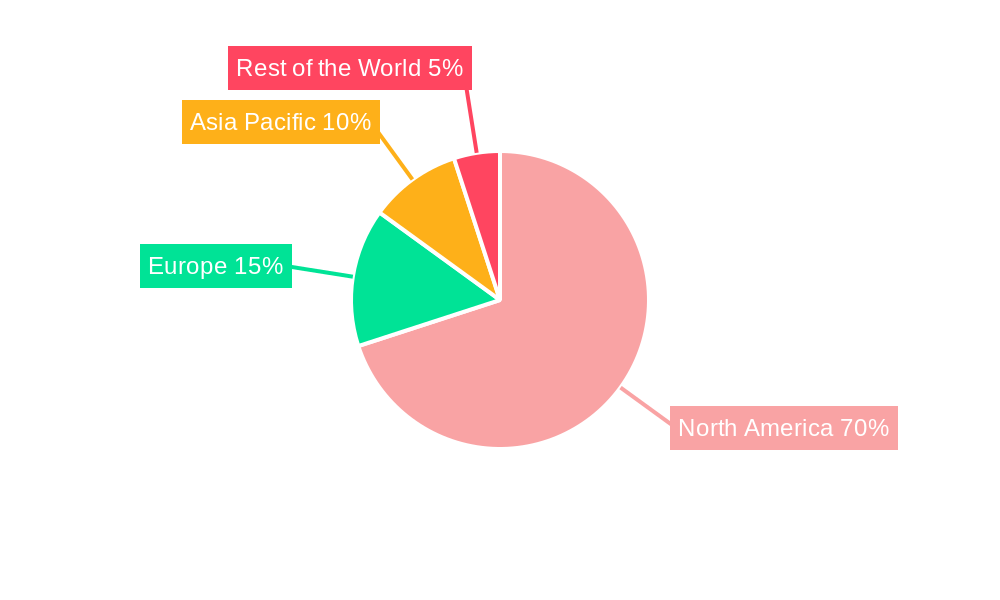
United States Vans Market Regional Market Share
Geographic Coverage of United States Vans Market
United States Vans Market REPORT HIGHLIGHTS
| Aspects | Details |
|---|---|
| Study Period | 2020-2034 |
| Base Year | 2025 |
| Estimated Year | 2026 |
| Forecast Period | 2026-2034 |
| Historical Period | 2020-2025 |
| Growth Rate | CAGR of 5.73% from 2020-2034 |
| Segmentation |
|
Table of Contents
- 1. Introduction
- 1.1. Research Scope
- 1.2. Market Segmentation
- 1.3. Research Methodology
- 1.4. Definitions and Assumptions
- 2. Executive Summary
- 2.1. Introduction
- 3. Market Dynamics
- 3.1. Introduction
- 3.2. Market Drivers
- 3.2.1. Rising Demand for Small Boats; Expanding Recreational Boating Opportunities
- 3.3. Market Restrains
- 3.3.1. Strict Emission Norms for Recreation Boats Likely to Have Negative Impact
- 3.4. Market Trends
- 3.4.1. OTHER KEY INDUSTRY TRENDS COVERED IN THE REPORT
- 4. Market Factor Analysis
- 4.1. Porters Five Forces
- 4.2. Supply/Value Chain
- 4.3. PESTEL analysis
- 4.4. Market Entropy
- 4.5. Patent/Trademark Analysis
- 5. United States Vans Market Analysis, Insights and Forecast, 2020-2032
- 5.1. Market Analysis, Insights and Forecast - by Propulsion Type
- 5.1.1. Hybrid and Electric Vehicles
- 5.1.1.1. By Fuel Category
- 5.1.1.1.1. BEV
- 5.1.1.1.2. HEV
- 5.1.1.1. By Fuel Category
- 5.1.2. ICE
- 5.1.2.1. Diesel
- 5.1.2.2. Gasoline
- 5.1.1. Hybrid and Electric Vehicles
- 5.2. Market Analysis, Insights and Forecast - by Region
- 5.2.1. United States
- 5.1. Market Analysis, Insights and Forecast - by Propulsion Type
- 6. Competitive Analysis
- 6.1. Market Share Analysis 2025
- 6.2. Company Profiles
- 6.2.1 Ram Trucking Inc
- 6.2.1.1. Overview
- 6.2.1.2. Products
- 6.2.1.3. SWOT Analysis
- 6.2.1.4. Recent Developments
- 6.2.1.5. Financials (Based on Availability)
- 6.2.2 Nissan Motor Co Ltd
- 6.2.2.1. Overview
- 6.2.2.2. Products
- 6.2.2.3. SWOT Analysis
- 6.2.2.4. Recent Developments
- 6.2.2.5. Financials (Based on Availability)
- 6.2.3 General Motors Company
- 6.2.3.1. Overview
- 6.2.3.2. Products
- 6.2.3.3. SWOT Analysis
- 6.2.3.4. Recent Developments
- 6.2.3.5. Financials (Based on Availability)
- 6.2.4 Volkswagen AG
- 6.2.4.1. Overview
- 6.2.4.2. Products
- 6.2.4.3. SWOT Analysis
- 6.2.4.4. Recent Developments
- 6.2.4.5. Financials (Based on Availability)
- 6.2.5 Fiat Chrysler Automobiles N V
- 6.2.5.1. Overview
- 6.2.5.2. Products
- 6.2.5.3. SWOT Analysis
- 6.2.5.4. Recent Developments
- 6.2.5.5. Financials (Based on Availability)
- 6.2.6 Daimler AG (Mercedes-Benz AG)
- 6.2.6.1. Overview
- 6.2.6.2. Products
- 6.2.6.3. SWOT Analysis
- 6.2.6.4. Recent Developments
- 6.2.6.5. Financials (Based on Availability)
- 6.2.7 Workhorse Group Inc
- 6.2.7.1. Overview
- 6.2.7.2. Products
- 6.2.7.3. SWOT Analysis
- 6.2.7.4. Recent Developments
- 6.2.7.5. Financials (Based on Availability)
- 6.2.8 IVECO S p A
- 6.2.8.1. Overview
- 6.2.8.2. Products
- 6.2.8.3. SWOT Analysis
- 6.2.8.4. Recent Developments
- 6.2.8.5. Financials (Based on Availability)
- 6.2.9 GM Motor (Chevrolet)
- 6.2.9.1. Overview
- 6.2.9.2. Products
- 6.2.9.3. SWOT Analysis
- 6.2.9.4. Recent Developments
- 6.2.9.5. Financials (Based on Availability)
- 6.2.10 Ford Motor Company
- 6.2.10.1. Overview
- 6.2.10.2. Products
- 6.2.10.3. SWOT Analysis
- 6.2.10.4. Recent Developments
- 6.2.10.5. Financials (Based on Availability)
- 6.2.1 Ram Trucking Inc
List of Figures
- Figure 1: United States Vans Market Revenue Breakdown (billion, %) by Product 2025 & 2033
- Figure 2: United States Vans Market Share (%) by Company 2025
List of Tables
- Table 1: United States Vans Market Revenue billion Forecast, by Propulsion Type 2020 & 2033
- Table 2: United States Vans Market Revenue billion Forecast, by Region 2020 & 2033
- Table 3: United States Vans Market Revenue billion Forecast, by Propulsion Type 2020 & 2033
- Table 4: United States Vans Market Revenue billion Forecast, by Country 2020 & 2033
Frequently Asked Questions
1. What is the projected Compound Annual Growth Rate (CAGR) of the United States Vans Market?
The projected CAGR is approximately 5.73%.
2. Which companies are prominent players in the United States Vans Market?
Key companies in the market include Ram Trucking Inc, Nissan Motor Co Ltd, General Motors Company, Volkswagen AG, Fiat Chrysler Automobiles N V, Daimler AG (Mercedes-Benz AG), Workhorse Group Inc, IVECO S p A, GM Motor (Chevrolet), Ford Motor Company.
3. What are the main segments of the United States Vans Market?
The market segments include Propulsion Type.
4. Can you provide details about the market size?
The market size is estimated to be USD 11.79 billion as of 2022.
5. What are some drivers contributing to market growth?
Rising Demand for Small Boats; Expanding Recreational Boating Opportunities.
6. What are the notable trends driving market growth?
OTHER KEY INDUSTRY TRENDS COVERED IN THE REPORT.
7. Are there any restraints impacting market growth?
Strict Emission Norms for Recreation Boats Likely to Have Negative Impact.
8. Can you provide examples of recent developments in the market?
June 2023: FORD NEXT launches New pilot program creates flexible electric solutions for drivers who use the Uber platform in select U.S. markets, allowing them to lease a vehicle for more customized time periods.June 2023: Stellantis adds Merchants Fleet as latest Ram ProMaster EV commercial customer and that agreement calls for 12,500 Ram ProMaster EV units over the next several years.June 2023: Mercedes-Benz DRIVE PILOT expands U.S. availability to California and introduce a SAE Level 3 system in a standard-production vehicle for use on public freeways in the most populous state in the U.S.
9. What pricing options are available for accessing the report?
Pricing options include single-user, multi-user, and enterprise licenses priced at USD 3800, USD 4500, and USD 5800 respectively.
10. Is the market size provided in terms of value or volume?
The market size is provided in terms of value, measured in billion.
11. Are there any specific market keywords associated with the report?
Yes, the market keyword associated with the report is "United States Vans Market," which aids in identifying and referencing the specific market segment covered.
12. How do I determine which pricing option suits my needs best?
The pricing options vary based on user requirements and access needs. Individual users may opt for single-user licenses, while businesses requiring broader access may choose multi-user or enterprise licenses for cost-effective access to the report.
13. Are there any additional resources or data provided in the United States Vans Market report?
While the report offers comprehensive insights, it's advisable to review the specific contents or supplementary materials provided to ascertain if additional resources or data are available.
14. How can I stay updated on further developments or reports in the United States Vans Market?
To stay informed about further developments, trends, and reports in the United States Vans Market, consider subscribing to industry newsletters, following relevant companies and organizations, or regularly checking reputable industry news sources and publications.
Methodology
Step 1 - Identification of Relevant Samples Size from Population Database


Step 2 - Approaches for Defining Global Market Size (Value, Volume* & Price*)

Note*: In applicable scenarios
Step 3 - Data Sources
Primary Research
- Web Analytics
- Survey Reports
- Research Institute
- Latest Research Reports
- Opinion Leaders
Secondary Research
- Annual Reports
- White Paper
- Latest Press Release
- Industry Association
- Paid Database
- Investor Presentations

Step 4 - Data Triangulation
Involves using different sources of information in order to increase the validity of a study
These sources are likely to be stakeholders in a program - participants, other researchers, program staff, other community members, and so on.
Then we put all data in single framework & apply various statistical tools to find out the dynamic on the market.
During the analysis stage, feedback from the stakeholder groups would be compared to determine areas of agreement as well as areas of divergence