

Key Insights
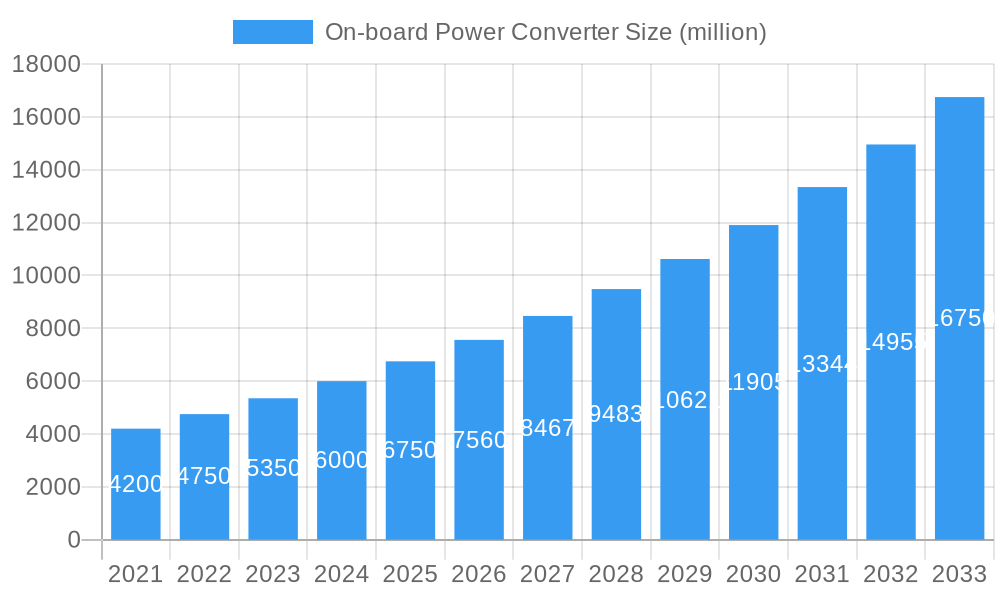
The Global On-board Power Converter market is projected for substantial growth, estimated to reach $20.65 billion by 2033, driven by a Compound Annual Growth Rate (CAGR) of 7.1% from the 2024 base year. This expansion is largely attributed to the increasing electrification of vehicles and the subsequent demand for efficient power solutions in the automotive sector. The rising production of passenger cars and the growing integration of advanced electronic systems in commercial vehicles necessitate advanced on-board power management. Key growth catalysts include the widespread adoption of in-vehicle infotainment, Advanced Driver-Assistance Systems (ADAS), and the need for reliable power for auxiliary systems.
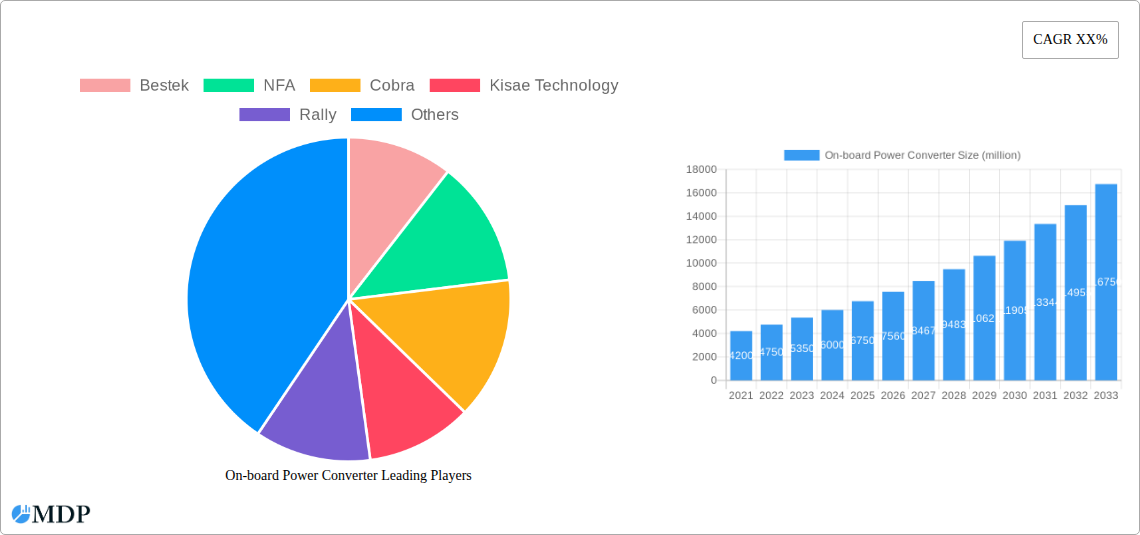
On-board Power Converter Market Size (In Billion)
Emerging trends, such as the adoption of higher voltage systems (48V and above) for electric and hybrid vehicles, are opening new market avenues. Innovations in power conversion efficiency and device miniaturization are also key market shapers. Potential restraints include the cost of advanced power converter technologies and strict regulatory compliance for electromagnetic interference and safety. Despite these challenges, significant market growth is anticipated, with Asia Pacific expected to dominate due to its robust automotive manufacturing and rising EV penetration, followed by North America and Europe's strong electrification initiatives.
On-board Power Converter Company Market Share
On-board Power Converter Market: Comprehensive Analysis and Future Outlook (2019-2033)
This in-depth report provides a thorough analysis of the global On-board Power Converter market, encompassing historical trends, current dynamics, and future projections. Covering the study period from 2019 to 2033, with a base year of 2025 and a forecast period extending from 2025 to 2033, this report is essential for industry stakeholders seeking to understand market concentration, innovation drivers, regulatory frameworks, product substitutes, end-user trends, and M&A activities. It delves into industry trends, leading markets, product developments, key growth drivers, challenges, emerging opportunities, key players, significant milestones, and a strategic outlook. The analysis meticulously examines application segments such as Passenger Cars and Commercial Vehicles, alongside voltage types including 12V, 24V, 48V and Above. This report is designed to offer actionable insights for businesses operating in or looking to enter the burgeoning on-board power converter sector.
On-board Power Converter Market Dynamics & Concentration
The global On-board Power Converter market exhibits a moderate to high concentration, with a significant market share held by a few dominant players, while a substantial number of smaller manufacturers contribute to the competitive landscape. Innovation drivers are primarily fueled by the escalating demand for electrification in automotive applications, including passenger cars and commercial vehicles, and the continuous pursuit of higher efficiency and power density. Regulatory frameworks, such as stringent emission standards and evolving electrical safety mandates, are shaping product development and market entry strategies. Product substitutes, while existing in the form of external power sources or simpler voltage regulators, are increasingly being outpaced by the integrated functionality and space-saving advantages of on-board power converters. End-user trends indicate a strong preference for compact, lightweight, and intelligent power conversion solutions that enhance vehicle performance and reliability. Mergers and acquisitions (M&A) activities are moderately prevalent, driven by the strategic imperative to expand product portfolios, gain market access, and acquire advanced technological capabilities. Anticipated M&A deal counts for the forecast period are expected to reach approximately 15-20 deals annually, with an average deal value projected to be in the range of tens of millions to hundreds of millions of dollars.
On-board Power Converter Industry Trends & Analysis
The On-board Power Converter industry is experiencing robust growth, primarily driven by the rapid advancements and adoption of electric and hybrid electric vehicles (EV/HEVs). The increasing integration of sophisticated electronic systems within vehicles, from advanced driver-assistance systems (ADAS) to infotainment and connectivity features, necessitates efficient and reliable on-board power conversion. Technological disruptions, such as the widespread implementation of wide-bandgap semiconductors like Silicon Carbide (SiC) and Gallium Nitride (GaN), are enabling the development of smaller, lighter, and more efficient power converters with enhanced thermal management capabilities. These innovations are crucial for meeting the stringent weight and space constraints in modern vehicle designs. Consumer preferences are increasingly leaning towards vehicles that offer extended range, faster charging capabilities, and a seamless integration of digital technologies, all of which are indirectly influenced by the performance and efficiency of on-board power converters. The competitive dynamics are characterized by intense innovation, with companies vying for market leadership through product differentiation, cost optimization, and strategic partnerships. The Compound Annual Growth Rate (CAGR) for the on-board power converter market is projected to be approximately 12.5% over the forecast period. Market penetration in the passenger car segment is estimated to reach over 85% by the end of the forecast period, while the commercial vehicle segment is expected to see a penetration rate exceeding 70%. The overall market size is anticipated to surpass $15 billion by 2033.
Leading Markets & Segments in On-board Power Converter
The Asia-Pacific region is currently the dominant market for on-board power converters, driven by the sheer volume of vehicle production, particularly in countries like China, Japan, and South Korea. Within this region, China stands out as the largest individual market, propelled by government initiatives supporting the growth of the EV sector and substantial domestic demand for passenger cars. The dominant application segment is Passenger Cars, where the increasing adoption of mild-hybrid, hybrid, and fully electric powertrains directly fuels the demand for sophisticated on-board power conversion systems. Key drivers for this dominance include favorable government incentives for EV adoption, aggressive infrastructure development for charging stations, and a growing consumer awareness regarding the environmental benefits and lower running costs of electric vehicles.
In terms of voltage types, 12V systems continue to hold a significant share due to their widespread use in traditional internal combustion engine vehicles and as a foundational voltage for many auxiliary systems even in EVs. However, the 48V and Above segment is experiencing the most rapid growth, driven by the development of 48V mild-hybrid systems, which offer a balance between performance enhancement and fuel efficiency, and the higher voltage requirements of fully electric powertrains. Key drivers for the growth of higher voltage systems include the need for improved energy management, the ability to power more demanding onboard electronics, and the integration of advanced battery technologies. Economic policies in major automotive manufacturing nations, such as subsidies for electric vehicle purchases and tax incentives for R&D in automotive electronics, are critical in shaping the market landscape. Infrastructure development, particularly the expansion of charging networks and the modernization of automotive manufacturing facilities, further supports the demand for advanced on-board power converters.
On-board Power Converter Product Developments
Product developments in the on-board power converter market are intensely focused on enhancing power density, improving efficiency, and miniaturizing components. Innovations include the integration of GaN and SiC semiconductors, leading to smaller form factors and better thermal performance, crucial for space-constrained automotive applications. Advanced control algorithms are being developed for intelligent power management, optimizing energy flow to various vehicle systems. Competitive advantages are being carved out through enhanced reliability, extended operational lifespans, and seamless integration with vehicle architectures, catering to the evolving needs of passenger cars and commercial vehicles.
Key Drivers of On-board Power Converter Growth
The growth of the on-board power converter market is propelled by several key factors. The escalating global demand for electric and hybrid vehicles is a primary driver, necessitating efficient and robust power conversion solutions. Stringent government regulations and emission standards are compelling automotive manufacturers to adopt cleaner technologies, thereby increasing the reliance on on-board power converters. Technological advancements, particularly in semiconductor technology (SiC and GaN), are enabling higher efficiency, reduced size, and improved thermal management, making these converters more attractive. Economic factors, such as falling battery costs and increasing consumer acceptance of EVs, also contribute significantly to market expansion.
Challenges in the On-board Power Converter Market
Despite the promising growth trajectory, the on-board power converter market faces several challenges. Regulatory hurdles, including evolving safety standards and certification processes for automotive electronics, can slow down product development and market entry. Supply chain disruptions, particularly for critical raw materials and electronic components, can impact production volumes and lead times, with an estimated impact of 10-15% on production capacity during periods of severe disruption. Intense competition can lead to price pressures, affecting profit margins. Furthermore, the high upfront investment required for research and development in advanced power electronics can be a barrier for smaller manufacturers.
Emerging Opportunities in On-board Power Converter
Emerging opportunities in the on-board power converter market are driven by the continuous evolution of automotive technology and a growing focus on sustainability. The expansion of vehicle electrification beyond passenger cars into heavy-duty commercial vehicles and specialized utility vehicles presents significant growth avenues. Technological breakthroughs in solid-state transformers and advanced bidirectional power flow capabilities are opening new possibilities for more integrated and efficient vehicle electrical architectures. Strategic partnerships between power electronics manufacturers and automotive OEMs are crucial for co-developing next-generation power conversion systems tailored to specific vehicle platforms. Market expansion strategies into developing economies with increasing automotive production and growing interest in EVs also represent significant opportunities.
Leading Players in the On-board Power Converter Sector
- Bestek
- NFA
- Cobra
- Kisae Technology
- Rally
- Energizer
- Duracell
- Meind
- Stanley
- Exeltech
- Cotek
- Samlex
- Power Bright
- Go Power
- Wagan Tech
- Magnum Energy
- WEHO
- Erayak
Key Milestones in On-board Power Converter Industry
- 2019: Increased adoption of 48V mild-hybrid systems in mainstream passenger cars.
- 2020: Significant advancements in GaN technology leading to smaller and more efficient DC-DC converters for automotive applications.
- 2021: Major automotive OEMs announce aggressive electrification roadmaps, boosting demand for on-board power converters.
- 2022: Growing integration of intelligent power management features and software-defined functionalities in on-board power converters.
- 2023: Introduction of new standards for thermal management and cybersecurity in automotive power electronics.
- 2024: Enhanced focus on SiC-based power converters for higher voltage applications in commercial EVs.
Strategic Outlook for On-board Power Converter Market
The strategic outlook for the on-board power converter market remains exceptionally positive, driven by the unstoppable momentum of vehicle electrification and the increasing complexity of automotive electrical systems. Future growth accelerators will be rooted in the continued adoption of advanced semiconductor technologies, the development of integrated power modules that combine multiple conversion functions, and the expansion of connectivity features that demand robust and efficient power delivery. Companies that focus on innovation, strategic collaborations with automotive manufacturers, and expanding their product portfolios to cater to emerging vehicle types and charging infrastructures will be best positioned for sustained success in this dynamic market. The forecast anticipates a market value exceeding $20 billion by the end of 2033.
On-board Power Converter Segmentation
-
1. Application
- 1.1. Passenger Cars
- 1.2. Commercial Vehicles
-
2. Types
- 2.1. 12V
- 2.2. 24V
- 2.3. 48V and Above
On-board Power Converter Segmentation By Geography
-
1. North America
- 1.1. United States
- 1.2. Canada
- 1.3. Mexico
-
2. South America
- 2.1. Brazil
- 2.2. Argentina
- 2.3. Rest of South America
-
3. Europe
- 3.1. United Kingdom
- 3.2. Germany
- 3.3. France
- 3.4. Italy
- 3.5. Spain
- 3.6. Russia
- 3.7. Benelux
- 3.8. Nordics
- 3.9. Rest of Europe
-
4. Middle East & Africa
- 4.1. Turkey
- 4.2. Israel
- 4.3. GCC
- 4.4. North Africa
- 4.5. South Africa
- 4.6. Rest of Middle East & Africa
-
5. Asia Pacific
- 5.1. China
- 5.2. India
- 5.3. Japan
- 5.4. South Korea
- 5.5. ASEAN
- 5.6. Oceania
- 5.7. Rest of Asia Pacific
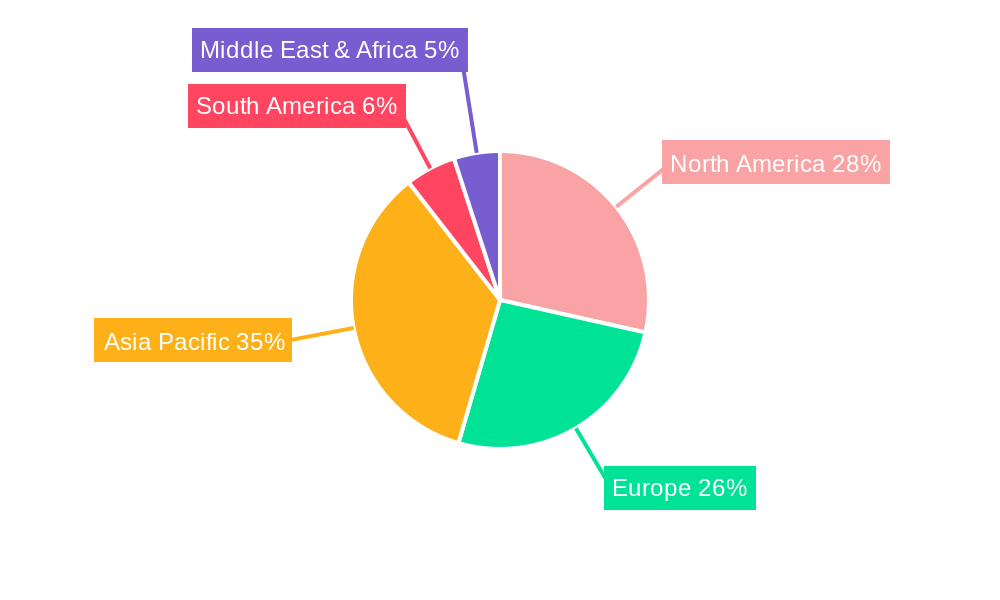
On-board Power Converter Regional Market Share
Geographic Coverage of On-board Power Converter
On-board Power Converter REPORT HIGHLIGHTS
| Aspects | Details |
|---|---|
| Study Period | 2020-2034 |
| Base Year | 2025 |
| Estimated Year | 2026 |
| Forecast Period | 2026-2034 |
| Historical Period | 2020-2025 |
| Growth Rate | CAGR of 7.1% from 2020-2034 |
| Segmentation |
|
Table of Contents
- 1. Introduction
- 1.1. Research Scope
- 1.2. Market Segmentation
- 1.3. Research Methodology
- 1.4. Definitions and Assumptions
- 2. Executive Summary
- 2.1. Introduction
- 3. Market Dynamics
- 3.1. Introduction
- 3.2. Market Drivers
- 3.3. Market Restrains
- 3.4. Market Trends
- 4. Market Factor Analysis
- 4.1. Porters Five Forces
- 4.2. Supply/Value Chain
- 4.3. PESTEL analysis
- 4.4. Market Entropy
- 4.5. Patent/Trademark Analysis
- 5. Global On-board Power Converter Analysis, Insights and Forecast, 2020-2032
- 5.1. Market Analysis, Insights and Forecast - by Application
- 5.1.1. Passenger Cars
- 5.1.2. Commercial Vehicles
- 5.2. Market Analysis, Insights and Forecast - by Types
- 5.2.1. 12V
- 5.2.2. 24V
- 5.2.3. 48V and Above
- 5.3. Market Analysis, Insights and Forecast - by Region
- 5.3.1. North America
- 5.3.2. South America
- 5.3.3. Europe
- 5.3.4. Middle East & Africa
- 5.3.5. Asia Pacific
- 5.1. Market Analysis, Insights and Forecast - by Application
- 6. North America On-board Power Converter Analysis, Insights and Forecast, 2020-2032
- 6.1. Market Analysis, Insights and Forecast - by Application
- 6.1.1. Passenger Cars
- 6.1.2. Commercial Vehicles
- 6.2. Market Analysis, Insights and Forecast - by Types
- 6.2.1. 12V
- 6.2.2. 24V
- 6.2.3. 48V and Above
- 6.1. Market Analysis, Insights and Forecast - by Application
- 7. South America On-board Power Converter Analysis, Insights and Forecast, 2020-2032
- 7.1. Market Analysis, Insights and Forecast - by Application
- 7.1.1. Passenger Cars
- 7.1.2. Commercial Vehicles
- 7.2. Market Analysis, Insights and Forecast - by Types
- 7.2.1. 12V
- 7.2.2. 24V
- 7.2.3. 48V and Above
- 7.1. Market Analysis, Insights and Forecast - by Application
- 8. Europe On-board Power Converter Analysis, Insights and Forecast, 2020-2032
- 8.1. Market Analysis, Insights and Forecast - by Application
- 8.1.1. Passenger Cars
- 8.1.2. Commercial Vehicles
- 8.2. Market Analysis, Insights and Forecast - by Types
- 8.2.1. 12V
- 8.2.2. 24V
- 8.2.3. 48V and Above
- 8.1. Market Analysis, Insights and Forecast - by Application
- 9. Middle East & Africa On-board Power Converter Analysis, Insights and Forecast, 2020-2032
- 9.1. Market Analysis, Insights and Forecast - by Application
- 9.1.1. Passenger Cars
- 9.1.2. Commercial Vehicles
- 9.2. Market Analysis, Insights and Forecast - by Types
- 9.2.1. 12V
- 9.2.2. 24V
- 9.2.3. 48V and Above
- 9.1. Market Analysis, Insights and Forecast - by Application
- 10. Asia Pacific On-board Power Converter Analysis, Insights and Forecast, 2020-2032
- 10.1. Market Analysis, Insights and Forecast - by Application
- 10.1.1. Passenger Cars
- 10.1.2. Commercial Vehicles
- 10.2. Market Analysis, Insights and Forecast - by Types
- 10.2.1. 12V
- 10.2.2. 24V
- 10.2.3. 48V and Above
- 10.1. Market Analysis, Insights and Forecast - by Application
- 11. Competitive Analysis
- 11.1. Global Market Share Analysis 2025
- 11.2. Company Profiles
- 11.2.1 Bestek
- 11.2.1.1. Overview
- 11.2.1.2. Products
- 11.2.1.3. SWOT Analysis
- 11.2.1.4. Recent Developments
- 11.2.1.5. Financials (Based on Availability)
- 11.2.2 NFA
- 11.2.2.1. Overview
- 11.2.2.2. Products
- 11.2.2.3. SWOT Analysis
- 11.2.2.4. Recent Developments
- 11.2.2.5. Financials (Based on Availability)
- 11.2.3 Cobra
- 11.2.3.1. Overview
- 11.2.3.2. Products
- 11.2.3.3. SWOT Analysis
- 11.2.3.4. Recent Developments
- 11.2.3.5. Financials (Based on Availability)
- 11.2.4 Kisae Technology
- 11.2.4.1. Overview
- 11.2.4.2. Products
- 11.2.4.3. SWOT Analysis
- 11.2.4.4. Recent Developments
- 11.2.4.5. Financials (Based on Availability)
- 11.2.5 Rally
- 11.2.5.1. Overview
- 11.2.5.2. Products
- 11.2.5.3. SWOT Analysis
- 11.2.5.4. Recent Developments
- 11.2.5.5. Financials (Based on Availability)
- 11.2.6 Energizer
- 11.2.6.1. Overview
- 11.2.6.2. Products
- 11.2.6.3. SWOT Analysis
- 11.2.6.4. Recent Developments
- 11.2.6.5. Financials (Based on Availability)
- 11.2.7 Duracell
- 11.2.7.1. Overview
- 11.2.7.2. Products
- 11.2.7.3. SWOT Analysis
- 11.2.7.4. Recent Developments
- 11.2.7.5. Financials (Based on Availability)
- 11.2.8 Meind
- 11.2.8.1. Overview
- 11.2.8.2. Products
- 11.2.8.3. SWOT Analysis
- 11.2.8.4. Recent Developments
- 11.2.8.5. Financials (Based on Availability)
- 11.2.9 Stanley
- 11.2.9.1. Overview
- 11.2.9.2. Products
- 11.2.9.3. SWOT Analysis
- 11.2.9.4. Recent Developments
- 11.2.9.5. Financials (Based on Availability)
- 11.2.10 Exeltech
- 11.2.10.1. Overview
- 11.2.10.2. Products
- 11.2.10.3. SWOT Analysis
- 11.2.10.4. Recent Developments
- 11.2.10.5. Financials (Based on Availability)
- 11.2.11 Cotek
- 11.2.11.1. Overview
- 11.2.11.2. Products
- 11.2.11.3. SWOT Analysis
- 11.2.11.4. Recent Developments
- 11.2.11.5. Financials (Based on Availability)
- 11.2.12 Samlex
- 11.2.12.1. Overview
- 11.2.12.2. Products
- 11.2.12.3. SWOT Analysis
- 11.2.12.4. Recent Developments
- 11.2.12.5. Financials (Based on Availability)
- 11.2.13 Power Bright
- 11.2.13.1. Overview
- 11.2.13.2. Products
- 11.2.13.3. SWOT Analysis
- 11.2.13.4. Recent Developments
- 11.2.13.5. Financials (Based on Availability)
- 11.2.14 Go Power
- 11.2.14.1. Overview
- 11.2.14.2. Products
- 11.2.14.3. SWOT Analysis
- 11.2.14.4. Recent Developments
- 11.2.14.5. Financials (Based on Availability)
- 11.2.15 Wagan Tech
- 11.2.15.1. Overview
- 11.2.15.2. Products
- 11.2.15.3. SWOT Analysis
- 11.2.15.4. Recent Developments
- 11.2.15.5. Financials (Based on Availability)
- 11.2.16 Magnum Energy
- 11.2.16.1. Overview
- 11.2.16.2. Products
- 11.2.16.3. SWOT Analysis
- 11.2.16.4. Recent Developments
- 11.2.16.5. Financials (Based on Availability)
- 11.2.17 WEHO
- 11.2.17.1. Overview
- 11.2.17.2. Products
- 11.2.17.3. SWOT Analysis
- 11.2.17.4. Recent Developments
- 11.2.17.5. Financials (Based on Availability)
- 11.2.18 Erayak
- 11.2.18.1. Overview
- 11.2.18.2. Products
- 11.2.18.3. SWOT Analysis
- 11.2.18.4. Recent Developments
- 11.2.18.5. Financials (Based on Availability)
- 11.2.1 Bestek
List of Figures
- Figure 1: Global On-board Power Converter Revenue Breakdown (billion, %) by Region 2025 & 2033
- Figure 2: North America On-board Power Converter Revenue (billion), by Application 2025 & 2033
- Figure 3: North America On-board Power Converter Revenue Share (%), by Application 2025 & 2033
- Figure 4: North America On-board Power Converter Revenue (billion), by Types 2025 & 2033
- Figure 5: North America On-board Power Converter Revenue Share (%), by Types 2025 & 2033
- Figure 6: North America On-board Power Converter Revenue (billion), by Country 2025 & 2033
- Figure 7: North America On-board Power Converter Revenue Share (%), by Country 2025 & 2033
- Figure 8: South America On-board Power Converter Revenue (billion), by Application 2025 & 2033
- Figure 9: South America On-board Power Converter Revenue Share (%), by Application 2025 & 2033
- Figure 10: South America On-board Power Converter Revenue (billion), by Types 2025 & 2033
- Figure 11: South America On-board Power Converter Revenue Share (%), by Types 2025 & 2033
- Figure 12: South America On-board Power Converter Revenue (billion), by Country 2025 & 2033
- Figure 13: South America On-board Power Converter Revenue Share (%), by Country 2025 & 2033
- Figure 14: Europe On-board Power Converter Revenue (billion), by Application 2025 & 2033
- Figure 15: Europe On-board Power Converter Revenue Share (%), by Application 2025 & 2033
- Figure 16: Europe On-board Power Converter Revenue (billion), by Types 2025 & 2033
- Figure 17: Europe On-board Power Converter Revenue Share (%), by Types 2025 & 2033
- Figure 18: Europe On-board Power Converter Revenue (billion), by Country 2025 & 2033
- Figure 19: Europe On-board Power Converter Revenue Share (%), by Country 2025 & 2033
- Figure 20: Middle East & Africa On-board Power Converter Revenue (billion), by Application 2025 & 2033
- Figure 21: Middle East & Africa On-board Power Converter Revenue Share (%), by Application 2025 & 2033
- Figure 22: Middle East & Africa On-board Power Converter Revenue (billion), by Types 2025 & 2033
- Figure 23: Middle East & Africa On-board Power Converter Revenue Share (%), by Types 2025 & 2033
- Figure 24: Middle East & Africa On-board Power Converter Revenue (billion), by Country 2025 & 2033
- Figure 25: Middle East & Africa On-board Power Converter Revenue Share (%), by Country 2025 & 2033
- Figure 26: Asia Pacific On-board Power Converter Revenue (billion), by Application 2025 & 2033
- Figure 27: Asia Pacific On-board Power Converter Revenue Share (%), by Application 2025 & 2033
- Figure 28: Asia Pacific On-board Power Converter Revenue (billion), by Types 2025 & 2033
- Figure 29: Asia Pacific On-board Power Converter Revenue Share (%), by Types 2025 & 2033
- Figure 30: Asia Pacific On-board Power Converter Revenue (billion), by Country 2025 & 2033
- Figure 31: Asia Pacific On-board Power Converter Revenue Share (%), by Country 2025 & 2033
List of Tables
- Table 1: Global On-board Power Converter Revenue billion Forecast, by Application 2020 & 2033
- Table 2: Global On-board Power Converter Revenue billion Forecast, by Types 2020 & 2033
- Table 3: Global On-board Power Converter Revenue billion Forecast, by Region 2020 & 2033
- Table 4: Global On-board Power Converter Revenue billion Forecast, by Application 2020 & 2033
- Table 5: Global On-board Power Converter Revenue billion Forecast, by Types 2020 & 2033
- Table 6: Global On-board Power Converter Revenue billion Forecast, by Country 2020 & 2033
- Table 7: United States On-board Power Converter Revenue (billion) Forecast, by Application 2020 & 2033
- Table 8: Canada On-board Power Converter Revenue (billion) Forecast, by Application 2020 & 2033
- Table 9: Mexico On-board Power Converter Revenue (billion) Forecast, by Application 2020 & 2033
- Table 10: Global On-board Power Converter Revenue billion Forecast, by Application 2020 & 2033
- Table 11: Global On-board Power Converter Revenue billion Forecast, by Types 2020 & 2033
- Table 12: Global On-board Power Converter Revenue billion Forecast, by Country 2020 & 2033
- Table 13: Brazil On-board Power Converter Revenue (billion) Forecast, by Application 2020 & 2033
- Table 14: Argentina On-board Power Converter Revenue (billion) Forecast, by Application 2020 & 2033
- Table 15: Rest of South America On-board Power Converter Revenue (billion) Forecast, by Application 2020 & 2033
- Table 16: Global On-board Power Converter Revenue billion Forecast, by Application 2020 & 2033
- Table 17: Global On-board Power Converter Revenue billion Forecast, by Types 2020 & 2033
- Table 18: Global On-board Power Converter Revenue billion Forecast, by Country 2020 & 2033
- Table 19: United Kingdom On-board Power Converter Revenue (billion) Forecast, by Application 2020 & 2033
- Table 20: Germany On-board Power Converter Revenue (billion) Forecast, by Application 2020 & 2033
- Table 21: France On-board Power Converter Revenue (billion) Forecast, by Application 2020 & 2033
- Table 22: Italy On-board Power Converter Revenue (billion) Forecast, by Application 2020 & 2033
- Table 23: Spain On-board Power Converter Revenue (billion) Forecast, by Application 2020 & 2033
- Table 24: Russia On-board Power Converter Revenue (billion) Forecast, by Application 2020 & 2033
- Table 25: Benelux On-board Power Converter Revenue (billion) Forecast, by Application 2020 & 2033
- Table 26: Nordics On-board Power Converter Revenue (billion) Forecast, by Application 2020 & 2033
- Table 27: Rest of Europe On-board Power Converter Revenue (billion) Forecast, by Application 2020 & 2033
- Table 28: Global On-board Power Converter Revenue billion Forecast, by Application 2020 & 2033
- Table 29: Global On-board Power Converter Revenue billion Forecast, by Types 2020 & 2033
- Table 30: Global On-board Power Converter Revenue billion Forecast, by Country 2020 & 2033
- Table 31: Turkey On-board Power Converter Revenue (billion) Forecast, by Application 2020 & 2033
- Table 32: Israel On-board Power Converter Revenue (billion) Forecast, by Application 2020 & 2033
- Table 33: GCC On-board Power Converter Revenue (billion) Forecast, by Application 2020 & 2033
- Table 34: North Africa On-board Power Converter Revenue (billion) Forecast, by Application 2020 & 2033
- Table 35: South Africa On-board Power Converter Revenue (billion) Forecast, by Application 2020 & 2033
- Table 36: Rest of Middle East & Africa On-board Power Converter Revenue (billion) Forecast, by Application 2020 & 2033
- Table 37: Global On-board Power Converter Revenue billion Forecast, by Application 2020 & 2033
- Table 38: Global On-board Power Converter Revenue billion Forecast, by Types 2020 & 2033
- Table 39: Global On-board Power Converter Revenue billion Forecast, by Country 2020 & 2033
- Table 40: China On-board Power Converter Revenue (billion) Forecast, by Application 2020 & 2033
- Table 41: India On-board Power Converter Revenue (billion) Forecast, by Application 2020 & 2033
- Table 42: Japan On-board Power Converter Revenue (billion) Forecast, by Application 2020 & 2033
- Table 43: South Korea On-board Power Converter Revenue (billion) Forecast, by Application 2020 & 2033
- Table 44: ASEAN On-board Power Converter Revenue (billion) Forecast, by Application 2020 & 2033
- Table 45: Oceania On-board Power Converter Revenue (billion) Forecast, by Application 2020 & 2033
- Table 46: Rest of Asia Pacific On-board Power Converter Revenue (billion) Forecast, by Application 2020 & 2033
Frequently Asked Questions
1. What is the projected Compound Annual Growth Rate (CAGR) of the On-board Power Converter?
The projected CAGR is approximately 7.1%.
2. Which companies are prominent players in the On-board Power Converter?
Key companies in the market include Bestek, NFA, Cobra, Kisae Technology, Rally, Energizer, Duracell, Meind, Stanley, Exeltech, Cotek, Samlex, Power Bright, Go Power, Wagan Tech, Magnum Energy, WEHO, Erayak.
3. What are the main segments of the On-board Power Converter?
The market segments include Application, Types.
4. Can you provide details about the market size?
The market size is estimated to be USD 20.65 billion as of 2022.
5. What are some drivers contributing to market growth?
N/A
6. What are the notable trends driving market growth?
N/A
7. Are there any restraints impacting market growth?
N/A
8. Can you provide examples of recent developments in the market?
N/A
9. What pricing options are available for accessing the report?
Pricing options include single-user, multi-user, and enterprise licenses priced at USD 4900.00, USD 7350.00, and USD 9800.00 respectively.
10. Is the market size provided in terms of value or volume?
The market size is provided in terms of value, measured in billion.
11. Are there any specific market keywords associated with the report?
Yes, the market keyword associated with the report is "On-board Power Converter," which aids in identifying and referencing the specific market segment covered.
12. How do I determine which pricing option suits my needs best?
The pricing options vary based on user requirements and access needs. Individual users may opt for single-user licenses, while businesses requiring broader access may choose multi-user or enterprise licenses for cost-effective access to the report.
13. Are there any additional resources or data provided in the On-board Power Converter report?
While the report offers comprehensive insights, it's advisable to review the specific contents or supplementary materials provided to ascertain if additional resources or data are available.
14. How can I stay updated on further developments or reports in the On-board Power Converter?
To stay informed about further developments, trends, and reports in the On-board Power Converter, consider subscribing to industry newsletters, following relevant companies and organizations, or regularly checking reputable industry news sources and publications.
Methodology
Step 1 - Identification of Relevant Samples Size from Population Database


Step 2 - Approaches for Defining Global Market Size (Value, Volume* & Price*)

Note*: In applicable scenarios
Step 3 - Data Sources
Primary Research
- Web Analytics
- Survey Reports
- Research Institute
- Latest Research Reports
- Opinion Leaders
Secondary Research
- Annual Reports
- White Paper
- Latest Press Release
- Industry Association
- Paid Database
- Investor Presentations

Step 4 - Data Triangulation
Involves using different sources of information in order to increase the validity of a study
These sources are likely to be stakeholders in a program - participants, other researchers, program staff, other community members, and so on.
Then we put all data in single framework & apply various statistical tools to find out the dynamic on the market.
During the analysis stage, feedback from the stakeholder groups would be compared to determine areas of agreement as well as areas of divergence