

Key Insights
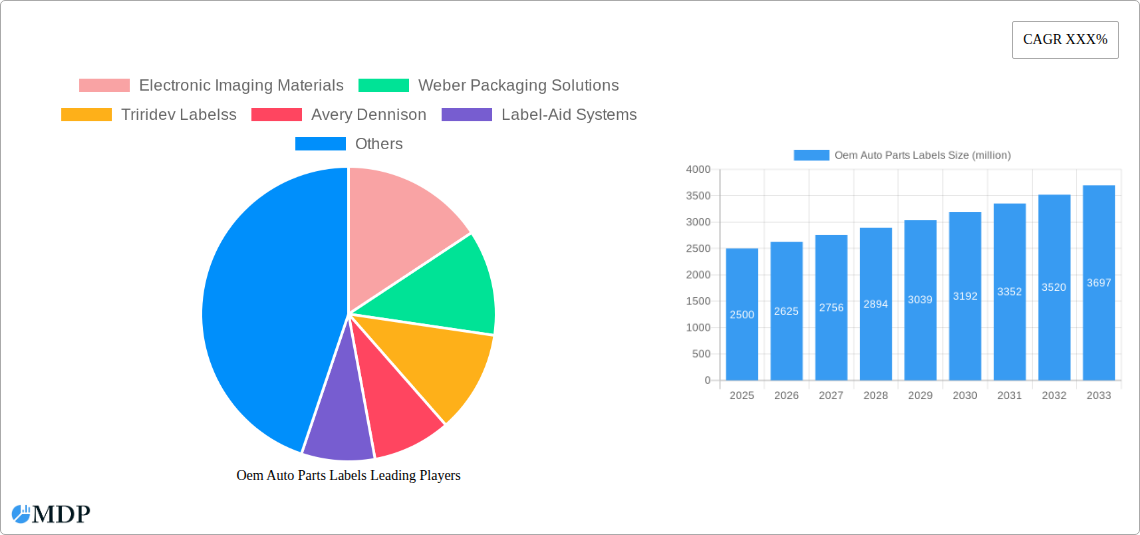
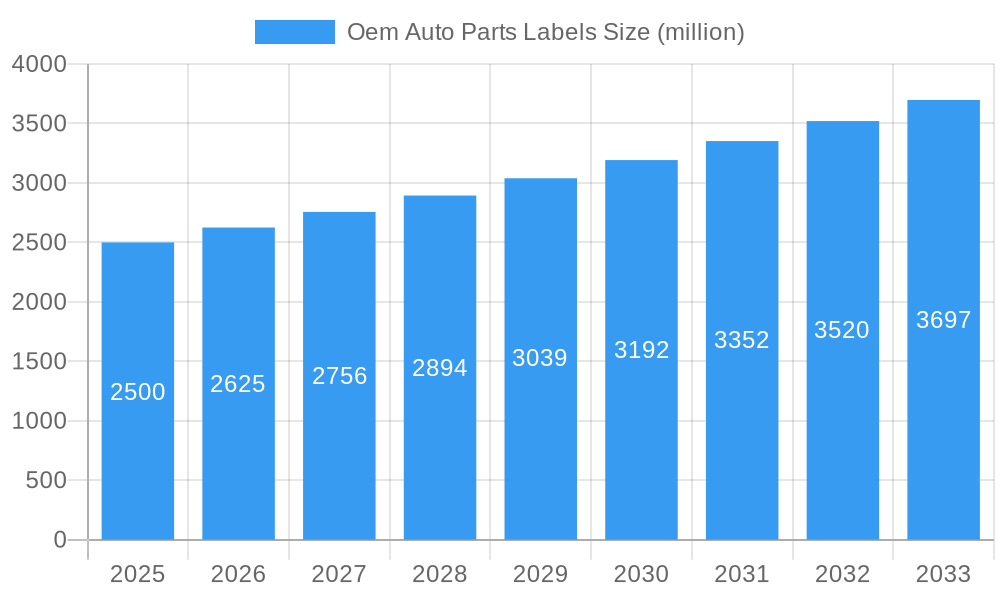
The global OEM Auto Parts Labels market is experiencing robust growth, driven by the increasing demand for automobiles and the rising adoption of advanced labeling technologies in the automotive industry. The market is segmented by application (Automotive Interior, Automotive Exterior, Engine Component, Others) and type (Polyester, Vinyl, Others). The automotive interior segment holds a significant market share due to the extensive use of labels for identification, warning, and instructions within vehicle cabins. Polyester labels dominate the market due to their durability, resistance to harsh environments, and ability to withstand extreme temperatures. Key market trends include the increasing use of durable, high-performance labels, the growing demand for customized labels, and the adoption of digital printing technologies for enhanced efficiency and cost-effectiveness. Growth is further fueled by stringent regulatory requirements regarding product labeling and traceability across the automotive supply chain. While the market faces challenges such as fluctuating raw material prices and intense competition, the long-term outlook remains positive, with continuous innovation in label materials and printing techniques driving future expansion. Major players like Avery Dennison, UPM Raflatac, and CCL Design are leveraging their technological expertise and global reach to consolidate their market positions. We estimate the market size in 2025 to be around $2.5 Billion, growing at a CAGR of 5% over the forecast period (2025-2033). This growth is projected to be particularly strong in Asia-Pacific, driven by the rapid expansion of the automotive industry in developing economies like China and India. The North American market, however, is expected to remain a significant contributor due to established automotive manufacturing bases and technological advancements.
Oem Auto Parts Labels Market Size (In Billion)
Geographic distribution reveals a diversified market, with North America and Europe maintaining substantial shares due to established automotive industries. However, the Asia-Pacific region is poised for significant growth, fueled by rising vehicle production and increasing adoption of advanced labeling technologies. The market is characterized by intense competition among established players and new entrants, emphasizing the need for continuous innovation and strategic partnerships to maintain a competitive edge. The focus on sustainable and eco-friendly label materials is also gaining traction, leading to the development of biodegradable and recyclable options. This trend, along with the increasing demand for sophisticated labeling solutions for electric vehicles and autonomous driving systems, will shape the future landscape of the OEM Auto Parts Labels market.
Oem Auto Parts Labels Company Market Share
Oem Auto Parts Labels Market Report: A Comprehensive Analysis (2019-2033)
This comprehensive report provides an in-depth analysis of the global OEM Auto Parts Labels market, projecting a market value exceeding $XX million by 2033. The study covers the period from 2019 to 2033, with 2025 as the base and estimated year. It offers actionable insights for industry stakeholders, including manufacturers, suppliers, and investors, providing a detailed understanding of market dynamics, trends, and future growth opportunities. This report leverages high-traffic keywords to ensure maximum search visibility and attract the right audience.
Oem Auto Parts Labels Market Dynamics & Concentration
The global OEM Auto Parts Labels market, valued at $XX million in 2025, exhibits a moderately concentrated landscape. Key players like Avery Dennison, UPM Raflatac, and CCL Design hold significant market share, driving innovation and influencing market trends. However, smaller niche players are also contributing to the market’s dynamism. The market's growth is fueled by advancements in labeling technologies, including the adoption of smart labels and RFID tags. Stringent regulatory frameworks concerning product labeling and material safety influence production and supply chain management. Substitutes, such as traditional marking methods, face competition from the superior durability and information capacity of labels. Rising demand for customized automotive interiors and exteriors, coupled with increasing vehicle production globally, fuels strong market growth.
- Market Share: Avery Dennison (XX%), UPM Raflatac (XX%), CCL Design (XX%), Others (XX%)
- M&A Activity: The historical period (2019-2024) witnessed approximately XX M&A deals, with a projected increase to XX deals during the forecast period (2025-2033). These activities demonstrate the industry's consolidation trend and companies’ eagerness to expand their market reach and technological capabilities.
Oem Auto Parts Labels Industry Trends & Analysis
The OEM Auto Parts Labels market is experiencing robust growth, with a projected CAGR of XX% during the forecast period (2025-2033). This growth is driven by several key factors, including rising automotive production, the growing popularity of customized vehicles, and the increasing adoption of advanced labeling technologies. Technological disruptions, such as the integration of smart labels and digital printing techniques, are significantly impacting market dynamics. Consumer preferences are shifting towards eco-friendly, durable, and aesthetically pleasing labels. The competitive landscape is characterized by intense competition, with major players focusing on innovation, strategic partnerships, and acquisitions to maintain their market positions. Market penetration of specialized labels, such as those with enhanced durability and traceability features, is increasing steadily.
Leading Markets & Segments in Oem Auto Parts Labels
The Automotive Interior segment dominates the application-based market, driven by the increasing demand for high-quality, aesthetically appealing interior components. Geographically, [Dominant Region, e.g., North America] holds a substantial market share due to the large automotive manufacturing base and high vehicle ownership rates. Polyester labels are the leading type, primarily due to their superior durability and resistance to harsh environmental conditions.
Key Drivers for Automotive Interior Segment:
- Growing demand for customized automotive interiors.
- Increasing focus on aesthetics and brand enhancement.
- Advancements in material science, leading to more durable and flexible labels.
Key Drivers for [Dominant Region]:
- High vehicle production rates.
- Robust automotive manufacturing infrastructure.
- Favorable government policies supporting the automotive sector.
Dominance Analysis: The dominance of the Automotive Interior segment is likely to continue during the forecast period due to continued innovation in interior design and the high volume of parts requiring labeling. The dominance of [Dominant Region] is expected to remain, though other regions, such as [Region 2] and [Region 3], will likely experience faster growth rates.
Oem Auto Parts Labels Product Developments
Recent product innovations focus on enhancing label durability, improving adhesion properties, and integrating smart technologies like RFID. New materials with enhanced UV resistance and chemical stability are being introduced to cater to the specific demands of different automotive components. The incorporation of tamper-evident features and advanced security measures is gaining traction. These developments are enhancing product differentiation and competitive advantages for manufacturers.
Key Drivers of Oem Auto Parts Labels Growth
Several factors fuel the market's expansion. The growing automotive sector and its increasing demand for labels with unique properties are primary contributors. Advancements in printing technologies allow for higher-quality, customized labels, leading to increased adoption. Stringent regulatory requirements regarding product information and traceability further drive label usage. Furthermore, the rising demand for eco-friendly labels is pushing innovation in sustainable materials and processes.
Challenges in the Oem Auto Parts Labels Market
The market faces challenges such as fluctuating raw material prices, potentially impacting profitability. Supply chain disruptions and logistical complexities can cause delays and increase costs. Competition from low-cost manufacturers exerts pressure on pricing and profit margins. Meeting stringent regulatory standards concerning material safety and environmental compliance adds to the cost and complexity of production.
Emerging Opportunities in Oem Auto Parts Labels
Expanding into new markets with emerging automotive industries offers lucrative growth potential. The development of high-performance labels with integrated sensors and data capabilities opens up new avenues. Strategic collaborations between label manufacturers and automotive companies will lead to innovative product solutions and market expansion.
Leading Players in the Oem Auto Parts Labels Sector
- Electronic Imaging Materials
- Weber Packaging Solutions
- Triridev Labels
- Avery Dennison
- Label-Aid Systems
- Auto Data Labels
- ALT Technologies
- CymMetrik
- UPM Raflatac
- CCL Design
- TESA
Key Milestones in Oem Auto Parts Labels Industry
- 2020: Avery Dennison launched a new line of sustainable labels.
- 2021: UPM Raflatac introduced an innovative RFID label solution for automotive parts tracking.
- 2022: CCL Design acquired a smaller label manufacturer, expanding its market reach.
- 2023: Increased adoption of digital printing technology for customized labels.
- 2024: Introduction of new regulations on label materials impacting the industry.
Strategic Outlook for Oem Auto Parts Labels Market
The future of the OEM Auto Parts Labels market looks bright. Continued growth in the automotive sector, coupled with technological advancements, will drive market expansion. Companies focusing on innovation, sustainability, and strategic partnerships will be best positioned to capture market share and achieve long-term success. The integration of smart technologies and the increasing focus on supply chain optimization present significant opportunities for growth.
Oem Auto Parts Labels Segmentation
-
1. Application
- 1.1. Automotive Interior
- 1.2. Automotive Exterior
- 1.3. Engine Component
- 1.4. Others
-
2. Type
- 2.1. Polyester
- 2.2. Vinyl
- 2.3. Others
Oem Auto Parts Labels Segmentation By Geography
-
1. North America
- 1.1. United States
- 1.2. Canada
- 1.3. Mexico
-
2. South America
- 2.1. Brazil
- 2.2. Argentina
- 2.3. Rest of South America
-
3. Europe
- 3.1. United Kingdom
- 3.2. Germany
- 3.3. France
- 3.4. Italy
- 3.5. Spain
- 3.6. Russia
- 3.7. Benelux
- 3.8. Nordics
- 3.9. Rest of Europe
-
4. Middle East & Africa
- 4.1. Turkey
- 4.2. Israel
- 4.3. GCC
- 4.4. North Africa
- 4.5. South Africa
- 4.6. Rest of Middle East & Africa
-
5. Asia Pacific
- 5.1. China
- 5.2. India
- 5.3. Japan
- 5.4. South Korea
- 5.5. ASEAN
- 5.6. Oceania
- 5.7. Rest of Asia Pacific

Oem Auto Parts Labels Regional Market Share
Geographic Coverage of Oem Auto Parts Labels
Oem Auto Parts Labels REPORT HIGHLIGHTS
| Aspects | Details |
|---|---|
| Study Period | 2020-2034 |
| Base Year | 2025 |
| Estimated Year | 2026 |
| Forecast Period | 2026-2034 |
| Historical Period | 2020-2025 |
| Growth Rate | CAGR of XXX% from 2020-2034 |
| Segmentation |
|
Table of Contents
- 1. Introduction
- 1.1. Research Scope
- 1.2. Market Segmentation
- 1.3. Research Methodology
- 1.4. Definitions and Assumptions
- 2. Executive Summary
- 2.1. Introduction
- 3. Market Dynamics
- 3.1. Introduction
- 3.2. Market Drivers
- 3.3. Market Restrains
- 3.4. Market Trends
- 4. Market Factor Analysis
- 4.1. Porters Five Forces
- 4.2. Supply/Value Chain
- 4.3. PESTEL analysis
- 4.4. Market Entropy
- 4.5. Patent/Trademark Analysis
- 5. Global Oem Auto Parts Labels Analysis, Insights and Forecast, 2020-2032
- 5.1. Market Analysis, Insights and Forecast - by Application
- 5.1.1. Automotive Interior
- 5.1.2. Automotive Exterior
- 5.1.3. Engine Component
- 5.1.4. Others
- 5.2. Market Analysis, Insights and Forecast - by Type
- 5.2.1. Polyester
- 5.2.2. Vinyl
- 5.2.3. Others
- 5.3. Market Analysis, Insights and Forecast - by Region
- 5.3.1. North America
- 5.3.2. South America
- 5.3.3. Europe
- 5.3.4. Middle East & Africa
- 5.3.5. Asia Pacific
- 5.1. Market Analysis, Insights and Forecast - by Application
- 6. North America Oem Auto Parts Labels Analysis, Insights and Forecast, 2020-2032
- 6.1. Market Analysis, Insights and Forecast - by Application
- 6.1.1. Automotive Interior
- 6.1.2. Automotive Exterior
- 6.1.3. Engine Component
- 6.1.4. Others
- 6.2. Market Analysis, Insights and Forecast - by Type
- 6.2.1. Polyester
- 6.2.2. Vinyl
- 6.2.3. Others
- 6.1. Market Analysis, Insights and Forecast - by Application
- 7. South America Oem Auto Parts Labels Analysis, Insights and Forecast, 2020-2032
- 7.1. Market Analysis, Insights and Forecast - by Application
- 7.1.1. Automotive Interior
- 7.1.2. Automotive Exterior
- 7.1.3. Engine Component
- 7.1.4. Others
- 7.2. Market Analysis, Insights and Forecast - by Type
- 7.2.1. Polyester
- 7.2.2. Vinyl
- 7.2.3. Others
- 7.1. Market Analysis, Insights and Forecast - by Application
- 8. Europe Oem Auto Parts Labels Analysis, Insights and Forecast, 2020-2032
- 8.1. Market Analysis, Insights and Forecast - by Application
- 8.1.1. Automotive Interior
- 8.1.2. Automotive Exterior
- 8.1.3. Engine Component
- 8.1.4. Others
- 8.2. Market Analysis, Insights and Forecast - by Type
- 8.2.1. Polyester
- 8.2.2. Vinyl
- 8.2.3. Others
- 8.1. Market Analysis, Insights and Forecast - by Application
- 9. Middle East & Africa Oem Auto Parts Labels Analysis, Insights and Forecast, 2020-2032
- 9.1. Market Analysis, Insights and Forecast - by Application
- 9.1.1. Automotive Interior
- 9.1.2. Automotive Exterior
- 9.1.3. Engine Component
- 9.1.4. Others
- 9.2. Market Analysis, Insights and Forecast - by Type
- 9.2.1. Polyester
- 9.2.2. Vinyl
- 9.2.3. Others
- 9.1. Market Analysis, Insights and Forecast - by Application
- 10. Asia Pacific Oem Auto Parts Labels Analysis, Insights and Forecast, 2020-2032
- 10.1. Market Analysis, Insights and Forecast - by Application
- 10.1.1. Automotive Interior
- 10.1.2. Automotive Exterior
- 10.1.3. Engine Component
- 10.1.4. Others
- 10.2. Market Analysis, Insights and Forecast - by Type
- 10.2.1. Polyester
- 10.2.2. Vinyl
- 10.2.3. Others
- 10.1. Market Analysis, Insights and Forecast - by Application
- 11. Competitive Analysis
- 11.1. Global Market Share Analysis 2025
- 11.2. Company Profiles
- 11.2.1 Electronic Imaging Materials
- 11.2.1.1. Overview
- 11.2.1.2. Products
- 11.2.1.3. SWOT Analysis
- 11.2.1.4. Recent Developments
- 11.2.1.5. Financials (Based on Availability)
- 11.2.2 Weber Packaging Solutions
- 11.2.2.1. Overview
- 11.2.2.2. Products
- 11.2.2.3. SWOT Analysis
- 11.2.2.4. Recent Developments
- 11.2.2.5. Financials (Based on Availability)
- 11.2.3 Triridev Labelss
- 11.2.3.1. Overview
- 11.2.3.2. Products
- 11.2.3.3. SWOT Analysis
- 11.2.3.4. Recent Developments
- 11.2.3.5. Financials (Based on Availability)
- 11.2.4 Avery Dennison
- 11.2.4.1. Overview
- 11.2.4.2. Products
- 11.2.4.3. SWOT Analysis
- 11.2.4.4. Recent Developments
- 11.2.4.5. Financials (Based on Availability)
- 11.2.5 Label-Aid Systems
- 11.2.5.1. Overview
- 11.2.5.2. Products
- 11.2.5.3. SWOT Analysis
- 11.2.5.4. Recent Developments
- 11.2.5.5. Financials (Based on Availability)
- 11.2.6 Auto Data Labels
- 11.2.6.1. Overview
- 11.2.6.2. Products
- 11.2.6.3. SWOT Analysis
- 11.2.6.4. Recent Developments
- 11.2.6.5. Financials (Based on Availability)
- 11.2.7 ALT Technologies
- 11.2.7.1. Overview
- 11.2.7.2. Products
- 11.2.7.3. SWOT Analysis
- 11.2.7.4. Recent Developments
- 11.2.7.5. Financials (Based on Availability)
- 11.2.8 CymMetrik
- 11.2.8.1. Overview
- 11.2.8.2. Products
- 11.2.8.3. SWOT Analysis
- 11.2.8.4. Recent Developments
- 11.2.8.5. Financials (Based on Availability)
- 11.2.9 UPM Raflatac
- 11.2.9.1. Overview
- 11.2.9.2. Products
- 11.2.9.3. SWOT Analysis
- 11.2.9.4. Recent Developments
- 11.2.9.5. Financials (Based on Availability)
- 11.2.10 CCL Design
- 11.2.10.1. Overview
- 11.2.10.2. Products
- 11.2.10.3. SWOT Analysis
- 11.2.10.4. Recent Developments
- 11.2.10.5. Financials (Based on Availability)
- 11.2.11 TESA
- 11.2.11.1. Overview
- 11.2.11.2. Products
- 11.2.11.3. SWOT Analysis
- 11.2.11.4. Recent Developments
- 11.2.11.5. Financials (Based on Availability)
- 11.2.1 Electronic Imaging Materials
List of Figures
- Figure 1: Global Oem Auto Parts Labels Revenue Breakdown (million, %) by Region 2025 & 2033
- Figure 2: North America Oem Auto Parts Labels Revenue (million), by Application 2025 & 2033
- Figure 3: North America Oem Auto Parts Labels Revenue Share (%), by Application 2025 & 2033
- Figure 4: North America Oem Auto Parts Labels Revenue (million), by Type 2025 & 2033
- Figure 5: North America Oem Auto Parts Labels Revenue Share (%), by Type 2025 & 2033
- Figure 6: North America Oem Auto Parts Labels Revenue (million), by Country 2025 & 2033
- Figure 7: North America Oem Auto Parts Labels Revenue Share (%), by Country 2025 & 2033
- Figure 8: South America Oem Auto Parts Labels Revenue (million), by Application 2025 & 2033
- Figure 9: South America Oem Auto Parts Labels Revenue Share (%), by Application 2025 & 2033
- Figure 10: South America Oem Auto Parts Labels Revenue (million), by Type 2025 & 2033
- Figure 11: South America Oem Auto Parts Labels Revenue Share (%), by Type 2025 & 2033
- Figure 12: South America Oem Auto Parts Labels Revenue (million), by Country 2025 & 2033
- Figure 13: South America Oem Auto Parts Labels Revenue Share (%), by Country 2025 & 2033
- Figure 14: Europe Oem Auto Parts Labels Revenue (million), by Application 2025 & 2033
- Figure 15: Europe Oem Auto Parts Labels Revenue Share (%), by Application 2025 & 2033
- Figure 16: Europe Oem Auto Parts Labels Revenue (million), by Type 2025 & 2033
- Figure 17: Europe Oem Auto Parts Labels Revenue Share (%), by Type 2025 & 2033
- Figure 18: Europe Oem Auto Parts Labels Revenue (million), by Country 2025 & 2033
- Figure 19: Europe Oem Auto Parts Labels Revenue Share (%), by Country 2025 & 2033
- Figure 20: Middle East & Africa Oem Auto Parts Labels Revenue (million), by Application 2025 & 2033
- Figure 21: Middle East & Africa Oem Auto Parts Labels Revenue Share (%), by Application 2025 & 2033
- Figure 22: Middle East & Africa Oem Auto Parts Labels Revenue (million), by Type 2025 & 2033
- Figure 23: Middle East & Africa Oem Auto Parts Labels Revenue Share (%), by Type 2025 & 2033
- Figure 24: Middle East & Africa Oem Auto Parts Labels Revenue (million), by Country 2025 & 2033
- Figure 25: Middle East & Africa Oem Auto Parts Labels Revenue Share (%), by Country 2025 & 2033
- Figure 26: Asia Pacific Oem Auto Parts Labels Revenue (million), by Application 2025 & 2033
- Figure 27: Asia Pacific Oem Auto Parts Labels Revenue Share (%), by Application 2025 & 2033
- Figure 28: Asia Pacific Oem Auto Parts Labels Revenue (million), by Type 2025 & 2033
- Figure 29: Asia Pacific Oem Auto Parts Labels Revenue Share (%), by Type 2025 & 2033
- Figure 30: Asia Pacific Oem Auto Parts Labels Revenue (million), by Country 2025 & 2033
- Figure 31: Asia Pacific Oem Auto Parts Labels Revenue Share (%), by Country 2025 & 2033
List of Tables
- Table 1: Global Oem Auto Parts Labels Revenue million Forecast, by Application 2020 & 2033
- Table 2: Global Oem Auto Parts Labels Revenue million Forecast, by Type 2020 & 2033
- Table 3: Global Oem Auto Parts Labels Revenue million Forecast, by Region 2020 & 2033
- Table 4: Global Oem Auto Parts Labels Revenue million Forecast, by Application 2020 & 2033
- Table 5: Global Oem Auto Parts Labels Revenue million Forecast, by Type 2020 & 2033
- Table 6: Global Oem Auto Parts Labels Revenue million Forecast, by Country 2020 & 2033
- Table 7: United States Oem Auto Parts Labels Revenue (million) Forecast, by Application 2020 & 2033
- Table 8: Canada Oem Auto Parts Labels Revenue (million) Forecast, by Application 2020 & 2033
- Table 9: Mexico Oem Auto Parts Labels Revenue (million) Forecast, by Application 2020 & 2033
- Table 10: Global Oem Auto Parts Labels Revenue million Forecast, by Application 2020 & 2033
- Table 11: Global Oem Auto Parts Labels Revenue million Forecast, by Type 2020 & 2033
- Table 12: Global Oem Auto Parts Labels Revenue million Forecast, by Country 2020 & 2033
- Table 13: Brazil Oem Auto Parts Labels Revenue (million) Forecast, by Application 2020 & 2033
- Table 14: Argentina Oem Auto Parts Labels Revenue (million) Forecast, by Application 2020 & 2033
- Table 15: Rest of South America Oem Auto Parts Labels Revenue (million) Forecast, by Application 2020 & 2033
- Table 16: Global Oem Auto Parts Labels Revenue million Forecast, by Application 2020 & 2033
- Table 17: Global Oem Auto Parts Labels Revenue million Forecast, by Type 2020 & 2033
- Table 18: Global Oem Auto Parts Labels Revenue million Forecast, by Country 2020 & 2033
- Table 19: United Kingdom Oem Auto Parts Labels Revenue (million) Forecast, by Application 2020 & 2033
- Table 20: Germany Oem Auto Parts Labels Revenue (million) Forecast, by Application 2020 & 2033
- Table 21: France Oem Auto Parts Labels Revenue (million) Forecast, by Application 2020 & 2033
- Table 22: Italy Oem Auto Parts Labels Revenue (million) Forecast, by Application 2020 & 2033
- Table 23: Spain Oem Auto Parts Labels Revenue (million) Forecast, by Application 2020 & 2033
- Table 24: Russia Oem Auto Parts Labels Revenue (million) Forecast, by Application 2020 & 2033
- Table 25: Benelux Oem Auto Parts Labels Revenue (million) Forecast, by Application 2020 & 2033
- Table 26: Nordics Oem Auto Parts Labels Revenue (million) Forecast, by Application 2020 & 2033
- Table 27: Rest of Europe Oem Auto Parts Labels Revenue (million) Forecast, by Application 2020 & 2033
- Table 28: Global Oem Auto Parts Labels Revenue million Forecast, by Application 2020 & 2033
- Table 29: Global Oem Auto Parts Labels Revenue million Forecast, by Type 2020 & 2033
- Table 30: Global Oem Auto Parts Labels Revenue million Forecast, by Country 2020 & 2033
- Table 31: Turkey Oem Auto Parts Labels Revenue (million) Forecast, by Application 2020 & 2033
- Table 32: Israel Oem Auto Parts Labels Revenue (million) Forecast, by Application 2020 & 2033
- Table 33: GCC Oem Auto Parts Labels Revenue (million) Forecast, by Application 2020 & 2033
- Table 34: North Africa Oem Auto Parts Labels Revenue (million) Forecast, by Application 2020 & 2033
- Table 35: South Africa Oem Auto Parts Labels Revenue (million) Forecast, by Application 2020 & 2033
- Table 36: Rest of Middle East & Africa Oem Auto Parts Labels Revenue (million) Forecast, by Application 2020 & 2033
- Table 37: Global Oem Auto Parts Labels Revenue million Forecast, by Application 2020 & 2033
- Table 38: Global Oem Auto Parts Labels Revenue million Forecast, by Type 2020 & 2033
- Table 39: Global Oem Auto Parts Labels Revenue million Forecast, by Country 2020 & 2033
- Table 40: China Oem Auto Parts Labels Revenue (million) Forecast, by Application 2020 & 2033
- Table 41: India Oem Auto Parts Labels Revenue (million) Forecast, by Application 2020 & 2033
- Table 42: Japan Oem Auto Parts Labels Revenue (million) Forecast, by Application 2020 & 2033
- Table 43: South Korea Oem Auto Parts Labels Revenue (million) Forecast, by Application 2020 & 2033
- Table 44: ASEAN Oem Auto Parts Labels Revenue (million) Forecast, by Application 2020 & 2033
- Table 45: Oceania Oem Auto Parts Labels Revenue (million) Forecast, by Application 2020 & 2033
- Table 46: Rest of Asia Pacific Oem Auto Parts Labels Revenue (million) Forecast, by Application 2020 & 2033
Frequently Asked Questions
1. What is the projected Compound Annual Growth Rate (CAGR) of the Oem Auto Parts Labels?
The projected CAGR is approximately XXX%.
2. Which companies are prominent players in the Oem Auto Parts Labels?
Key companies in the market include Electronic Imaging Materials, Weber Packaging Solutions, Triridev Labelss, Avery Dennison, Label-Aid Systems, Auto Data Labels, ALT Technologies, CymMetrik, UPM Raflatac, CCL Design, TESA.
3. What are the main segments of the Oem Auto Parts Labels?
The market segments include Application, Type.
4. Can you provide details about the market size?
The market size is estimated to be USD XXX million as of 2022.
5. What are some drivers contributing to market growth?
N/A
6. What are the notable trends driving market growth?
N/A
7. Are there any restraints impacting market growth?
N/A
8. Can you provide examples of recent developments in the market?
N/A
9. What pricing options are available for accessing the report?
Pricing options include single-user, multi-user, and enterprise licenses priced at USD 2900.00, USD 4350.00, and USD 5800.00 respectively.
10. Is the market size provided in terms of value or volume?
The market size is provided in terms of value, measured in million.
11. Are there any specific market keywords associated with the report?
Yes, the market keyword associated with the report is "Oem Auto Parts Labels," which aids in identifying and referencing the specific market segment covered.
12. How do I determine which pricing option suits my needs best?
The pricing options vary based on user requirements and access needs. Individual users may opt for single-user licenses, while businesses requiring broader access may choose multi-user or enterprise licenses for cost-effective access to the report.
13. Are there any additional resources or data provided in the Oem Auto Parts Labels report?
While the report offers comprehensive insights, it's advisable to review the specific contents or supplementary materials provided to ascertain if additional resources or data are available.
14. How can I stay updated on further developments or reports in the Oem Auto Parts Labels?
To stay informed about further developments, trends, and reports in the Oem Auto Parts Labels, consider subscribing to industry newsletters, following relevant companies and organizations, or regularly checking reputable industry news sources and publications.
Methodology
Step 1 - Identification of Relevant Samples Size from Population Database


Step 2 - Approaches for Defining Global Market Size (Value, Volume* & Price*)

Note*: In applicable scenarios
Step 3 - Data Sources
Primary Research
- Web Analytics
- Survey Reports
- Research Institute
- Latest Research Reports
- Opinion Leaders
Secondary Research
- Annual Reports
- White Paper
- Latest Press Release
- Industry Association
- Paid Database
- Investor Presentations

Step 4 - Data Triangulation
Involves using different sources of information in order to increase the validity of a study
These sources are likely to be stakeholders in a program - participants, other researchers, program staff, other community members, and so on.
Then we put all data in single framework & apply various statistical tools to find out the dynamic on the market.
During the analysis stage, feedback from the stakeholder groups would be compared to determine areas of agreement as well as areas of divergence