

Key Insights
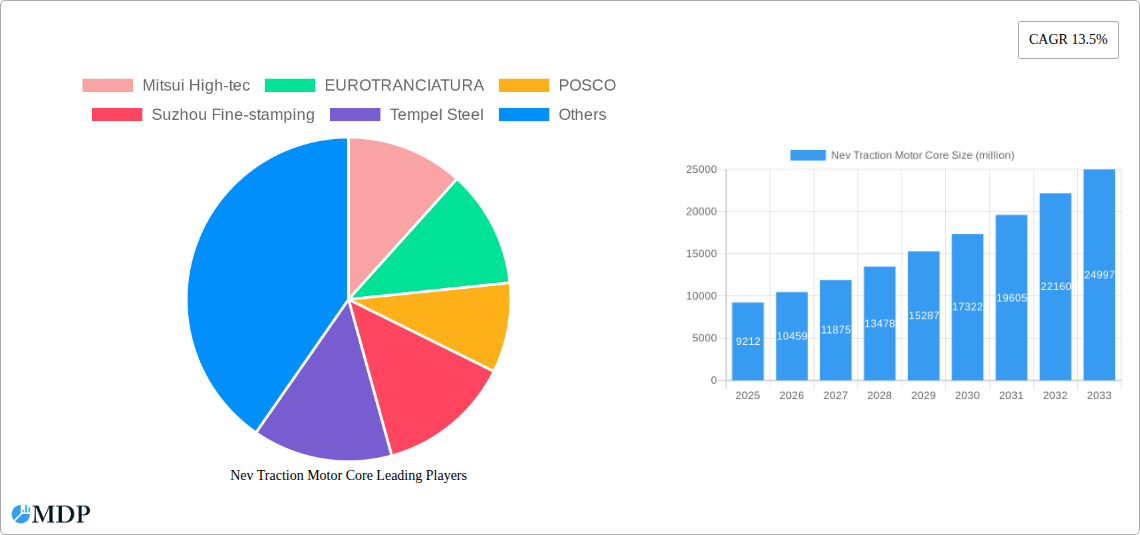
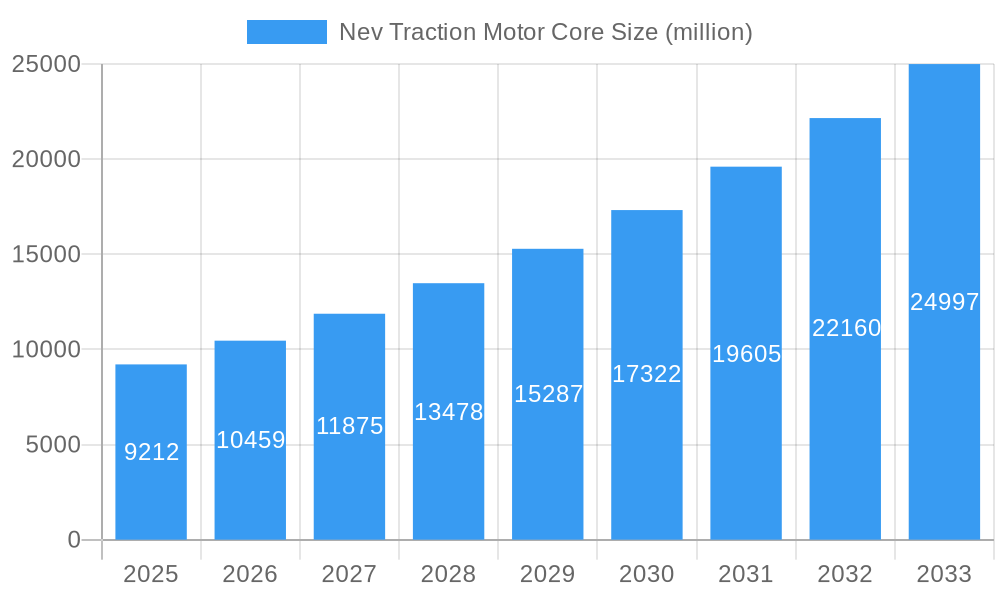
The global Nev Traction Motor Core market is poised for substantial growth, projected to reach a market size of approximately USD 9,212 million by 2025, driven by an impressive Compound Annual Growth Rate (CAGR) of 13.5%. This robust expansion is fundamentally fueled by the escalating adoption of electric vehicles (EVs) and the increasing demand for more efficient and powerful electric powertrains. Key drivers include stringent government regulations promoting emission reduction, substantial investments in EV infrastructure, and growing consumer awareness regarding the environmental and economic benefits of electric mobility. The market is segmented by application into Battery Electric Vehicles (BEVs), Plug-in Hybrid Electric Vehicles (PHEVs), Hybrid Electric Vehicles (HEVs), and Fuel Cell Electric Vehicles (FCEVs), with BEVs and PHEVs expected to represent the largest share due to their current market dominance. By type, the market is divided into Permanent Magnet Motor Cores and AC Induction Motor Cores, with Permanent Magnet Motor Cores likely to see higher demand due to their superior power density and efficiency, critical for the performance of modern EVs.
Nev Traction Motor Core Market Size (In Billion)
Geographically, the Asia Pacific region, particularly China, is anticipated to lead the market in terms of both production and consumption, owing to its established EV manufacturing base and supportive government policies. North America and Europe are also significant markets, with substantial investments in EV technology and charging infrastructure. Emerging trends include the development of advanced motor core materials for improved thermal management and reduced weight, as well as the integration of AI and machine learning in manufacturing processes for enhanced precision and cost-effectiveness. However, potential restraints such as the fluctuating costs of raw materials, particularly rare earth elements used in some motor designs, and the ongoing supply chain complexities for specialized components could pose challenges. Nevertheless, the overall outlook for the Nev Traction Motor Core market remains highly positive, supported by continuous technological advancements and the unyielding global shift towards sustainable transportation solutions.
Nev Traction Motor Core Company Market Share
Unlocking the Future of Electric Mobility: Nev Traction Motor Core Market Analysis & Growth Forecast (2019-2033)
This comprehensive report delves into the burgeoning Nev Traction Motor Core market, a critical component powering the electric vehicle revolution. Analyzing the landscape from 2019 to 2033, with a base year of 2025, this study provides unparalleled insights into market dynamics, technological advancements, leading players, and future growth trajectories. With an estimated market size of XX million by the forecast year, driven by the rapid adoption of Battery Electric Vehicles (BEVs), Plug-in Hybrid Electric Vehicles (PHEVs), Hybrid Electric Vehicles (HEVs), and Fuel Cell Electric Vehicles (FCEVs), this report is essential for stakeholders seeking to navigate and capitalize on this high-growth sector. We meticulously examine both Permanent Magnet Motor Cores and AC Induction Motor Cores, identifying key trends and opportunities for stakeholders like Mitsui High-tec, EUROTRANCIATURA, POSCO, Suzhou Fine-stamping, Tempel Steel, Hidria, Yutaka Giken, Wuxi Longsheng Technology, R.Bourgeois, Toyota Boshoku Corporation, Tongda Power Technology, Feintool, Shiri Electromechanical Technology, and JFE Shoji.
Nev Traction Motor Core Market Dynamics & Concentration
The Nev Traction Motor Core market is characterized by a moderate to high concentration, with a few key players holding significant market share. Innovation is primarily driven by the relentless pursuit of higher energy efficiency, reduced material costs, and enhanced motor performance for electric vehicles. Regulatory frameworks worldwide, focusing on stricter emission standards and EV adoption mandates, are crucial catalysts for market expansion. While direct product substitutes for motor cores are limited, advancements in motor design and material science represent potential disruptive forces. End-user trends heavily favor the increasing demand for lightweight, high-torque, and compact motor solutions in BEVs and PHEVs, directly impacting core manufacturing requirements. Merger and acquisition (M&A) activities are projected to remain active as companies seek to consolidate their market position, gain access to new technologies, and expand their manufacturing capabilities. We anticipate XX M&A deals within the historical period, with an estimated XX million in transaction value, signaling a healthy consolidation trend. Market share analysis indicates that leading manufacturers command approximately XX% of the global market.
Nev Traction Motor Core Industry Trends & Analysis
The Nev Traction Motor Core industry is experiencing robust growth, driven by the global shift towards sustainable transportation and the increasing electrification of vehicle powertrains. The Compound Annual Growth Rate (CAGR) for this market is estimated to be a significant XX% during the forecast period (2025-2033). Technological disruptions are at the forefront, with continuous innovation in lamination materials, manufacturing processes like precision stamping and laser cutting, and core designs optimized for reduced eddy current losses and improved magnetic flux distribution. Consumer preferences are increasingly dictating the need for electric vehicles with longer range, faster charging capabilities, and superior performance, all of which are directly influenced by the efficiency and design of the traction motor core. Competitive dynamics are intensifying, with established automotive suppliers and specialized component manufacturers vying for market dominance. The market penetration of EVs continues to climb, with projections indicating XX% of new vehicle sales will be electric by 2030, further fueling demand for traction motor cores. The historical period (2019-2024) has witnessed substantial investment in R&D, leading to advancements in materials like high-silicon steels and amorphous alloys, aiming to improve the power density and thermal management of electric motors. Furthermore, the evolving supply chain landscape, with a growing emphasis on localized production and secure sourcing of raw materials, is a critical factor shaping industry trends. The increasing complexity of motor designs to meet specific vehicle performance requirements necessitates greater collaboration between motor manufacturers and core suppliers.
Leading Markets & Segments in Nev Traction Motor Core
North America and Europe currently lead the Nev Traction Motor Core market, driven by stringent emission regulations and substantial government incentives for EV adoption. Within these regions, BEVs represent the largest and fastest-growing application segment, demanding highly efficient and compact Permanent Magnet Motor Cores. The increasing investment in charging infrastructure and the growing consumer awareness regarding environmental sustainability further bolster the dominance of this segment. Asia-Pacific, particularly China, is emerging as a significant growth engine, owing to its aggressive EV targets and a robust domestic automotive manufacturing ecosystem.
Key drivers for dominance in these leading markets include:
- Economic Policies: Favorable tax credits, subsidies, and preferential purchase policies for EVs significantly boost consumer demand, directly translating into higher traction motor core requirements.
- Infrastructure Development: The rapid expansion of EV charging networks alleviates range anxiety, encouraging wider EV adoption and, consequently, increasing the demand for motor cores.
- Technological Advancements: Continuous innovation in battery technology and motor efficiency, often driven by government-funded research and private sector investment, propels the market forward.
- Regulatory Frameworks: Stringent fuel economy standards and CO2 emission targets compel automakers to accelerate their transition to electric powertrains, creating sustained demand for motor cores.
The Permanent Magnet Motor Core segment is experiencing unparalleled growth due to its superior power density, efficiency, and torque characteristics, making it the preferred choice for performance-oriented BEVs. While AC Induction Motor Cores still hold a considerable market share, particularly in certain HEV applications, the trend clearly favors permanent magnet technology.
Nev Traction Motor Core Product Developments
Product development in the Nev Traction Motor Core sector is characterized by a relentless focus on enhancing efficiency and power density. Manufacturers are innovating with advanced lamination materials, such as high-silicon steels and amorphous alloys, to minimize energy losses. Precision stamping techniques and optimized core geometries are crucial for reducing eddy current losses and improving thermal management. The competitive advantage lies in producing lighter, more compact cores that can withstand higher operating temperatures and deliver superior magnetic flux. These advancements directly contribute to increased EV range and improved overall vehicle performance, aligning perfectly with evolving consumer demands.
Key Drivers of Nev Traction Motor Core Growth
The primary drivers for the Nev Traction Motor Core market’s expansion are multifaceted. Technological advancements in electric motor design, particularly the optimization of Permanent Magnet Motor Cores for higher efficiency and power density, are paramount. Economic factors, including government incentives for EV adoption and decreasing battery costs, make electric vehicles more accessible to a broader consumer base. Regulatory frameworks imposing stricter emission standards globally are compelling automakers to accelerate their electrification strategies. Furthermore, the growing environmental consciousness among consumers and the increasing desire for sustainable transportation solutions are significant underlying drivers. The projected XX% CAGR underscores the strong momentum.
Challenges in the Nev Traction Motor Core Market
Despite the robust growth, the Nev Traction Motor Core market faces several challenges. Regulatory hurdles, while driving adoption, can also lead to complex and evolving compliance requirements for materials and manufacturing processes. Supply chain disruptions, particularly concerning the availability and cost of critical raw materials like rare earth magnets used in Permanent Magnet Motor Cores, pose a significant risk. Intense competitive pressures from both established players and new entrants can lead to price erosion and necessitate continuous innovation. Furthermore, the technical complexity in achieving optimal core performance while managing manufacturing costs for high-volume production presents an ongoing challenge for many manufacturers. The high initial investment required for advanced manufacturing equipment can also be a barrier for smaller players.
Emerging Opportunities in Nev Traction Motor Core
Emerging opportunities in the Nev Traction Motor Core market are abundant, fueled by ongoing technological breakthroughs and strategic collaborations. The development of novel magnetic materials with improved performance characteristics and reduced reliance on critical raw materials presents a significant growth catalyst. Strategic partnerships between core manufacturers and leading automotive OEMs are crucial for co-developing tailored solutions that meet specific vehicle performance requirements. The expansion of the EV market into new geographic regions and the increasing demand for electric commercial vehicles and buses also offer substantial market expansion opportunities. The increasing focus on lightweighting and miniaturization of powertrain components to improve vehicle range and efficiency will continue to drive innovation in core design and material selection.
Leading Players in the Nev Traction Motor Core Sector
- Mitsui High-tec
- EUROTRANCIATURA
- POSCO
- Suzhou Fine-stamping
- Tempel Steel
- Hidria
- Yutaka Giken
- Wuxi Longsheng Technology
- R.Bourgeois
- Toyota Boshoku Corporation
- Tongda Power Technology
- Feintool
- Shiri Electromechanical Technology
- JFE Shoji
Key Milestones in Nev Traction Motor Core Industry
- 2019: Increased adoption of advanced stamping techniques for improved core efficiency.
- 2020: Growing focus on lightweight materials in core design for BEV applications.
- 2021: Surge in M&A activity as major players sought to expand manufacturing capacity.
- 2022: Introduction of new amorphous alloy-based cores promising reduced energy loss.
- 2023: Enhanced collaboration between automotive OEMs and core manufacturers for customized solutions.
- 2024: Significant advancements in laser cutting technologies for higher precision core manufacturing.
- 2025 (Base Year): Projected market size of XX million.
- 2026-2033 (Forecast Period): Expected CAGR of XX%.
Strategic Outlook for Nev Traction Motor Core Market
The strategic outlook for the Nev Traction Motor Core market is overwhelmingly positive, with growth accelerators driven by several key factors. The continued global push for decarbonization and the sustained growth in electric vehicle sales worldwide will provide a robust demand foundation. Key strategic opportunities lie in investing in advanced manufacturing technologies, exploring new material innovations, and forging strong partnerships with automotive manufacturers to co-develop next-generation motor cores. Companies that can effectively address supply chain vulnerabilities and offer cost-competitive, high-performance solutions are poised for significant success in this dynamic and rapidly evolving market. The focus on sustainability and circular economy principles in material sourcing and production will also become increasingly important.
Nev Traction Motor Core Segmentation
-
1. Application
- 1.1. BEV
- 1.2. PHEV
- 1.3. HEV
- 1.4. FCEV
-
2. Type
- 2.1. Permanent Magnet Motor Core
- 2.2. AC Induction Motor Core
Nev Traction Motor Core Segmentation By Geography
-
1. North America
- 1.1. United States
- 1.2. Canada
- 1.3. Mexico
-
2. South America
- 2.1. Brazil
- 2.2. Argentina
- 2.3. Rest of South America
-
3. Europe
- 3.1. United Kingdom
- 3.2. Germany
- 3.3. France
- 3.4. Italy
- 3.5. Spain
- 3.6. Russia
- 3.7. Benelux
- 3.8. Nordics
- 3.9. Rest of Europe
-
4. Middle East & Africa
- 4.1. Turkey
- 4.2. Israel
- 4.3. GCC
- 4.4. North Africa
- 4.5. South Africa
- 4.6. Rest of Middle East & Africa
-
5. Asia Pacific
- 5.1. China
- 5.2. India
- 5.3. Japan
- 5.4. South Korea
- 5.5. ASEAN
- 5.6. Oceania
- 5.7. Rest of Asia Pacific
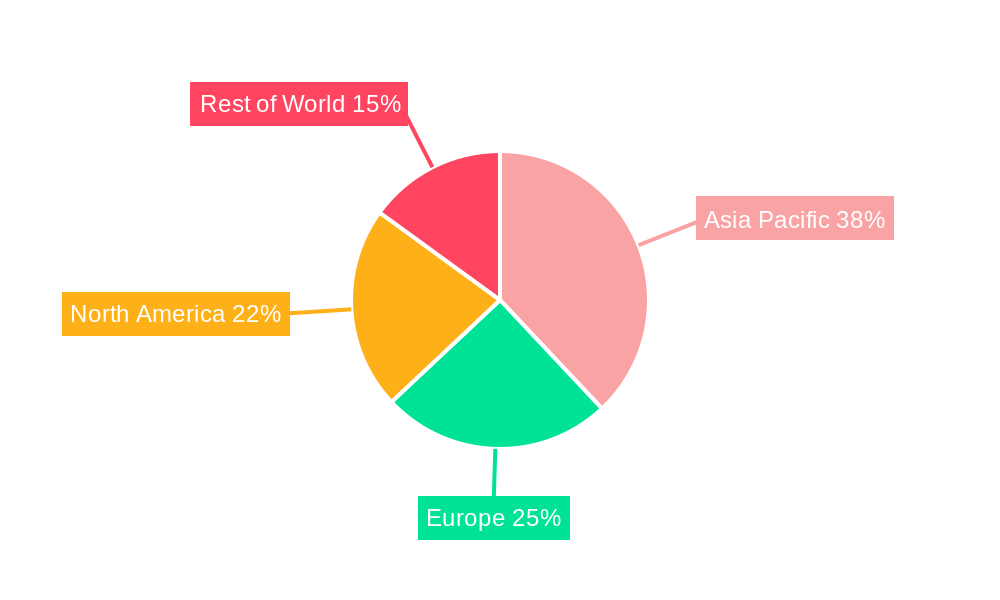
Nev Traction Motor Core Regional Market Share
Geographic Coverage of Nev Traction Motor Core
Nev Traction Motor Core REPORT HIGHLIGHTS
| Aspects | Details |
|---|---|
| Study Period | 2020-2034 |
| Base Year | 2025 |
| Estimated Year | 2026 |
| Forecast Period | 2026-2034 |
| Historical Period | 2020-2025 |
| Growth Rate | CAGR of 13.5% from 2020-2034 |
| Segmentation |
|
Table of Contents
- 1. Introduction
- 1.1. Research Scope
- 1.2. Market Segmentation
- 1.3. Research Methodology
- 1.4. Definitions and Assumptions
- 2. Executive Summary
- 2.1. Introduction
- 3. Market Dynamics
- 3.1. Introduction
- 3.2. Market Drivers
- 3.3. Market Restrains
- 3.4. Market Trends
- 4. Market Factor Analysis
- 4.1. Porters Five Forces
- 4.2. Supply/Value Chain
- 4.3. PESTEL analysis
- 4.4. Market Entropy
- 4.5. Patent/Trademark Analysis
- 5. Global Nev Traction Motor Core Analysis, Insights and Forecast, 2020-2032
- 5.1. Market Analysis, Insights and Forecast - by Application
- 5.1.1. BEV
- 5.1.2. PHEV
- 5.1.3. HEV
- 5.1.4. FCEV
- 5.2. Market Analysis, Insights and Forecast - by Type
- 5.2.1. Permanent Magnet Motor Core
- 5.2.2. AC Induction Motor Core
- 5.3. Market Analysis, Insights and Forecast - by Region
- 5.3.1. North America
- 5.3.2. South America
- 5.3.3. Europe
- 5.3.4. Middle East & Africa
- 5.3.5. Asia Pacific
- 5.1. Market Analysis, Insights and Forecast - by Application
- 6. North America Nev Traction Motor Core Analysis, Insights and Forecast, 2020-2032
- 6.1. Market Analysis, Insights and Forecast - by Application
- 6.1.1. BEV
- 6.1.2. PHEV
- 6.1.3. HEV
- 6.1.4. FCEV
- 6.2. Market Analysis, Insights and Forecast - by Type
- 6.2.1. Permanent Magnet Motor Core
- 6.2.2. AC Induction Motor Core
- 6.1. Market Analysis, Insights and Forecast - by Application
- 7. South America Nev Traction Motor Core Analysis, Insights and Forecast, 2020-2032
- 7.1. Market Analysis, Insights and Forecast - by Application
- 7.1.1. BEV
- 7.1.2. PHEV
- 7.1.3. HEV
- 7.1.4. FCEV
- 7.2. Market Analysis, Insights and Forecast - by Type
- 7.2.1. Permanent Magnet Motor Core
- 7.2.2. AC Induction Motor Core
- 7.1. Market Analysis, Insights and Forecast - by Application
- 8. Europe Nev Traction Motor Core Analysis, Insights and Forecast, 2020-2032
- 8.1. Market Analysis, Insights and Forecast - by Application
- 8.1.1. BEV
- 8.1.2. PHEV
- 8.1.3. HEV
- 8.1.4. FCEV
- 8.2. Market Analysis, Insights and Forecast - by Type
- 8.2.1. Permanent Magnet Motor Core
- 8.2.2. AC Induction Motor Core
- 8.1. Market Analysis, Insights and Forecast - by Application
- 9. Middle East & Africa Nev Traction Motor Core Analysis, Insights and Forecast, 2020-2032
- 9.1. Market Analysis, Insights and Forecast - by Application
- 9.1.1. BEV
- 9.1.2. PHEV
- 9.1.3. HEV
- 9.1.4. FCEV
- 9.2. Market Analysis, Insights and Forecast - by Type
- 9.2.1. Permanent Magnet Motor Core
- 9.2.2. AC Induction Motor Core
- 9.1. Market Analysis, Insights and Forecast - by Application
- 10. Asia Pacific Nev Traction Motor Core Analysis, Insights and Forecast, 2020-2032
- 10.1. Market Analysis, Insights and Forecast - by Application
- 10.1.1. BEV
- 10.1.2. PHEV
- 10.1.3. HEV
- 10.1.4. FCEV
- 10.2. Market Analysis, Insights and Forecast - by Type
- 10.2.1. Permanent Magnet Motor Core
- 10.2.2. AC Induction Motor Core
- 10.1. Market Analysis, Insights and Forecast - by Application
- 11. Competitive Analysis
- 11.1. Global Market Share Analysis 2025
- 11.2. Company Profiles
- 11.2.1 Mitsui High-tec
- 11.2.1.1. Overview
- 11.2.1.2. Products
- 11.2.1.3. SWOT Analysis
- 11.2.1.4. Recent Developments
- 11.2.1.5. Financials (Based on Availability)
- 11.2.2 EUROTRANCIATURA
- 11.2.2.1. Overview
- 11.2.2.2. Products
- 11.2.2.3. SWOT Analysis
- 11.2.2.4. Recent Developments
- 11.2.2.5. Financials (Based on Availability)
- 11.2.3 POSCO
- 11.2.3.1. Overview
- 11.2.3.2. Products
- 11.2.3.3. SWOT Analysis
- 11.2.3.4. Recent Developments
- 11.2.3.5. Financials (Based on Availability)
- 11.2.4 Suzhou Fine-stamping
- 11.2.4.1. Overview
- 11.2.4.2. Products
- 11.2.4.3. SWOT Analysis
- 11.2.4.4. Recent Developments
- 11.2.4.5. Financials (Based on Availability)
- 11.2.5 Tempel Steel
- 11.2.5.1. Overview
- 11.2.5.2. Products
- 11.2.5.3. SWOT Analysis
- 11.2.5.4. Recent Developments
- 11.2.5.5. Financials (Based on Availability)
- 11.2.6 Hidria
- 11.2.6.1. Overview
- 11.2.6.2. Products
- 11.2.6.3. SWOT Analysis
- 11.2.6.4. Recent Developments
- 11.2.6.5. Financials (Based on Availability)
- 11.2.7 Yutaka Giken
- 11.2.7.1. Overview
- 11.2.7.2. Products
- 11.2.7.3. SWOT Analysis
- 11.2.7.4. Recent Developments
- 11.2.7.5. Financials (Based on Availability)
- 11.2.8 Wuxi Longsheng Technology
- 11.2.8.1. Overview
- 11.2.8.2. Products
- 11.2.8.3. SWOT Analysis
- 11.2.8.4. Recent Developments
- 11.2.8.5. Financials (Based on Availability)
- 11.2.9 R.Bourgeois
- 11.2.9.1. Overview
- 11.2.9.2. Products
- 11.2.9.3. SWOT Analysis
- 11.2.9.4. Recent Developments
- 11.2.9.5. Financials (Based on Availability)
- 11.2.10 Toyota Boshoku Corporation
- 11.2.10.1. Overview
- 11.2.10.2. Products
- 11.2.10.3. SWOT Analysis
- 11.2.10.4. Recent Developments
- 11.2.10.5. Financials (Based on Availability)
- 11.2.11 Tongda Power Technology
- 11.2.11.1. Overview
- 11.2.11.2. Products
- 11.2.11.3. SWOT Analysis
- 11.2.11.4. Recent Developments
- 11.2.11.5. Financials (Based on Availability)
- 11.2.12 Feintool
- 11.2.12.1. Overview
- 11.2.12.2. Products
- 11.2.12.3. SWOT Analysis
- 11.2.12.4. Recent Developments
- 11.2.12.5. Financials (Based on Availability)
- 11.2.13 Shiri Electromechanical Technology
- 11.2.13.1. Overview
- 11.2.13.2. Products
- 11.2.13.3. SWOT Analysis
- 11.2.13.4. Recent Developments
- 11.2.13.5. Financials (Based on Availability)
- 11.2.14 JFE Shoji
- 11.2.14.1. Overview
- 11.2.14.2. Products
- 11.2.14.3. SWOT Analysis
- 11.2.14.4. Recent Developments
- 11.2.14.5. Financials (Based on Availability)
- 11.2.1 Mitsui High-tec
List of Figures
- Figure 1: Global Nev Traction Motor Core Revenue Breakdown (million, %) by Region 2025 & 2033
- Figure 2: Global Nev Traction Motor Core Volume Breakdown (K, %) by Region 2025 & 2033
- Figure 3: North America Nev Traction Motor Core Revenue (million), by Application 2025 & 2033
- Figure 4: North America Nev Traction Motor Core Volume (K), by Application 2025 & 2033
- Figure 5: North America Nev Traction Motor Core Revenue Share (%), by Application 2025 & 2033
- Figure 6: North America Nev Traction Motor Core Volume Share (%), by Application 2025 & 2033
- Figure 7: North America Nev Traction Motor Core Revenue (million), by Type 2025 & 2033
- Figure 8: North America Nev Traction Motor Core Volume (K), by Type 2025 & 2033
- Figure 9: North America Nev Traction Motor Core Revenue Share (%), by Type 2025 & 2033
- Figure 10: North America Nev Traction Motor Core Volume Share (%), by Type 2025 & 2033
- Figure 11: North America Nev Traction Motor Core Revenue (million), by Country 2025 & 2033
- Figure 12: North America Nev Traction Motor Core Volume (K), by Country 2025 & 2033
- Figure 13: North America Nev Traction Motor Core Revenue Share (%), by Country 2025 & 2033
- Figure 14: North America Nev Traction Motor Core Volume Share (%), by Country 2025 & 2033
- Figure 15: South America Nev Traction Motor Core Revenue (million), by Application 2025 & 2033
- Figure 16: South America Nev Traction Motor Core Volume (K), by Application 2025 & 2033
- Figure 17: South America Nev Traction Motor Core Revenue Share (%), by Application 2025 & 2033
- Figure 18: South America Nev Traction Motor Core Volume Share (%), by Application 2025 & 2033
- Figure 19: South America Nev Traction Motor Core Revenue (million), by Type 2025 & 2033
- Figure 20: South America Nev Traction Motor Core Volume (K), by Type 2025 & 2033
- Figure 21: South America Nev Traction Motor Core Revenue Share (%), by Type 2025 & 2033
- Figure 22: South America Nev Traction Motor Core Volume Share (%), by Type 2025 & 2033
- Figure 23: South America Nev Traction Motor Core Revenue (million), by Country 2025 & 2033
- Figure 24: South America Nev Traction Motor Core Volume (K), by Country 2025 & 2033
- Figure 25: South America Nev Traction Motor Core Revenue Share (%), by Country 2025 & 2033
- Figure 26: South America Nev Traction Motor Core Volume Share (%), by Country 2025 & 2033
- Figure 27: Europe Nev Traction Motor Core Revenue (million), by Application 2025 & 2033
- Figure 28: Europe Nev Traction Motor Core Volume (K), by Application 2025 & 2033
- Figure 29: Europe Nev Traction Motor Core Revenue Share (%), by Application 2025 & 2033
- Figure 30: Europe Nev Traction Motor Core Volume Share (%), by Application 2025 & 2033
- Figure 31: Europe Nev Traction Motor Core Revenue (million), by Type 2025 & 2033
- Figure 32: Europe Nev Traction Motor Core Volume (K), by Type 2025 & 2033
- Figure 33: Europe Nev Traction Motor Core Revenue Share (%), by Type 2025 & 2033
- Figure 34: Europe Nev Traction Motor Core Volume Share (%), by Type 2025 & 2033
- Figure 35: Europe Nev Traction Motor Core Revenue (million), by Country 2025 & 2033
- Figure 36: Europe Nev Traction Motor Core Volume (K), by Country 2025 & 2033
- Figure 37: Europe Nev Traction Motor Core Revenue Share (%), by Country 2025 & 2033
- Figure 38: Europe Nev Traction Motor Core Volume Share (%), by Country 2025 & 2033
- Figure 39: Middle East & Africa Nev Traction Motor Core Revenue (million), by Application 2025 & 2033
- Figure 40: Middle East & Africa Nev Traction Motor Core Volume (K), by Application 2025 & 2033
- Figure 41: Middle East & Africa Nev Traction Motor Core Revenue Share (%), by Application 2025 & 2033
- Figure 42: Middle East & Africa Nev Traction Motor Core Volume Share (%), by Application 2025 & 2033
- Figure 43: Middle East & Africa Nev Traction Motor Core Revenue (million), by Type 2025 & 2033
- Figure 44: Middle East & Africa Nev Traction Motor Core Volume (K), by Type 2025 & 2033
- Figure 45: Middle East & Africa Nev Traction Motor Core Revenue Share (%), by Type 2025 & 2033
- Figure 46: Middle East & Africa Nev Traction Motor Core Volume Share (%), by Type 2025 & 2033
- Figure 47: Middle East & Africa Nev Traction Motor Core Revenue (million), by Country 2025 & 2033
- Figure 48: Middle East & Africa Nev Traction Motor Core Volume (K), by Country 2025 & 2033
- Figure 49: Middle East & Africa Nev Traction Motor Core Revenue Share (%), by Country 2025 & 2033
- Figure 50: Middle East & Africa Nev Traction Motor Core Volume Share (%), by Country 2025 & 2033
- Figure 51: Asia Pacific Nev Traction Motor Core Revenue (million), by Application 2025 & 2033
- Figure 52: Asia Pacific Nev Traction Motor Core Volume (K), by Application 2025 & 2033
- Figure 53: Asia Pacific Nev Traction Motor Core Revenue Share (%), by Application 2025 & 2033
- Figure 54: Asia Pacific Nev Traction Motor Core Volume Share (%), by Application 2025 & 2033
- Figure 55: Asia Pacific Nev Traction Motor Core Revenue (million), by Type 2025 & 2033
- Figure 56: Asia Pacific Nev Traction Motor Core Volume (K), by Type 2025 & 2033
- Figure 57: Asia Pacific Nev Traction Motor Core Revenue Share (%), by Type 2025 & 2033
- Figure 58: Asia Pacific Nev Traction Motor Core Volume Share (%), by Type 2025 & 2033
- Figure 59: Asia Pacific Nev Traction Motor Core Revenue (million), by Country 2025 & 2033
- Figure 60: Asia Pacific Nev Traction Motor Core Volume (K), by Country 2025 & 2033
- Figure 61: Asia Pacific Nev Traction Motor Core Revenue Share (%), by Country 2025 & 2033
- Figure 62: Asia Pacific Nev Traction Motor Core Volume Share (%), by Country 2025 & 2033
List of Tables
- Table 1: Global Nev Traction Motor Core Revenue million Forecast, by Application 2020 & 2033
- Table 2: Global Nev Traction Motor Core Volume K Forecast, by Application 2020 & 2033
- Table 3: Global Nev Traction Motor Core Revenue million Forecast, by Type 2020 & 2033
- Table 4: Global Nev Traction Motor Core Volume K Forecast, by Type 2020 & 2033
- Table 5: Global Nev Traction Motor Core Revenue million Forecast, by Region 2020 & 2033
- Table 6: Global Nev Traction Motor Core Volume K Forecast, by Region 2020 & 2033
- Table 7: Global Nev Traction Motor Core Revenue million Forecast, by Application 2020 & 2033
- Table 8: Global Nev Traction Motor Core Volume K Forecast, by Application 2020 & 2033
- Table 9: Global Nev Traction Motor Core Revenue million Forecast, by Type 2020 & 2033
- Table 10: Global Nev Traction Motor Core Volume K Forecast, by Type 2020 & 2033
- Table 11: Global Nev Traction Motor Core Revenue million Forecast, by Country 2020 & 2033
- Table 12: Global Nev Traction Motor Core Volume K Forecast, by Country 2020 & 2033
- Table 13: United States Nev Traction Motor Core Revenue (million) Forecast, by Application 2020 & 2033
- Table 14: United States Nev Traction Motor Core Volume (K) Forecast, by Application 2020 & 2033
- Table 15: Canada Nev Traction Motor Core Revenue (million) Forecast, by Application 2020 & 2033
- Table 16: Canada Nev Traction Motor Core Volume (K) Forecast, by Application 2020 & 2033
- Table 17: Mexico Nev Traction Motor Core Revenue (million) Forecast, by Application 2020 & 2033
- Table 18: Mexico Nev Traction Motor Core Volume (K) Forecast, by Application 2020 & 2033
- Table 19: Global Nev Traction Motor Core Revenue million Forecast, by Application 2020 & 2033
- Table 20: Global Nev Traction Motor Core Volume K Forecast, by Application 2020 & 2033
- Table 21: Global Nev Traction Motor Core Revenue million Forecast, by Type 2020 & 2033
- Table 22: Global Nev Traction Motor Core Volume K Forecast, by Type 2020 & 2033
- Table 23: Global Nev Traction Motor Core Revenue million Forecast, by Country 2020 & 2033
- Table 24: Global Nev Traction Motor Core Volume K Forecast, by Country 2020 & 2033
- Table 25: Brazil Nev Traction Motor Core Revenue (million) Forecast, by Application 2020 & 2033
- Table 26: Brazil Nev Traction Motor Core Volume (K) Forecast, by Application 2020 & 2033
- Table 27: Argentina Nev Traction Motor Core Revenue (million) Forecast, by Application 2020 & 2033
- Table 28: Argentina Nev Traction Motor Core Volume (K) Forecast, by Application 2020 & 2033
- Table 29: Rest of South America Nev Traction Motor Core Revenue (million) Forecast, by Application 2020 & 2033
- Table 30: Rest of South America Nev Traction Motor Core Volume (K) Forecast, by Application 2020 & 2033
- Table 31: Global Nev Traction Motor Core Revenue million Forecast, by Application 2020 & 2033
- Table 32: Global Nev Traction Motor Core Volume K Forecast, by Application 2020 & 2033
- Table 33: Global Nev Traction Motor Core Revenue million Forecast, by Type 2020 & 2033
- Table 34: Global Nev Traction Motor Core Volume K Forecast, by Type 2020 & 2033
- Table 35: Global Nev Traction Motor Core Revenue million Forecast, by Country 2020 & 2033
- Table 36: Global Nev Traction Motor Core Volume K Forecast, by Country 2020 & 2033
- Table 37: United Kingdom Nev Traction Motor Core Revenue (million) Forecast, by Application 2020 & 2033
- Table 38: United Kingdom Nev Traction Motor Core Volume (K) Forecast, by Application 2020 & 2033
- Table 39: Germany Nev Traction Motor Core Revenue (million) Forecast, by Application 2020 & 2033
- Table 40: Germany Nev Traction Motor Core Volume (K) Forecast, by Application 2020 & 2033
- Table 41: France Nev Traction Motor Core Revenue (million) Forecast, by Application 2020 & 2033
- Table 42: France Nev Traction Motor Core Volume (K) Forecast, by Application 2020 & 2033
- Table 43: Italy Nev Traction Motor Core Revenue (million) Forecast, by Application 2020 & 2033
- Table 44: Italy Nev Traction Motor Core Volume (K) Forecast, by Application 2020 & 2033
- Table 45: Spain Nev Traction Motor Core Revenue (million) Forecast, by Application 2020 & 2033
- Table 46: Spain Nev Traction Motor Core Volume (K) Forecast, by Application 2020 & 2033
- Table 47: Russia Nev Traction Motor Core Revenue (million) Forecast, by Application 2020 & 2033
- Table 48: Russia Nev Traction Motor Core Volume (K) Forecast, by Application 2020 & 2033
- Table 49: Benelux Nev Traction Motor Core Revenue (million) Forecast, by Application 2020 & 2033
- Table 50: Benelux Nev Traction Motor Core Volume (K) Forecast, by Application 2020 & 2033
- Table 51: Nordics Nev Traction Motor Core Revenue (million) Forecast, by Application 2020 & 2033
- Table 52: Nordics Nev Traction Motor Core Volume (K) Forecast, by Application 2020 & 2033
- Table 53: Rest of Europe Nev Traction Motor Core Revenue (million) Forecast, by Application 2020 & 2033
- Table 54: Rest of Europe Nev Traction Motor Core Volume (K) Forecast, by Application 2020 & 2033
- Table 55: Global Nev Traction Motor Core Revenue million Forecast, by Application 2020 & 2033
- Table 56: Global Nev Traction Motor Core Volume K Forecast, by Application 2020 & 2033
- Table 57: Global Nev Traction Motor Core Revenue million Forecast, by Type 2020 & 2033
- Table 58: Global Nev Traction Motor Core Volume K Forecast, by Type 2020 & 2033
- Table 59: Global Nev Traction Motor Core Revenue million Forecast, by Country 2020 & 2033
- Table 60: Global Nev Traction Motor Core Volume K Forecast, by Country 2020 & 2033
- Table 61: Turkey Nev Traction Motor Core Revenue (million) Forecast, by Application 2020 & 2033
- Table 62: Turkey Nev Traction Motor Core Volume (K) Forecast, by Application 2020 & 2033
- Table 63: Israel Nev Traction Motor Core Revenue (million) Forecast, by Application 2020 & 2033
- Table 64: Israel Nev Traction Motor Core Volume (K) Forecast, by Application 2020 & 2033
- Table 65: GCC Nev Traction Motor Core Revenue (million) Forecast, by Application 2020 & 2033
- Table 66: GCC Nev Traction Motor Core Volume (K) Forecast, by Application 2020 & 2033
- Table 67: North Africa Nev Traction Motor Core Revenue (million) Forecast, by Application 2020 & 2033
- Table 68: North Africa Nev Traction Motor Core Volume (K) Forecast, by Application 2020 & 2033
- Table 69: South Africa Nev Traction Motor Core Revenue (million) Forecast, by Application 2020 & 2033
- Table 70: South Africa Nev Traction Motor Core Volume (K) Forecast, by Application 2020 & 2033
- Table 71: Rest of Middle East & Africa Nev Traction Motor Core Revenue (million) Forecast, by Application 2020 & 2033
- Table 72: Rest of Middle East & Africa Nev Traction Motor Core Volume (K) Forecast, by Application 2020 & 2033
- Table 73: Global Nev Traction Motor Core Revenue million Forecast, by Application 2020 & 2033
- Table 74: Global Nev Traction Motor Core Volume K Forecast, by Application 2020 & 2033
- Table 75: Global Nev Traction Motor Core Revenue million Forecast, by Type 2020 & 2033
- Table 76: Global Nev Traction Motor Core Volume K Forecast, by Type 2020 & 2033
- Table 77: Global Nev Traction Motor Core Revenue million Forecast, by Country 2020 & 2033
- Table 78: Global Nev Traction Motor Core Volume K Forecast, by Country 2020 & 2033
- Table 79: China Nev Traction Motor Core Revenue (million) Forecast, by Application 2020 & 2033
- Table 80: China Nev Traction Motor Core Volume (K) Forecast, by Application 2020 & 2033
- Table 81: India Nev Traction Motor Core Revenue (million) Forecast, by Application 2020 & 2033
- Table 82: India Nev Traction Motor Core Volume (K) Forecast, by Application 2020 & 2033
- Table 83: Japan Nev Traction Motor Core Revenue (million) Forecast, by Application 2020 & 2033
- Table 84: Japan Nev Traction Motor Core Volume (K) Forecast, by Application 2020 & 2033
- Table 85: South Korea Nev Traction Motor Core Revenue (million) Forecast, by Application 2020 & 2033
- Table 86: South Korea Nev Traction Motor Core Volume (K) Forecast, by Application 2020 & 2033
- Table 87: ASEAN Nev Traction Motor Core Revenue (million) Forecast, by Application 2020 & 2033
- Table 88: ASEAN Nev Traction Motor Core Volume (K) Forecast, by Application 2020 & 2033
- Table 89: Oceania Nev Traction Motor Core Revenue (million) Forecast, by Application 2020 & 2033
- Table 90: Oceania Nev Traction Motor Core Volume (K) Forecast, by Application 2020 & 2033
- Table 91: Rest of Asia Pacific Nev Traction Motor Core Revenue (million) Forecast, by Application 2020 & 2033
- Table 92: Rest of Asia Pacific Nev Traction Motor Core Volume (K) Forecast, by Application 2020 & 2033
Frequently Asked Questions
1. What is the projected Compound Annual Growth Rate (CAGR) of the Nev Traction Motor Core?
The projected CAGR is approximately 13.5%.
2. Which companies are prominent players in the Nev Traction Motor Core?
Key companies in the market include Mitsui High-tec, EUROTRANCIATURA, POSCO, Suzhou Fine-stamping, Tempel Steel, Hidria, Yutaka Giken, Wuxi Longsheng Technology, R.Bourgeois, Toyota Boshoku Corporation, Tongda Power Technology, Feintool, Shiri Electromechanical Technology, JFE Shoji.
3. What are the main segments of the Nev Traction Motor Core?
The market segments include Application, Type.
4. Can you provide details about the market size?
The market size is estimated to be USD 9212 million as of 2022.
5. What are some drivers contributing to market growth?
N/A
6. What are the notable trends driving market growth?
N/A
7. Are there any restraints impacting market growth?
N/A
8. Can you provide examples of recent developments in the market?
N/A
9. What pricing options are available for accessing the report?
Pricing options include single-user, multi-user, and enterprise licenses priced at USD 3950.00, USD 5925.00, and USD 7900.00 respectively.
10. Is the market size provided in terms of value or volume?
The market size is provided in terms of value, measured in million and volume, measured in K.
11. Are there any specific market keywords associated with the report?
Yes, the market keyword associated with the report is "Nev Traction Motor Core," which aids in identifying and referencing the specific market segment covered.
12. How do I determine which pricing option suits my needs best?
The pricing options vary based on user requirements and access needs. Individual users may opt for single-user licenses, while businesses requiring broader access may choose multi-user or enterprise licenses for cost-effective access to the report.
13. Are there any additional resources or data provided in the Nev Traction Motor Core report?
While the report offers comprehensive insights, it's advisable to review the specific contents or supplementary materials provided to ascertain if additional resources or data are available.
14. How can I stay updated on further developments or reports in the Nev Traction Motor Core?
To stay informed about further developments, trends, and reports in the Nev Traction Motor Core, consider subscribing to industry newsletters, following relevant companies and organizations, or regularly checking reputable industry news sources and publications.
Methodology
Step 1 - Identification of Relevant Samples Size from Population Database


Step 2 - Approaches for Defining Global Market Size (Value, Volume* & Price*)

Note*: In applicable scenarios
Step 3 - Data Sources
Primary Research
- Web Analytics
- Survey Reports
- Research Institute
- Latest Research Reports
- Opinion Leaders
Secondary Research
- Annual Reports
- White Paper
- Latest Press Release
- Industry Association
- Paid Database
- Investor Presentations

Step 4 - Data Triangulation
Involves using different sources of information in order to increase the validity of a study
These sources are likely to be stakeholders in a program - participants, other researchers, program staff, other community members, and so on.
Then we put all data in single framework & apply various statistical tools to find out the dynamic on the market.
During the analysis stage, feedback from the stakeholder groups would be compared to determine areas of agreement as well as areas of divergence