

Key Insights
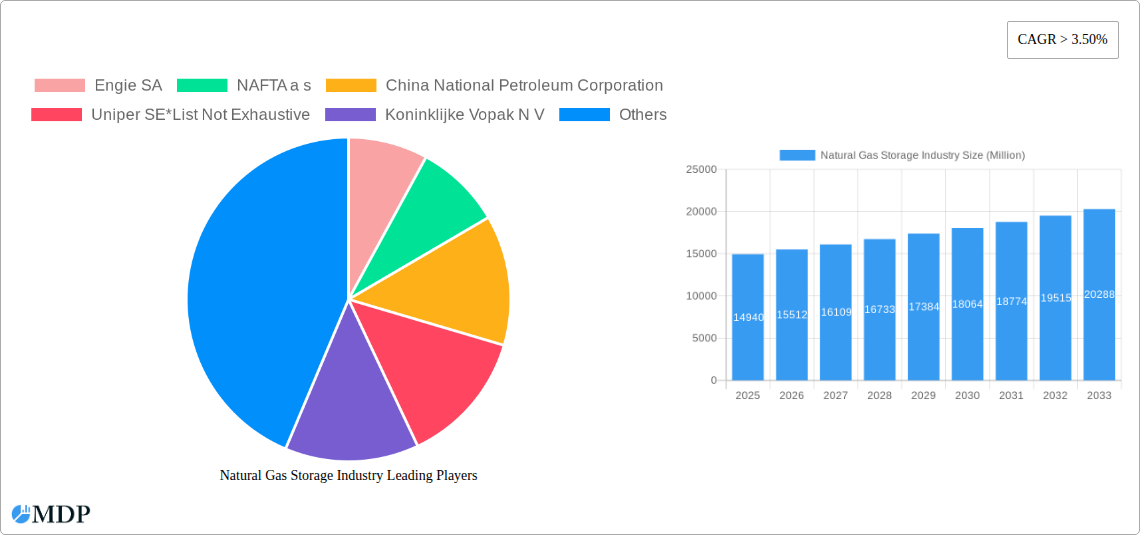
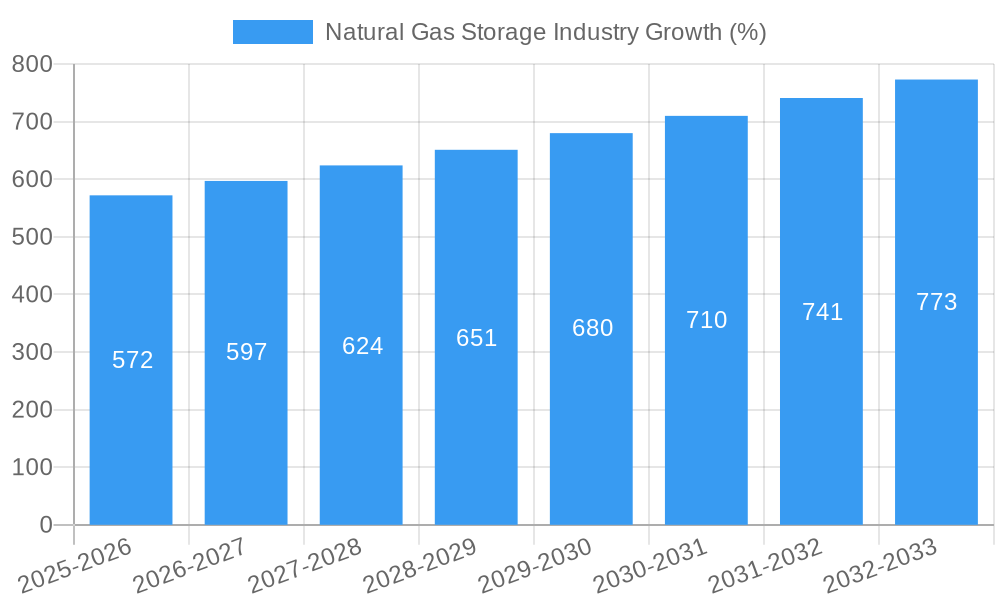
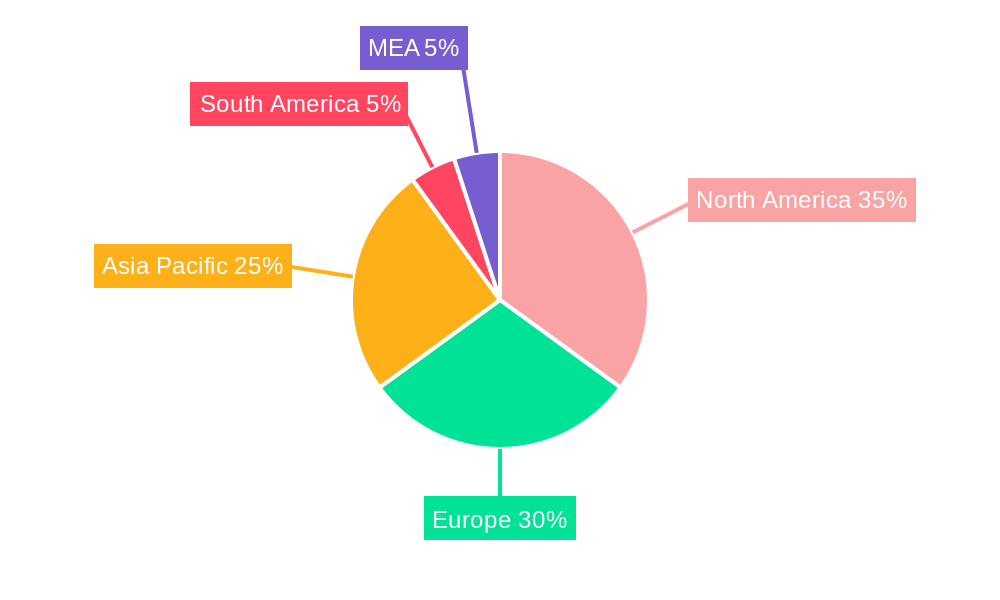
The global natural gas storage market, valued at $14,940 million in 2025, is projected to experience robust growth, driven by increasing energy demand, the need for energy security, and the fluctuating nature of natural gas supply. The compound annual growth rate (CAGR) exceeding 3.50% from 2025 to 2033 indicates a significant expansion in market size. Key drivers include the growing adoption of renewable energy sources, which often require flexible storage solutions like natural gas to balance intermittent supply, and the increasing focus on reducing carbon emissions, with natural gas serving as a transition fuel. Furthermore, government initiatives promoting energy infrastructure development and stringent environmental regulations are creating favorable conditions for market growth. The market is segmented into underground and above-ground storage, with underground storage currently dominating due to its higher capacity and cost-effectiveness. Major players like Engie SA, Uniper SE, and Koninklijke Vopak N.V. are shaping the market through technological advancements and strategic partnerships. Geographic expansion is also a prominent trend, with North America and Europe representing significant market shares, while the Asia-Pacific region is expected to witness accelerated growth due to increasing industrialization and urbanization. However, challenges such as high initial investment costs for storage infrastructure and potential environmental concerns related to underground storage could pose some restraints on overall market growth.
The market's future hinges on successful navigation of these challenges. Technological advancements in storage solutions, such as improved safety features for underground storage and the development of innovative above-ground storage technologies, will be crucial. Government policies supporting sustainable energy transitions while ensuring energy security will play a vital role in market growth. The competitive landscape will remain dynamic, with existing players striving for market share consolidation and new entrants seeking opportunities in emerging markets. Continued focus on improving operational efficiency, exploring alternative storage solutions, and addressing environmental concerns will be paramount for the sustainable development of the natural gas storage market. This market will thrive through a complex interplay of technological advancements, regulatory landscapes, and strategic partnerships.
Natural Gas Storage Industry Report: 2019-2033 Forecast
This comprehensive report provides an in-depth analysis of the global natural gas storage industry, offering invaluable insights for stakeholders, investors, and industry professionals. Covering the period from 2019 to 2033, with a focus on 2025, this report meticulously examines market dynamics, key players, technological advancements, and future growth prospects. Expect detailed breakdowns of market segments, regional analysis, and actionable strategies for success in this dynamic sector.
Natural Gas Storage Industry Market Dynamics & Concentration
The natural gas storage market, valued at xx Million in 2025, exhibits a moderately concentrated landscape. Key players such as Engie SA, Engie SA, NAFTA a s, China National Petroleum Corporation, Uniper SE, Koninklijke Vopak N V, Enbridge Inc, Chiyoda Corporation, John Wood Group PLC, Gazprom PAO, and Costain Group PLC hold significant market share, with the top 5 accounting for approximately xx% of the total market. However, the emergence of smaller, specialized companies, particularly those focusing on innovative storage technologies, is challenging this concentration.
Market dynamics are shaped by several factors:
- Innovation Drivers: Technological advancements, particularly in underground storage techniques and above-ground liquefied natural gas (LNG) storage, are driving market expansion.
- Regulatory Frameworks: Government regulations concerning gas safety, environmental impact, and grid infrastructure significantly influence investment decisions and market access.
- Product Substitutes: While natural gas remains a dominant energy source, competition from renewable energy sources and other fuels necessitates continuous innovation to maintain market share.
- End-User Trends: Fluctuating energy demand from industrial and residential sectors affects storage needs and pricing dynamics.
- M&A Activities: The past five years have witnessed xx M&A deals, primarily focused on consolidating market share and gaining access to new technologies or geographic markets.
Natural Gas Storage Industry Industry Trends & Analysis
The global natural gas storage market is projected to experience a Compound Annual Growth Rate (CAGR) of xx% during the forecast period (2025-2033). This growth is fueled by several key trends:
- Increasing Global Energy Demand: Growing industrialization and population growth in emerging economies are driving higher energy consumption, leading to increased demand for efficient and reliable natural gas storage solutions.
- Technological Disruptions: Innovations in storage technologies, such as advanced materials for underground storage and improved efficiency in above-ground storage, are enhancing capacity and reducing operational costs. This includes the increased adoption of xx technology which is expected to penetrate xx% of the market by 2033.
- Government Support and Policies: Many governments are actively promoting natural gas as a transition fuel, leading to increased investment in storage infrastructure and supportive regulatory frameworks. For example, the European Union’s commitment to diversifying energy sources is expected to add xx Million to the market in the next 5 years.
- Shifting Consumer Preferences: The increasing focus on energy security and resilience is pushing governments and businesses to invest more in natural gas storage to mitigate supply disruptions and price volatility. This trend is particularly strong in regions with limited domestic gas production.
- Competitive Dynamics: Intense competition among established players and the emergence of new market entrants are driving innovation and efficiency improvements in the industry. This includes increased focus on reducing carbon emissions through more efficient storage techniques.
Leading Markets & Segments in Natural Gas Storage Industry
The North American region currently dominates the natural gas storage market, accounting for approximately xx% of the global capacity in 2025. Within this region, the United States leads with significant infrastructure development.
- Underground Storage: The dominance of underground storage is driven by its high storage capacity and lower cost compared to above-ground solutions. This segment is forecast to grow at a CAGR of xx% from 2025 to 2033. Key drivers include:
- Extensive existing infrastructure in mature markets
- Favorable geological conditions in several regions
- Government incentives for expanding underground storage capacity
- Above-Ground Storage: While holding a smaller market share compared to underground storage, above-ground storage (particularly LNG storage) is witnessing significant growth, driven by:
- Technological advancements, such as improved tank designs and materials, enhancing storage efficiency and safety.
- Growing demand for LNG imports and exports globally
- Investments in LNG infrastructure in developing countries.
The European market is also a significant contributor, with substantial investment in expanding storage capacity in response to geopolitical uncertainties. Asia is expected to experience considerable growth, fueled by increasing energy consumption and industrialization.
Natural Gas Storage Industry Product Developments
Recent product innovations are focused on enhancing efficiency, safety, and environmental sustainability. This includes the development of advanced materials for underground storage, improved insulation technologies for above-ground storage, and the integration of smart sensors for real-time monitoring and control. These advancements enable better management of storage capacity, reduced operational costs, and minimized environmental impact, improving the overall market fit and competitive advantage of new products.
Key Drivers of Natural Gas Storage Industry Growth
Several factors are driving the expansion of the natural gas storage industry:
- The increasing demand for natural gas as a transition fuel in a world transitioning to cleaner energy sources.
- Government policies promoting the development of natural gas infrastructure.
- Advances in storage technologies that enhance efficiency, safety, and sustainability.
- Growing investments in LNG infrastructure in both developed and developing countries.
Challenges in the Natural Gas Storage Industry Market
The natural gas storage industry faces several challenges:
- Stricter environmental regulations and the need to reduce the carbon footprint of gas storage operations. This requires investments in carbon capture technologies that add approximately xx Million annually to operational costs.
- Supply chain disruptions and price volatility of raw materials affect the construction and maintenance of storage facilities.
- Competition from renewable energy sources, which can impact the long-term demand for natural gas.
Emerging Opportunities in Natural Gas Storage Industry
Significant opportunities exist for growth in the natural gas storage sector:
- The development and deployment of advanced storage technologies, such as compressed air energy storage (CAES) integrated with natural gas storage.
- Strategic partnerships between storage operators and renewable energy providers to offer integrated energy solutions.
- Expansion of storage capacity in emerging markets with growing energy demands.
Leading Players in the Natural Gas Storage Industry Sector
- Engie SA
- NAFTA a s
- China National Petroleum Corporation
- Uniper SE
- Koninklijke Vopak N V
- Enbridge Inc
- Chiyoda Corporation
- John Wood Group PLC
- Gazprom PAO
- Costain Group PLC
Key Milestones in Natural Gas Storage Industry Industry
- 2020: Significant investment in upgrading underground storage facilities in Europe.
- 2021: Launch of a new LNG import terminal in Asia, boosting regional storage capacity.
- 2022: Introduction of a novel, environmentally friendly sealant for underground storage by a leading technology provider, improving safety and longevity of underground facilities.
- 2023: Government approval for expansion of an existing underground storage facility in North America, increasing capacity by xx Million cubic meters.
- 2024: A major partnership between two storage operators increases efficiency through shared resources and expertise, representing a consolidation of market share.
Strategic Outlook for Natural Gas Storage Industry Market
The future of the natural gas storage industry is bright, driven by sustained demand for natural gas, technological advancements, and strategic partnerships. The market is poised for considerable growth, with expanding capacity in key regions and increasing diversification of storage technologies. Focused investments in sustainable and efficient solutions, alongside proactive regulatory engagement, will be key to unlocking this future market potential.
Natural Gas Storage Industry Segmentation
-
1. Type
- 1.1. Underground Storage
- 1.2. Above-Ground Storage
Natural Gas Storage Industry Segmentation By Geography
- 1. North America
- 2. Europe
- 3. Asia Pacific
- 4. South America
- 5. Middle East and Africa
Natural Gas Storage Industry REPORT HIGHLIGHTS
| Aspects | Details |
|---|---|
| Study Period | 2019-2033 |
| Base Year | 2024 |
| Estimated Year | 2025 |
| Forecast Period | 2025-2033 |
| Historical Period | 2019-2024 |
| Growth Rate | CAGR of > 3.50% from 2019-2033 |
| Segmentation |
|
Table of Contents
- 1. Introduction
- 1.1. Research Scope
- 1.2. Market Segmentation
- 1.3. Research Methodology
- 1.4. Definitions and Assumptions
- 2. Executive Summary
- 2.1. Introduction
- 3. Market Dynamics
- 3.1. Introduction
- 3.2. Market Drivers
- 3.2.1. 4.; Increasing Electricity Demand4.; Rsing Investments in the Coal Industry
- 3.3. Market Restrains
- 3.3.1. 4.; Increasing Installation of Renewable Energy Sources
- 3.4. Market Trends
- 3.4.1. Underground Storage to Dominate the Market
- 4. Market Factor Analysis
- 4.1. Porters Five Forces
- 4.2. Supply/Value Chain
- 4.3. PESTEL analysis
- 4.4. Market Entropy
- 4.5. Patent/Trademark Analysis
- 5. Global Natural Gas Storage Industry Analysis, Insights and Forecast, 2019-2031
- 5.1. Market Analysis, Insights and Forecast - by Type
- 5.1.1. Underground Storage
- 5.1.2. Above-Ground Storage
- 5.2. Market Analysis, Insights and Forecast - by Region
- 5.2.1. North America
- 5.2.2. Europe
- 5.2.3. Asia Pacific
- 5.2.4. South America
- 5.2.5. Middle East and Africa
- 5.1. Market Analysis, Insights and Forecast - by Type
- 6. North America Natural Gas Storage Industry Analysis, Insights and Forecast, 2019-2031
- 6.1. Market Analysis, Insights and Forecast - by Type
- 6.1.1. Underground Storage
- 6.1.2. Above-Ground Storage
- 6.1. Market Analysis, Insights and Forecast - by Type
- 7. Europe Natural Gas Storage Industry Analysis, Insights and Forecast, 2019-2031
- 7.1. Market Analysis, Insights and Forecast - by Type
- 7.1.1. Underground Storage
- 7.1.2. Above-Ground Storage
- 7.1. Market Analysis, Insights and Forecast - by Type
- 8. Asia Pacific Natural Gas Storage Industry Analysis, Insights and Forecast, 2019-2031
- 8.1. Market Analysis, Insights and Forecast - by Type
- 8.1.1. Underground Storage
- 8.1.2. Above-Ground Storage
- 8.1. Market Analysis, Insights and Forecast - by Type
- 9. South America Natural Gas Storage Industry Analysis, Insights and Forecast, 2019-2031
- 9.1. Market Analysis, Insights and Forecast - by Type
- 9.1.1. Underground Storage
- 9.1.2. Above-Ground Storage
- 9.1. Market Analysis, Insights and Forecast - by Type
- 10. Middle East and Africa Natural Gas Storage Industry Analysis, Insights and Forecast, 2019-2031
- 10.1. Market Analysis, Insights and Forecast - by Type
- 10.1.1. Underground Storage
- 10.1.2. Above-Ground Storage
- 10.1. Market Analysis, Insights and Forecast - by Type
- 11. North America Natural Gas Storage Industry Analysis, Insights and Forecast, 2019-2031
- 11.1. Market Analysis, Insights and Forecast - By Country/Sub-region
- 11.1.1 United States
- 11.1.2 Canada
- 11.1.3 Mexico
- 12. Europe Natural Gas Storage Industry Analysis, Insights and Forecast, 2019-2031
- 12.1. Market Analysis, Insights and Forecast - By Country/Sub-region
- 12.1.1 Germany
- 12.1.2 United Kingdom
- 12.1.3 France
- 12.1.4 Spain
- 12.1.5 Italy
- 12.1.6 Spain
- 12.1.7 Belgium
- 12.1.8 Netherland
- 12.1.9 Nordics
- 12.1.10 Rest of Europe
- 13. Asia Pacific Natural Gas Storage Industry Analysis, Insights and Forecast, 2019-2031
- 13.1. Market Analysis, Insights and Forecast - By Country/Sub-region
- 13.1.1 China
- 13.1.2 Japan
- 13.1.3 India
- 13.1.4 South Korea
- 13.1.5 Southeast Asia
- 13.1.6 Australia
- 13.1.7 Indonesia
- 13.1.8 Phillipes
- 13.1.9 Singapore
- 13.1.10 Thailandc
- 13.1.11 Rest of Asia Pacific
- 14. South America Natural Gas Storage Industry Analysis, Insights and Forecast, 2019-2031
- 14.1. Market Analysis, Insights and Forecast - By Country/Sub-region
- 14.1.1 Brazil
- 14.1.2 Argentina
- 14.1.3 Peru
- 14.1.4 Chile
- 14.1.5 Colombia
- 14.1.6 Ecuador
- 14.1.7 Venezuela
- 14.1.8 Rest of South America
- 15. North America Natural Gas Storage Industry Analysis, Insights and Forecast, 2019-2031
- 15.1. Market Analysis, Insights and Forecast - By Country/Sub-region
- 15.1.1 United States
- 15.1.2 Canada
- 15.1.3 Mexico
- 16. MEA Natural Gas Storage Industry Analysis, Insights and Forecast, 2019-2031
- 16.1. Market Analysis, Insights and Forecast - By Country/Sub-region
- 16.1.1 United Arab Emirates
- 16.1.2 Saudi Arabia
- 16.1.3 South Africa
- 16.1.4 Rest of Middle East and Africa
- 17. Competitive Analysis
- 17.1. Global Market Share Analysis 2024
- 17.2. Company Profiles
- 17.2.1 Engie SA
- 17.2.1.1. Overview
- 17.2.1.2. Products
- 17.2.1.3. SWOT Analysis
- 17.2.1.4. Recent Developments
- 17.2.1.5. Financials (Based on Availability)
- 17.2.2 NAFTA a s
- 17.2.2.1. Overview
- 17.2.2.2. Products
- 17.2.2.3. SWOT Analysis
- 17.2.2.4. Recent Developments
- 17.2.2.5. Financials (Based on Availability)
- 17.2.3 China National Petroleum Corporation
- 17.2.3.1. Overview
- 17.2.3.2. Products
- 17.2.3.3. SWOT Analysis
- 17.2.3.4. Recent Developments
- 17.2.3.5. Financials (Based on Availability)
- 17.2.4 Uniper SE*List Not Exhaustive
- 17.2.4.1. Overview
- 17.2.4.2. Products
- 17.2.4.3. SWOT Analysis
- 17.2.4.4. Recent Developments
- 17.2.4.5. Financials (Based on Availability)
- 17.2.5 Koninklijke Vopak N V
- 17.2.5.1. Overview
- 17.2.5.2. Products
- 17.2.5.3. SWOT Analysis
- 17.2.5.4. Recent Developments
- 17.2.5.5. Financials (Based on Availability)
- 17.2.6 Enbridge Inc
- 17.2.6.1. Overview
- 17.2.6.2. Products
- 17.2.6.3. SWOT Analysis
- 17.2.6.4. Recent Developments
- 17.2.6.5. Financials (Based on Availability)
- 17.2.7 Chiyoda Corporation
- 17.2.7.1. Overview
- 17.2.7.2. Products
- 17.2.7.3. SWOT Analysis
- 17.2.7.4. Recent Developments
- 17.2.7.5. Financials (Based on Availability)
- 17.2.8 John Wood Group PLC
- 17.2.8.1. Overview
- 17.2.8.2. Products
- 17.2.8.3. SWOT Analysis
- 17.2.8.4. Recent Developments
- 17.2.8.5. Financials (Based on Availability)
- 17.2.9 Gazprom PAO
- 17.2.9.1. Overview
- 17.2.9.2. Products
- 17.2.9.3. SWOT Analysis
- 17.2.9.4. Recent Developments
- 17.2.9.5. Financials (Based on Availability)
- 17.2.10 Costain Group PLC
- 17.2.10.1. Overview
- 17.2.10.2. Products
- 17.2.10.3. SWOT Analysis
- 17.2.10.4. Recent Developments
- 17.2.10.5. Financials (Based on Availability)
- 17.2.1 Engie SA
List of Figures
- Figure 1: Global Natural Gas Storage Industry Revenue Breakdown (Million, %) by Region 2024 & 2032
- Figure 2: Global Natural Gas Storage Industry Volume Breakdown (K Tons, %) by Region 2024 & 2032
- Figure 3: North America Natural Gas Storage Industry Revenue (Million), by Country 2024 & 2032
- Figure 4: North America Natural Gas Storage Industry Volume (K Tons), by Country 2024 & 2032
- Figure 5: North America Natural Gas Storage Industry Revenue Share (%), by Country 2024 & 2032
- Figure 6: North America Natural Gas Storage Industry Volume Share (%), by Country 2024 & 2032
- Figure 7: Europe Natural Gas Storage Industry Revenue (Million), by Country 2024 & 2032
- Figure 8: Europe Natural Gas Storage Industry Volume (K Tons), by Country 2024 & 2032
- Figure 9: Europe Natural Gas Storage Industry Revenue Share (%), by Country 2024 & 2032
- Figure 10: Europe Natural Gas Storage Industry Volume Share (%), by Country 2024 & 2032
- Figure 11: Asia Pacific Natural Gas Storage Industry Revenue (Million), by Country 2024 & 2032
- Figure 12: Asia Pacific Natural Gas Storage Industry Volume (K Tons), by Country 2024 & 2032
- Figure 13: Asia Pacific Natural Gas Storage Industry Revenue Share (%), by Country 2024 & 2032
- Figure 14: Asia Pacific Natural Gas Storage Industry Volume Share (%), by Country 2024 & 2032
- Figure 15: South America Natural Gas Storage Industry Revenue (Million), by Country 2024 & 2032
- Figure 16: South America Natural Gas Storage Industry Volume (K Tons), by Country 2024 & 2032
- Figure 17: South America Natural Gas Storage Industry Revenue Share (%), by Country 2024 & 2032
- Figure 18: South America Natural Gas Storage Industry Volume Share (%), by Country 2024 & 2032
- Figure 19: North America Natural Gas Storage Industry Revenue (Million), by Country 2024 & 2032
- Figure 20: North America Natural Gas Storage Industry Volume (K Tons), by Country 2024 & 2032
- Figure 21: North America Natural Gas Storage Industry Revenue Share (%), by Country 2024 & 2032
- Figure 22: North America Natural Gas Storage Industry Volume Share (%), by Country 2024 & 2032
- Figure 23: MEA Natural Gas Storage Industry Revenue (Million), by Country 2024 & 2032
- Figure 24: MEA Natural Gas Storage Industry Volume (K Tons), by Country 2024 & 2032
- Figure 25: MEA Natural Gas Storage Industry Revenue Share (%), by Country 2024 & 2032
- Figure 26: MEA Natural Gas Storage Industry Volume Share (%), by Country 2024 & 2032
- Figure 27: North America Natural Gas Storage Industry Revenue (Million), by Type 2024 & 2032
- Figure 28: North America Natural Gas Storage Industry Volume (K Tons), by Type 2024 & 2032
- Figure 29: North America Natural Gas Storage Industry Revenue Share (%), by Type 2024 & 2032
- Figure 30: North America Natural Gas Storage Industry Volume Share (%), by Type 2024 & 2032
- Figure 31: North America Natural Gas Storage Industry Revenue (Million), by Country 2024 & 2032
- Figure 32: North America Natural Gas Storage Industry Volume (K Tons), by Country 2024 & 2032
- Figure 33: North America Natural Gas Storage Industry Revenue Share (%), by Country 2024 & 2032
- Figure 34: North America Natural Gas Storage Industry Volume Share (%), by Country 2024 & 2032
- Figure 35: Europe Natural Gas Storage Industry Revenue (Million), by Type 2024 & 2032
- Figure 36: Europe Natural Gas Storage Industry Volume (K Tons), by Type 2024 & 2032
- Figure 37: Europe Natural Gas Storage Industry Revenue Share (%), by Type 2024 & 2032
- Figure 38: Europe Natural Gas Storage Industry Volume Share (%), by Type 2024 & 2032
- Figure 39: Europe Natural Gas Storage Industry Revenue (Million), by Country 2024 & 2032
- Figure 40: Europe Natural Gas Storage Industry Volume (K Tons), by Country 2024 & 2032
- Figure 41: Europe Natural Gas Storage Industry Revenue Share (%), by Country 2024 & 2032
- Figure 42: Europe Natural Gas Storage Industry Volume Share (%), by Country 2024 & 2032
- Figure 43: Asia Pacific Natural Gas Storage Industry Revenue (Million), by Type 2024 & 2032
- Figure 44: Asia Pacific Natural Gas Storage Industry Volume (K Tons), by Type 2024 & 2032
- Figure 45: Asia Pacific Natural Gas Storage Industry Revenue Share (%), by Type 2024 & 2032
- Figure 46: Asia Pacific Natural Gas Storage Industry Volume Share (%), by Type 2024 & 2032
- Figure 47: Asia Pacific Natural Gas Storage Industry Revenue (Million), by Country 2024 & 2032
- Figure 48: Asia Pacific Natural Gas Storage Industry Volume (K Tons), by Country 2024 & 2032
- Figure 49: Asia Pacific Natural Gas Storage Industry Revenue Share (%), by Country 2024 & 2032
- Figure 50: Asia Pacific Natural Gas Storage Industry Volume Share (%), by Country 2024 & 2032
- Figure 51: South America Natural Gas Storage Industry Revenue (Million), by Type 2024 & 2032
- Figure 52: South America Natural Gas Storage Industry Volume (K Tons), by Type 2024 & 2032
- Figure 53: South America Natural Gas Storage Industry Revenue Share (%), by Type 2024 & 2032
- Figure 54: South America Natural Gas Storage Industry Volume Share (%), by Type 2024 & 2032
- Figure 55: South America Natural Gas Storage Industry Revenue (Million), by Country 2024 & 2032
- Figure 56: South America Natural Gas Storage Industry Volume (K Tons), by Country 2024 & 2032
- Figure 57: South America Natural Gas Storage Industry Revenue Share (%), by Country 2024 & 2032
- Figure 58: South America Natural Gas Storage Industry Volume Share (%), by Country 2024 & 2032
- Figure 59: Middle East and Africa Natural Gas Storage Industry Revenue (Million), by Type 2024 & 2032
- Figure 60: Middle East and Africa Natural Gas Storage Industry Volume (K Tons), by Type 2024 & 2032
- Figure 61: Middle East and Africa Natural Gas Storage Industry Revenue Share (%), by Type 2024 & 2032
- Figure 62: Middle East and Africa Natural Gas Storage Industry Volume Share (%), by Type 2024 & 2032
- Figure 63: Middle East and Africa Natural Gas Storage Industry Revenue (Million), by Country 2024 & 2032
- Figure 64: Middle East and Africa Natural Gas Storage Industry Volume (K Tons), by Country 2024 & 2032
- Figure 65: Middle East and Africa Natural Gas Storage Industry Revenue Share (%), by Country 2024 & 2032
- Figure 66: Middle East and Africa Natural Gas Storage Industry Volume Share (%), by Country 2024 & 2032
List of Tables
- Table 1: Global Natural Gas Storage Industry Revenue Million Forecast, by Region 2019 & 2032
- Table 2: Global Natural Gas Storage Industry Volume K Tons Forecast, by Region 2019 & 2032
- Table 3: Global Natural Gas Storage Industry Revenue Million Forecast, by Type 2019 & 2032
- Table 4: Global Natural Gas Storage Industry Volume K Tons Forecast, by Type 2019 & 2032
- Table 5: Global Natural Gas Storage Industry Revenue Million Forecast, by Region 2019 & 2032
- Table 6: Global Natural Gas Storage Industry Volume K Tons Forecast, by Region 2019 & 2032
- Table 7: Global Natural Gas Storage Industry Revenue Million Forecast, by Country 2019 & 2032
- Table 8: Global Natural Gas Storage Industry Volume K Tons Forecast, by Country 2019 & 2032
- Table 9: United States Natural Gas Storage Industry Revenue (Million) Forecast, by Application 2019 & 2032
- Table 10: United States Natural Gas Storage Industry Volume (K Tons) Forecast, by Application 2019 & 2032
- Table 11: Canada Natural Gas Storage Industry Revenue (Million) Forecast, by Application 2019 & 2032
- Table 12: Canada Natural Gas Storage Industry Volume (K Tons) Forecast, by Application 2019 & 2032
- Table 13: Mexico Natural Gas Storage Industry Revenue (Million) Forecast, by Application 2019 & 2032
- Table 14: Mexico Natural Gas Storage Industry Volume (K Tons) Forecast, by Application 2019 & 2032
- Table 15: Global Natural Gas Storage Industry Revenue Million Forecast, by Country 2019 & 2032
- Table 16: Global Natural Gas Storage Industry Volume K Tons Forecast, by Country 2019 & 2032
- Table 17: Germany Natural Gas Storage Industry Revenue (Million) Forecast, by Application 2019 & 2032
- Table 18: Germany Natural Gas Storage Industry Volume (K Tons) Forecast, by Application 2019 & 2032
- Table 19: United Kingdom Natural Gas Storage Industry Revenue (Million) Forecast, by Application 2019 & 2032
- Table 20: United Kingdom Natural Gas Storage Industry Volume (K Tons) Forecast, by Application 2019 & 2032
- Table 21: France Natural Gas Storage Industry Revenue (Million) Forecast, by Application 2019 & 2032
- Table 22: France Natural Gas Storage Industry Volume (K Tons) Forecast, by Application 2019 & 2032
- Table 23: Spain Natural Gas Storage Industry Revenue (Million) Forecast, by Application 2019 & 2032
- Table 24: Spain Natural Gas Storage Industry Volume (K Tons) Forecast, by Application 2019 & 2032
- Table 25: Italy Natural Gas Storage Industry Revenue (Million) Forecast, by Application 2019 & 2032
- Table 26: Italy Natural Gas Storage Industry Volume (K Tons) Forecast, by Application 2019 & 2032
- Table 27: Spain Natural Gas Storage Industry Revenue (Million) Forecast, by Application 2019 & 2032
- Table 28: Spain Natural Gas Storage Industry Volume (K Tons) Forecast, by Application 2019 & 2032
- Table 29: Belgium Natural Gas Storage Industry Revenue (Million) Forecast, by Application 2019 & 2032
- Table 30: Belgium Natural Gas Storage Industry Volume (K Tons) Forecast, by Application 2019 & 2032
- Table 31: Netherland Natural Gas Storage Industry Revenue (Million) Forecast, by Application 2019 & 2032
- Table 32: Netherland Natural Gas Storage Industry Volume (K Tons) Forecast, by Application 2019 & 2032
- Table 33: Nordics Natural Gas Storage Industry Revenue (Million) Forecast, by Application 2019 & 2032
- Table 34: Nordics Natural Gas Storage Industry Volume (K Tons) Forecast, by Application 2019 & 2032
- Table 35: Rest of Europe Natural Gas Storage Industry Revenue (Million) Forecast, by Application 2019 & 2032
- Table 36: Rest of Europe Natural Gas Storage Industry Volume (K Tons) Forecast, by Application 2019 & 2032
- Table 37: Global Natural Gas Storage Industry Revenue Million Forecast, by Country 2019 & 2032
- Table 38: Global Natural Gas Storage Industry Volume K Tons Forecast, by Country 2019 & 2032
- Table 39: China Natural Gas Storage Industry Revenue (Million) Forecast, by Application 2019 & 2032
- Table 40: China Natural Gas Storage Industry Volume (K Tons) Forecast, by Application 2019 & 2032
- Table 41: Japan Natural Gas Storage Industry Revenue (Million) Forecast, by Application 2019 & 2032
- Table 42: Japan Natural Gas Storage Industry Volume (K Tons) Forecast, by Application 2019 & 2032
- Table 43: India Natural Gas Storage Industry Revenue (Million) Forecast, by Application 2019 & 2032
- Table 44: India Natural Gas Storage Industry Volume (K Tons) Forecast, by Application 2019 & 2032
- Table 45: South Korea Natural Gas Storage Industry Revenue (Million) Forecast, by Application 2019 & 2032
- Table 46: South Korea Natural Gas Storage Industry Volume (K Tons) Forecast, by Application 2019 & 2032
- Table 47: Southeast Asia Natural Gas Storage Industry Revenue (Million) Forecast, by Application 2019 & 2032
- Table 48: Southeast Asia Natural Gas Storage Industry Volume (K Tons) Forecast, by Application 2019 & 2032
- Table 49: Australia Natural Gas Storage Industry Revenue (Million) Forecast, by Application 2019 & 2032
- Table 50: Australia Natural Gas Storage Industry Volume (K Tons) Forecast, by Application 2019 & 2032
- Table 51: Indonesia Natural Gas Storage Industry Revenue (Million) Forecast, by Application 2019 & 2032
- Table 52: Indonesia Natural Gas Storage Industry Volume (K Tons) Forecast, by Application 2019 & 2032
- Table 53: Phillipes Natural Gas Storage Industry Revenue (Million) Forecast, by Application 2019 & 2032
- Table 54: Phillipes Natural Gas Storage Industry Volume (K Tons) Forecast, by Application 2019 & 2032
- Table 55: Singapore Natural Gas Storage Industry Revenue (Million) Forecast, by Application 2019 & 2032
- Table 56: Singapore Natural Gas Storage Industry Volume (K Tons) Forecast, by Application 2019 & 2032
- Table 57: Thailandc Natural Gas Storage Industry Revenue (Million) Forecast, by Application 2019 & 2032
- Table 58: Thailandc Natural Gas Storage Industry Volume (K Tons) Forecast, by Application 2019 & 2032
- Table 59: Rest of Asia Pacific Natural Gas Storage Industry Revenue (Million) Forecast, by Application 2019 & 2032
- Table 60: Rest of Asia Pacific Natural Gas Storage Industry Volume (K Tons) Forecast, by Application 2019 & 2032
- Table 61: Global Natural Gas Storage Industry Revenue Million Forecast, by Country 2019 & 2032
- Table 62: Global Natural Gas Storage Industry Volume K Tons Forecast, by Country 2019 & 2032
- Table 63: Brazil Natural Gas Storage Industry Revenue (Million) Forecast, by Application 2019 & 2032
- Table 64: Brazil Natural Gas Storage Industry Volume (K Tons) Forecast, by Application 2019 & 2032
- Table 65: Argentina Natural Gas Storage Industry Revenue (Million) Forecast, by Application 2019 & 2032
- Table 66: Argentina Natural Gas Storage Industry Volume (K Tons) Forecast, by Application 2019 & 2032
- Table 67: Peru Natural Gas Storage Industry Revenue (Million) Forecast, by Application 2019 & 2032
- Table 68: Peru Natural Gas Storage Industry Volume (K Tons) Forecast, by Application 2019 & 2032
- Table 69: Chile Natural Gas Storage Industry Revenue (Million) Forecast, by Application 2019 & 2032
- Table 70: Chile Natural Gas Storage Industry Volume (K Tons) Forecast, by Application 2019 & 2032
- Table 71: Colombia Natural Gas Storage Industry Revenue (Million) Forecast, by Application 2019 & 2032
- Table 72: Colombia Natural Gas Storage Industry Volume (K Tons) Forecast, by Application 2019 & 2032
- Table 73: Ecuador Natural Gas Storage Industry Revenue (Million) Forecast, by Application 2019 & 2032
- Table 74: Ecuador Natural Gas Storage Industry Volume (K Tons) Forecast, by Application 2019 & 2032
- Table 75: Venezuela Natural Gas Storage Industry Revenue (Million) Forecast, by Application 2019 & 2032
- Table 76: Venezuela Natural Gas Storage Industry Volume (K Tons) Forecast, by Application 2019 & 2032
- Table 77: Rest of South America Natural Gas Storage Industry Revenue (Million) Forecast, by Application 2019 & 2032
- Table 78: Rest of South America Natural Gas Storage Industry Volume (K Tons) Forecast, by Application 2019 & 2032
- Table 79: Global Natural Gas Storage Industry Revenue Million Forecast, by Country 2019 & 2032
- Table 80: Global Natural Gas Storage Industry Volume K Tons Forecast, by Country 2019 & 2032
- Table 81: United States Natural Gas Storage Industry Revenue (Million) Forecast, by Application 2019 & 2032
- Table 82: United States Natural Gas Storage Industry Volume (K Tons) Forecast, by Application 2019 & 2032
- Table 83: Canada Natural Gas Storage Industry Revenue (Million) Forecast, by Application 2019 & 2032
- Table 84: Canada Natural Gas Storage Industry Volume (K Tons) Forecast, by Application 2019 & 2032
- Table 85: Mexico Natural Gas Storage Industry Revenue (Million) Forecast, by Application 2019 & 2032
- Table 86: Mexico Natural Gas Storage Industry Volume (K Tons) Forecast, by Application 2019 & 2032
- Table 87: Global Natural Gas Storage Industry Revenue Million Forecast, by Country 2019 & 2032
- Table 88: Global Natural Gas Storage Industry Volume K Tons Forecast, by Country 2019 & 2032
- Table 89: United Arab Emirates Natural Gas Storage Industry Revenue (Million) Forecast, by Application 2019 & 2032
- Table 90: United Arab Emirates Natural Gas Storage Industry Volume (K Tons) Forecast, by Application 2019 & 2032
- Table 91: Saudi Arabia Natural Gas Storage Industry Revenue (Million) Forecast, by Application 2019 & 2032
- Table 92: Saudi Arabia Natural Gas Storage Industry Volume (K Tons) Forecast, by Application 2019 & 2032
- Table 93: South Africa Natural Gas Storage Industry Revenue (Million) Forecast, by Application 2019 & 2032
- Table 94: South Africa Natural Gas Storage Industry Volume (K Tons) Forecast, by Application 2019 & 2032
- Table 95: Rest of Middle East and Africa Natural Gas Storage Industry Revenue (Million) Forecast, by Application 2019 & 2032
- Table 96: Rest of Middle East and Africa Natural Gas Storage Industry Volume (K Tons) Forecast, by Application 2019 & 2032
- Table 97: Global Natural Gas Storage Industry Revenue Million Forecast, by Type 2019 & 2032
- Table 98: Global Natural Gas Storage Industry Volume K Tons Forecast, by Type 2019 & 2032
- Table 99: Global Natural Gas Storage Industry Revenue Million Forecast, by Country 2019 & 2032
- Table 100: Global Natural Gas Storage Industry Volume K Tons Forecast, by Country 2019 & 2032
- Table 101: Global Natural Gas Storage Industry Revenue Million Forecast, by Type 2019 & 2032
- Table 102: Global Natural Gas Storage Industry Volume K Tons Forecast, by Type 2019 & 2032
- Table 103: Global Natural Gas Storage Industry Revenue Million Forecast, by Country 2019 & 2032
- Table 104: Global Natural Gas Storage Industry Volume K Tons Forecast, by Country 2019 & 2032
- Table 105: Global Natural Gas Storage Industry Revenue Million Forecast, by Type 2019 & 2032
- Table 106: Global Natural Gas Storage Industry Volume K Tons Forecast, by Type 2019 & 2032
- Table 107: Global Natural Gas Storage Industry Revenue Million Forecast, by Country 2019 & 2032
- Table 108: Global Natural Gas Storage Industry Volume K Tons Forecast, by Country 2019 & 2032
- Table 109: Global Natural Gas Storage Industry Revenue Million Forecast, by Type 2019 & 2032
- Table 110: Global Natural Gas Storage Industry Volume K Tons Forecast, by Type 2019 & 2032
- Table 111: Global Natural Gas Storage Industry Revenue Million Forecast, by Country 2019 & 2032
- Table 112: Global Natural Gas Storage Industry Volume K Tons Forecast, by Country 2019 & 2032
- Table 113: Global Natural Gas Storage Industry Revenue Million Forecast, by Type 2019 & 2032
- Table 114: Global Natural Gas Storage Industry Volume K Tons Forecast, by Type 2019 & 2032
- Table 115: Global Natural Gas Storage Industry Revenue Million Forecast, by Country 2019 & 2032
- Table 116: Global Natural Gas Storage Industry Volume K Tons Forecast, by Country 2019 & 2032
Frequently Asked Questions
1. What is the projected Compound Annual Growth Rate (CAGR) of the Natural Gas Storage Industry?
The projected CAGR is approximately > 3.50%.
2. Which companies are prominent players in the Natural Gas Storage Industry?
Key companies in the market include Engie SA, NAFTA a s, China National Petroleum Corporation, Uniper SE*List Not Exhaustive, Koninklijke Vopak N V, Enbridge Inc, Chiyoda Corporation, John Wood Group PLC, Gazprom PAO, Costain Group PLC.
3. What are the main segments of the Natural Gas Storage Industry?
The market segments include Type.
4. Can you provide details about the market size?
The market size is estimated to be USD 14940 Million as of 2022.
5. What are some drivers contributing to market growth?
4.; Increasing Electricity Demand4.; Rsing Investments in the Coal Industry.
6. What are the notable trends driving market growth?
Underground Storage to Dominate the Market.
7. Are there any restraints impacting market growth?
4.; Increasing Installation of Renewable Energy Sources.
8. Can you provide examples of recent developments in the market?
Technological innovations in storage systems
9. What pricing options are available for accessing the report?
Pricing options include single-user, multi-user, and enterprise licenses priced at USD 4750, USD 5250, and USD 8750 respectively.
10. Is the market size provided in terms of value or volume?
The market size is provided in terms of value, measured in Million and volume, measured in K Tons.
11. Are there any specific market keywords associated with the report?
Yes, the market keyword associated with the report is "Natural Gas Storage Industry," which aids in identifying and referencing the specific market segment covered.
12. How do I determine which pricing option suits my needs best?
The pricing options vary based on user requirements and access needs. Individual users may opt for single-user licenses, while businesses requiring broader access may choose multi-user or enterprise licenses for cost-effective access to the report.
13. Are there any additional resources or data provided in the Natural Gas Storage Industry report?
While the report offers comprehensive insights, it's advisable to review the specific contents or supplementary materials provided to ascertain if additional resources or data are available.
14. How can I stay updated on further developments or reports in the Natural Gas Storage Industry?
To stay informed about further developments, trends, and reports in the Natural Gas Storage Industry, consider subscribing to industry newsletters, following relevant companies and organizations, or regularly checking reputable industry news sources and publications.
Methodology
Step 1 - Identification of Relevant Samples Size from Population Database


Step 2 - Approaches for Defining Global Market Size (Value, Volume* & Price*)

Note*: In applicable scenarios
Step 3 - Data Sources
Primary Research
- Web Analytics
- Survey Reports
- Research Institute
- Latest Research Reports
- Opinion Leaders
Secondary Research
- Annual Reports
- White Paper
- Latest Press Release
- Industry Association
- Paid Database
- Investor Presentations

Step 4 - Data Triangulation
Involves using different sources of information in order to increase the validity of a study
These sources are likely to be stakeholders in a program - participants, other researchers, program staff, other community members, and so on.
Then we put all data in single framework & apply various statistical tools to find out the dynamic on the market.
During the analysis stage, feedback from the stakeholder groups would be compared to determine areas of agreement as well as areas of divergence
