

Key Insights
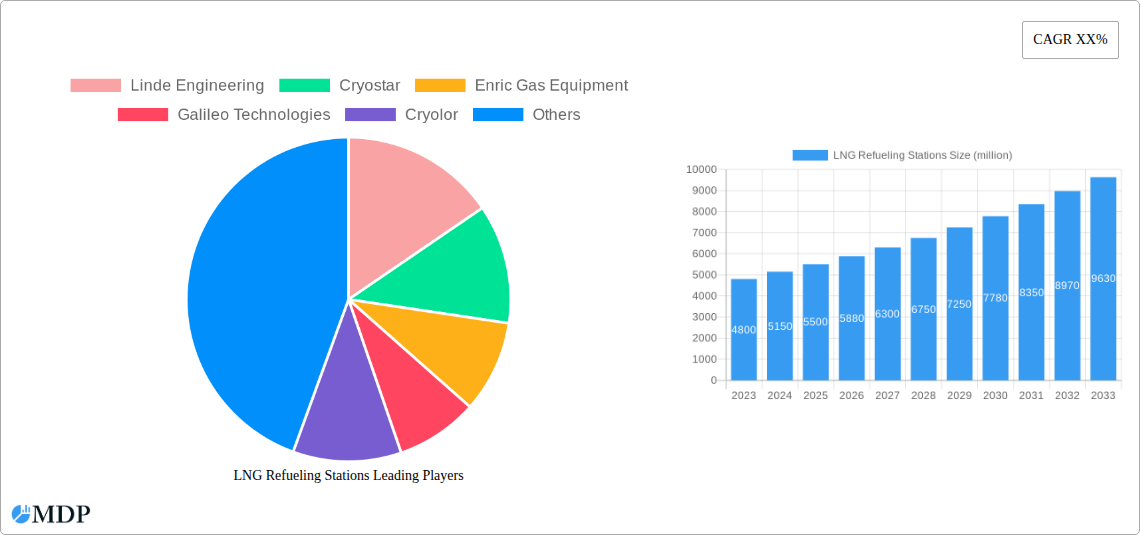
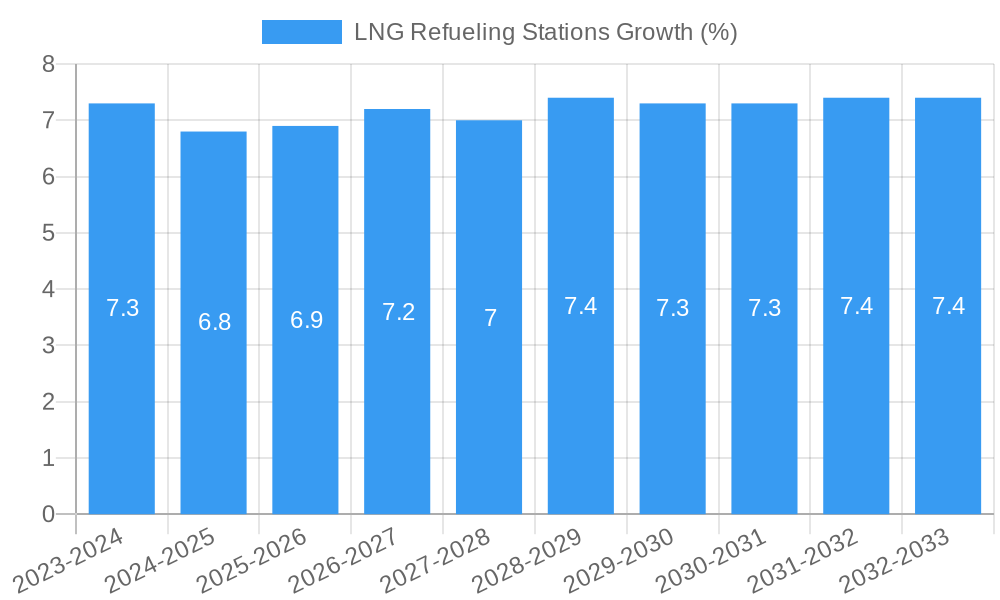
The global LNG refueling stations market is poised for substantial growth, projected to reach an estimated market size of approximately $5.5 billion in 2025, with a compound annual growth rate (CAGR) of around 7.5% anticipated through 2033. This expansion is primarily fueled by the increasing adoption of Liquefied Natural Gas (LNG) as a cleaner and more cost-effective alternative to traditional fuels, particularly in the transportation sector. Governments worldwide are incentivizing the use of natural gas vehicles (NGVs) and heavy-duty trucks to reduce emissions and reliance on fossil fuels, thereby driving the demand for robust refueling infrastructure. The energy industry also plays a crucial role, with a growing interest in utilizing LNG for power generation and industrial processes, further bolstering the market's trajectory. The market segmentation reveals a strong emphasis on both mobile and stationary refueling solutions, catering to diverse operational needs and geographical demands.
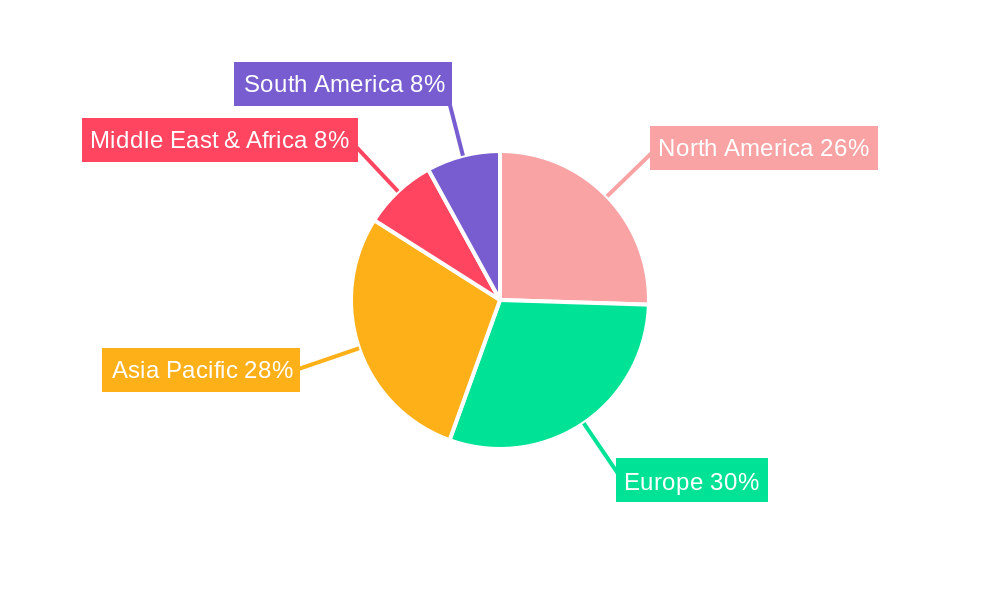
Key market drivers include stringent environmental regulations and emission standards, the volatility of crude oil prices, and advancements in LNG liquefaction and transportation technologies. These factors collectively contribute to the economic viability and strategic importance of LNG as a transitional fuel. However, challenges such as the high initial investment cost for establishing refueling stations and the need for widespread standardization of LNG infrastructure can temper the pace of growth. Despite these restraints, ongoing innovation in modular and scalable refueling station designs, coupled with strategic partnerships among key players like Linde Engineering, Cryostar, and TotalEnergies, is expected to overcome these hurdles. The Asia Pacific region, particularly China and India, is anticipated to emerge as a significant growth hub due to rapidly expanding industrialization and a rising fleet of NGVs, alongside established markets in North America and Europe.
This in-depth report provides an essential overview of the global LNG refueling stations market, covering market dynamics, key trends, leading segments, product developments, growth drivers, challenges, emerging opportunities, and strategic outlook. The study spans from 2019 to 2033, with a base year of 2025 and a forecast period of 2025-2033. Gain actionable insights into market concentration, innovation, regulatory frameworks, and competitive landscapes for industry stakeholders including Linde Engineering, Cryostar, Enric Gas Equipment, Galileo Technologies, Cryolor, Karbonsan, M1 Engineering, Stena Power & LNG Solutions, TotalEnergies, Gasrec, Rolande, GoLNG, Clean Energy Fuels, Cryonorm, Cryogas, WenZhou BlueSky Energy Technology. This report is crucial for understanding the transportation and energy industry applications of mobile LNG refueling stations and stationary LNG refueling stations.
LNG Refueling Stations Market Dynamics & Concentration
The global LNG refueling stations market exhibits a moderate to high concentration, with key players like Linde Engineering, Cryostar, and TotalEnergies holding significant market share, estimated to be over 60% combined. Innovation drivers are primarily fueled by the increasing demand for cleaner fuels in the transportation sector, particularly for heavy-duty trucks and maritime vessels, and advancements in liquefaction and cryogenic technologies. Regulatory frameworks globally are increasingly supporting the adoption of LNG through emission reduction targets and fuel incentives, driving market expansion. Product substitutes, such as electric vehicle charging infrastructure and hydrogen refueling stations, are present but currently cater to different segments or face infrastructure limitations. End-user trends indicate a growing preference for cost-effective and environmentally friendly fuel alternatives, with maritime shipping and long-haul trucking emerging as dominant application areas. Mergers and acquisitions (M&A) activity, with approximately 15 significant deals recorded during the historical period (2019-2024), are shaping the competitive landscape and fostering consolidation. This strategic consolidation is expected to continue as companies seek to expand their geographical reach and technological capabilities.
LNG Refueling Stations Industry Trends & Analysis
The LNG refueling stations industry is experiencing robust growth, propelled by a combination of factors including stringent environmental regulations, declining LNG prices, and the drive for energy security. The market is projected to witness a Compound Annual Growth Rate (CAGR) of approximately 8.5% during the forecast period (2025-2033). Technological advancements in liquefaction, storage, and dispensing technologies are crucial enablers, leading to more efficient and cost-effective LNG refueling solutions. Consumer preferences are shifting towards cleaner fuels, driven by corporate sustainability goals and public awareness regarding climate change. The transportation sector, particularly heavy-duty trucking and maritime shipping, is a primary beneficiary, as LNG offers a viable alternative to diesel and heavy fuel oil, reducing both greenhouse gas emissions and air pollutants. Competitive dynamics are intensifying, with established energy giants and specialized LNG infrastructure providers vying for market share. The penetration of LNG refueling infrastructure is steadily increasing, especially in regions with strong government support and a developed gas distribution network. The increasing adoption of LNG in industrial applications and for power generation further contributes to market expansion. The growing availability of LNG as a fuel source, coupled with the expanding network of refueling stations, is creating a positive feedback loop, encouraging more fleet operators to transition to LNG.
Leading Markets & Segments in LNG Refueling Stations
The transportation application segment, specifically heavy-duty trucking, is the dominant market within the global LNG refueling stations industry. This dominance is primarily driven by economic policies and infrastructure development initiatives in key regions like North America and Europe, where governments are actively promoting LNG adoption to meet emissions targets and reduce reliance on fossil fuels. The United States, with its abundant domestic natural gas reserves and significant investment in trucking fleets, leads in the deployment of LNG refueling infrastructure. Furthermore, the stationary LNG refueling stations type accounts for the largest market share due to its suitability for fixed locations like distribution hubs and ports, facilitating large-scale refueling operations.
- Economic Policies and Incentives: Government subsidies, tax credits, and favorable regulations for LNG-powered vehicles and infrastructure deployment are critical drivers in the growth of LNG refueling stations, especially in the transportation sector.
- Infrastructure Development: Strategic investments in building out a comprehensive network of LNG refueling stations, particularly along major freight corridors, are essential for enhancing the viability of LNG for long-haul trucking.
- Environmental Regulations: Increasingly stringent emission standards for heavy-duty vehicles and maritime vessels are compelling operators to seek cleaner fuel alternatives like LNG, boosting demand for refueling infrastructure.
- Fuel Cost Competitiveness: The price differential between LNG and traditional fuels like diesel significantly influences fleet operator adoption, making LNG an attractive economic choice for large-scale operations.
- Technological Advancements: Innovations in LNG liquefaction, transportation, and refueling technologies are making LNG more accessible and cost-effective, further solidifying its position.
LNG Refueling Stations Product Developments
Product developments in LNG refueling stations are focused on enhancing efficiency, safety, and cost-effectiveness. Innovations include modular and mobile refueling solutions for greater flexibility, advanced cryogenic technologies for improved storage and dispensing, and integrated digital systems for optimized station management and billing. Companies are also developing smaller-scale, decentralized refueling units to cater to niche markets and remote locations, expanding the reach of LNG infrastructure. These developments aim to address the growing demand for cleaner transportation fuels and support the transition towards a lower-carbon economy.
Key Drivers of LNG Refueling Stations Growth
The growth of the LNG refueling stations market is primarily driven by stringent environmental regulations aimed at reducing greenhouse gas emissions and air pollutants, particularly in the transportation sector. The increasing cost-competitiveness of LNG compared to traditional fuels like diesel, coupled with the abundant supply of natural gas, makes it an attractive option for fleet operators. Furthermore, government initiatives, including financial incentives and infrastructure development support, are accelerating the adoption of LNG. Technological advancements in liquefaction, storage, and dispensing are also contributing to the market's expansion by improving efficiency and reducing operational costs.
Challenges in the LNG Refueling Stations Market
Despite the positive growth trajectory, the LNG refueling stations market faces several challenges. Regulatory hurdles, including the need for standardized safety protocols and permitting processes across different regions, can slow down infrastructure deployment. The high initial capital investment required for establishing LNG refueling stations, coupled with the relatively less developed global refueling network compared to traditional fuels, presents a significant barrier for some operators. Supply chain complexities related to LNG transportation and distribution can also impact operational efficiency and cost. Moreover, competition from rapidly advancing alternative fuel technologies, such as electric vehicles and hydrogen, poses a long-term threat.
Emerging Opportunities in LNG Refueling Stations
Emerging opportunities in the LNG refueling stations market are centered on the expansion of LNG adoption in heavy-duty trucking, maritime shipping, and industrial applications. Strategic partnerships between LNG suppliers, infrastructure developers, and fleet operators are crucial for overcoming infrastructure challenges and accelerating market penetration. Technological breakthroughs in superconductivity and advanced cryogenics are expected to further reduce costs and improve the efficiency of LNG storage and refueling. The growing emphasis on decarbonization and energy transition initiatives globally presents a significant opportunity for LNG as a transitional fuel, bridging the gap to a fully renewable energy future.
Leading Players in the LNG Refueling Stations Sector
- Linde Engineering
- Cryostar
- Enric Gas Equipment
- Galileo Technologies
- Cryolor
- Karbonsan
- M1 Engineering
- Stena Power & LNG Solutions
- TotalEnergies
- Gasrec
- Rolande
- GoLNG
- Clean Energy Fuels
- Cryonorm
- Cryogas
- WenZhou BlueSky Energy Technology
Key Milestones in LNG Refueling Stations Industry
- 2019: Increased governmental focus on emission reduction targets spurs investment in LNG infrastructure.
- 2020: Major shipping companies announce commitments to explore LNG as a cleaner fuel alternative, driving demand for portside refueling.
- 2021: Technological advancements in cryogenic pumps and compressors enhance the efficiency of LNG refueling systems.
- 2022: Several key regions implement new regulations incentivizing the use of LNG in heavy-duty transportation.
- 2023: Strategic partnerships between energy majors and logistics companies accelerate the deployment of LNG refueling stations along major freight routes.
- 2024: The market sees a surge in the development of mobile LNG refueling solutions to address logistical challenges.
- 2025 (Base Year): Estimated market size of approximately $4,500 million.
- 2026-2033 (Forecast Period): Projected sustained growth driven by policy support and technological innovation.
Strategic Outlook for LNG Refueling Stations Market
The strategic outlook for the LNG refueling stations market is highly positive, driven by the global imperative for decarbonization and the proven benefits of LNG as a cleaner, cost-effective fuel. Growth accelerators include continued supportive government policies, further technological innovation in liquefaction and dispensing, and strategic collaborations that expand infrastructure accessibility. The market's expansion into new geographical regions and diverse applications beyond transportation, such as industrial power generation and backup energy solutions, will be key to unlocking future potential. The increasing adoption of LNG in maritime shipping, coupled with the sustained demand from the heavy-duty trucking sector, positions the market for significant long-term growth, estimated to reach over $9,000 million by 2033.
LNG Refueling Stations Segmentation
-
1. Application
- 1.1. Transportation
- 1.2. Energy Industry
- 1.3. Others
-
2. Types
- 2.1. Mobile LNG Refueling Stations
- 2.2. Stationary LNG Refueling Stations
LNG Refueling Stations Segmentation By Geography
-
1. North America
- 1.1. United States
- 1.2. Canada
- 1.3. Mexico
-
2. South America
- 2.1. Brazil
- 2.2. Argentina
- 2.3. Rest of South America
-
3. Europe
- 3.1. United Kingdom
- 3.2. Germany
- 3.3. France
- 3.4. Italy
- 3.5. Spain
- 3.6. Russia
- 3.7. Benelux
- 3.8. Nordics
- 3.9. Rest of Europe
-
4. Middle East & Africa
- 4.1. Turkey
- 4.2. Israel
- 4.3. GCC
- 4.4. North Africa
- 4.5. South Africa
- 4.6. Rest of Middle East & Africa
-
5. Asia Pacific
- 5.1. China
- 5.2. India
- 5.3. Japan
- 5.4. South Korea
- 5.5. ASEAN
- 5.6. Oceania
- 5.7. Rest of Asia Pacific
LNG Refueling Stations REPORT HIGHLIGHTS
| Aspects | Details |
|---|---|
| Study Period | 2019-2033 |
| Base Year | 2024 |
| Estimated Year | 2025 |
| Forecast Period | 2025-2033 |
| Historical Period | 2019-2024 |
| Growth Rate | CAGR of XX% from 2019-2033 |
| Segmentation |
|
Table of Contents
- 1. Introduction
- 1.1. Research Scope
- 1.2. Market Segmentation
- 1.3. Research Methodology
- 1.4. Definitions and Assumptions
- 2. Executive Summary
- 2.1. Introduction
- 3. Market Dynamics
- 3.1. Introduction
- 3.2. Market Drivers
- 3.3. Market Restrains
- 3.4. Market Trends
- 4. Market Factor Analysis
- 4.1. Porters Five Forces
- 4.2. Supply/Value Chain
- 4.3. PESTEL analysis
- 4.4. Market Entropy
- 4.5. Patent/Trademark Analysis
- 5. Global LNG Refueling Stations Analysis, Insights and Forecast, 2019-2031
- 5.1. Market Analysis, Insights and Forecast - by Application
- 5.1.1. Transportation
- 5.1.2. Energy Industry
- 5.1.3. Others
- 5.2. Market Analysis, Insights and Forecast - by Types
- 5.2.1. Mobile LNG Refueling Stations
- 5.2.2. Stationary LNG Refueling Stations
- 5.3. Market Analysis, Insights and Forecast - by Region
- 5.3.1. North America
- 5.3.2. South America
- 5.3.3. Europe
- 5.3.4. Middle East & Africa
- 5.3.5. Asia Pacific
- 5.1. Market Analysis, Insights and Forecast - by Application
- 6. North America LNG Refueling Stations Analysis, Insights and Forecast, 2019-2031
- 6.1. Market Analysis, Insights and Forecast - by Application
- 6.1.1. Transportation
- 6.1.2. Energy Industry
- 6.1.3. Others
- 6.2. Market Analysis, Insights and Forecast - by Types
- 6.2.1. Mobile LNG Refueling Stations
- 6.2.2. Stationary LNG Refueling Stations
- 6.1. Market Analysis, Insights and Forecast - by Application
- 7. South America LNG Refueling Stations Analysis, Insights and Forecast, 2019-2031
- 7.1. Market Analysis, Insights and Forecast - by Application
- 7.1.1. Transportation
- 7.1.2. Energy Industry
- 7.1.3. Others
- 7.2. Market Analysis, Insights and Forecast - by Types
- 7.2.1. Mobile LNG Refueling Stations
- 7.2.2. Stationary LNG Refueling Stations
- 7.1. Market Analysis, Insights and Forecast - by Application
- 8. Europe LNG Refueling Stations Analysis, Insights and Forecast, 2019-2031
- 8.1. Market Analysis, Insights and Forecast - by Application
- 8.1.1. Transportation
- 8.1.2. Energy Industry
- 8.1.3. Others
- 8.2. Market Analysis, Insights and Forecast - by Types
- 8.2.1. Mobile LNG Refueling Stations
- 8.2.2. Stationary LNG Refueling Stations
- 8.1. Market Analysis, Insights and Forecast - by Application
- 9. Middle East & Africa LNG Refueling Stations Analysis, Insights and Forecast, 2019-2031
- 9.1. Market Analysis, Insights and Forecast - by Application
- 9.1.1. Transportation
- 9.1.2. Energy Industry
- 9.1.3. Others
- 9.2. Market Analysis, Insights and Forecast - by Types
- 9.2.1. Mobile LNG Refueling Stations
- 9.2.2. Stationary LNG Refueling Stations
- 9.1. Market Analysis, Insights and Forecast - by Application
- 10. Asia Pacific LNG Refueling Stations Analysis, Insights and Forecast, 2019-2031
- 10.1. Market Analysis, Insights and Forecast - by Application
- 10.1.1. Transportation
- 10.1.2. Energy Industry
- 10.1.3. Others
- 10.2. Market Analysis, Insights and Forecast - by Types
- 10.2.1. Mobile LNG Refueling Stations
- 10.2.2. Stationary LNG Refueling Stations
- 10.1. Market Analysis, Insights and Forecast - by Application
- 11. Competitive Analysis
- 11.1. Global Market Share Analysis 2024
- 11.2. Company Profiles
- 11.2.1 Linde Engineering
- 11.2.1.1. Overview
- 11.2.1.2. Products
- 11.2.1.3. SWOT Analysis
- 11.2.1.4. Recent Developments
- 11.2.1.5. Financials (Based on Availability)
- 11.2.2 Cryostar
- 11.2.2.1. Overview
- 11.2.2.2. Products
- 11.2.2.3. SWOT Analysis
- 11.2.2.4. Recent Developments
- 11.2.2.5. Financials (Based on Availability)
- 11.2.3 Enric Gas Equipment
- 11.2.3.1. Overview
- 11.2.3.2. Products
- 11.2.3.3. SWOT Analysis
- 11.2.3.4. Recent Developments
- 11.2.3.5. Financials (Based on Availability)
- 11.2.4 Galileo Technologies
- 11.2.4.1. Overview
- 11.2.4.2. Products
- 11.2.4.3. SWOT Analysis
- 11.2.4.4. Recent Developments
- 11.2.4.5. Financials (Based on Availability)
- 11.2.5 Cryolor
- 11.2.5.1. Overview
- 11.2.5.2. Products
- 11.2.5.3. SWOT Analysis
- 11.2.5.4. Recent Developments
- 11.2.5.5. Financials (Based on Availability)
- 11.2.6 Karbonsan
- 11.2.6.1. Overview
- 11.2.6.2. Products
- 11.2.6.3. SWOT Analysis
- 11.2.6.4. Recent Developments
- 11.2.6.5. Financials (Based on Availability)
- 11.2.7 M1 Engineering
- 11.2.7.1. Overview
- 11.2.7.2. Products
- 11.2.7.3. SWOT Analysis
- 11.2.7.4. Recent Developments
- 11.2.7.5. Financials (Based on Availability)
- 11.2.8 Stena Power & LNG Solutions
- 11.2.8.1. Overview
- 11.2.8.2. Products
- 11.2.8.3. SWOT Analysis
- 11.2.8.4. Recent Developments
- 11.2.8.5. Financials (Based on Availability)
- 11.2.9 TotalEnergies
- 11.2.9.1. Overview
- 11.2.9.2. Products
- 11.2.9.3. SWOT Analysis
- 11.2.9.4. Recent Developments
- 11.2.9.5. Financials (Based on Availability)
- 11.2.10 Gasrec
- 11.2.10.1. Overview
- 11.2.10.2. Products
- 11.2.10.3. SWOT Analysis
- 11.2.10.4. Recent Developments
- 11.2.10.5. Financials (Based on Availability)
- 11.2.11 Rolande
- 11.2.11.1. Overview
- 11.2.11.2. Products
- 11.2.11.3. SWOT Analysis
- 11.2.11.4. Recent Developments
- 11.2.11.5. Financials (Based on Availability)
- 11.2.12 GoLNG
- 11.2.12.1. Overview
- 11.2.12.2. Products
- 11.2.12.3. SWOT Analysis
- 11.2.12.4. Recent Developments
- 11.2.12.5. Financials (Based on Availability)
- 11.2.13 Clean Energy Fuels
- 11.2.13.1. Overview
- 11.2.13.2. Products
- 11.2.13.3. SWOT Analysis
- 11.2.13.4. Recent Developments
- 11.2.13.5. Financials (Based on Availability)
- 11.2.14 Cryonorm
- 11.2.14.1. Overview
- 11.2.14.2. Products
- 11.2.14.3. SWOT Analysis
- 11.2.14.4. Recent Developments
- 11.2.14.5. Financials (Based on Availability)
- 11.2.15 Cryogas
- 11.2.15.1. Overview
- 11.2.15.2. Products
- 11.2.15.3. SWOT Analysis
- 11.2.15.4. Recent Developments
- 11.2.15.5. Financials (Based on Availability)
- 11.2.16 WenZhou BlueSky Energy Technology
- 11.2.16.1. Overview
- 11.2.16.2. Products
- 11.2.16.3. SWOT Analysis
- 11.2.16.4. Recent Developments
- 11.2.16.5. Financials (Based on Availability)
- 11.2.1 Linde Engineering
List of Figures
- Figure 1: Global LNG Refueling Stations Revenue Breakdown (million, %) by Region 2024 & 2032
- Figure 2: North America LNG Refueling Stations Revenue (million), by Application 2024 & 2032
- Figure 3: North America LNG Refueling Stations Revenue Share (%), by Application 2024 & 2032
- Figure 4: North America LNG Refueling Stations Revenue (million), by Types 2024 & 2032
- Figure 5: North America LNG Refueling Stations Revenue Share (%), by Types 2024 & 2032
- Figure 6: North America LNG Refueling Stations Revenue (million), by Country 2024 & 2032
- Figure 7: North America LNG Refueling Stations Revenue Share (%), by Country 2024 & 2032
- Figure 8: South America LNG Refueling Stations Revenue (million), by Application 2024 & 2032
- Figure 9: South America LNG Refueling Stations Revenue Share (%), by Application 2024 & 2032
- Figure 10: South America LNG Refueling Stations Revenue (million), by Types 2024 & 2032
- Figure 11: South America LNG Refueling Stations Revenue Share (%), by Types 2024 & 2032
- Figure 12: South America LNG Refueling Stations Revenue (million), by Country 2024 & 2032
- Figure 13: South America LNG Refueling Stations Revenue Share (%), by Country 2024 & 2032
- Figure 14: Europe LNG Refueling Stations Revenue (million), by Application 2024 & 2032
- Figure 15: Europe LNG Refueling Stations Revenue Share (%), by Application 2024 & 2032
- Figure 16: Europe LNG Refueling Stations Revenue (million), by Types 2024 & 2032
- Figure 17: Europe LNG Refueling Stations Revenue Share (%), by Types 2024 & 2032
- Figure 18: Europe LNG Refueling Stations Revenue (million), by Country 2024 & 2032
- Figure 19: Europe LNG Refueling Stations Revenue Share (%), by Country 2024 & 2032
- Figure 20: Middle East & Africa LNG Refueling Stations Revenue (million), by Application 2024 & 2032
- Figure 21: Middle East & Africa LNG Refueling Stations Revenue Share (%), by Application 2024 & 2032
- Figure 22: Middle East & Africa LNG Refueling Stations Revenue (million), by Types 2024 & 2032
- Figure 23: Middle East & Africa LNG Refueling Stations Revenue Share (%), by Types 2024 & 2032
- Figure 24: Middle East & Africa LNG Refueling Stations Revenue (million), by Country 2024 & 2032
- Figure 25: Middle East & Africa LNG Refueling Stations Revenue Share (%), by Country 2024 & 2032
- Figure 26: Asia Pacific LNG Refueling Stations Revenue (million), by Application 2024 & 2032
- Figure 27: Asia Pacific LNG Refueling Stations Revenue Share (%), by Application 2024 & 2032
- Figure 28: Asia Pacific LNG Refueling Stations Revenue (million), by Types 2024 & 2032
- Figure 29: Asia Pacific LNG Refueling Stations Revenue Share (%), by Types 2024 & 2032
- Figure 30: Asia Pacific LNG Refueling Stations Revenue (million), by Country 2024 & 2032
- Figure 31: Asia Pacific LNG Refueling Stations Revenue Share (%), by Country 2024 & 2032
List of Tables
- Table 1: Global LNG Refueling Stations Revenue million Forecast, by Region 2019 & 2032
- Table 2: Global LNG Refueling Stations Revenue million Forecast, by Application 2019 & 2032
- Table 3: Global LNG Refueling Stations Revenue million Forecast, by Types 2019 & 2032
- Table 4: Global LNG Refueling Stations Revenue million Forecast, by Region 2019 & 2032
- Table 5: Global LNG Refueling Stations Revenue million Forecast, by Application 2019 & 2032
- Table 6: Global LNG Refueling Stations Revenue million Forecast, by Types 2019 & 2032
- Table 7: Global LNG Refueling Stations Revenue million Forecast, by Country 2019 & 2032
- Table 8: United States LNG Refueling Stations Revenue (million) Forecast, by Application 2019 & 2032
- Table 9: Canada LNG Refueling Stations Revenue (million) Forecast, by Application 2019 & 2032
- Table 10: Mexico LNG Refueling Stations Revenue (million) Forecast, by Application 2019 & 2032
- Table 11: Global LNG Refueling Stations Revenue million Forecast, by Application 2019 & 2032
- Table 12: Global LNG Refueling Stations Revenue million Forecast, by Types 2019 & 2032
- Table 13: Global LNG Refueling Stations Revenue million Forecast, by Country 2019 & 2032
- Table 14: Brazil LNG Refueling Stations Revenue (million) Forecast, by Application 2019 & 2032
- Table 15: Argentina LNG Refueling Stations Revenue (million) Forecast, by Application 2019 & 2032
- Table 16: Rest of South America LNG Refueling Stations Revenue (million) Forecast, by Application 2019 & 2032
- Table 17: Global LNG Refueling Stations Revenue million Forecast, by Application 2019 & 2032
- Table 18: Global LNG Refueling Stations Revenue million Forecast, by Types 2019 & 2032
- Table 19: Global LNG Refueling Stations Revenue million Forecast, by Country 2019 & 2032
- Table 20: United Kingdom LNG Refueling Stations Revenue (million) Forecast, by Application 2019 & 2032
- Table 21: Germany LNG Refueling Stations Revenue (million) Forecast, by Application 2019 & 2032
- Table 22: France LNG Refueling Stations Revenue (million) Forecast, by Application 2019 & 2032
- Table 23: Italy LNG Refueling Stations Revenue (million) Forecast, by Application 2019 & 2032
- Table 24: Spain LNG Refueling Stations Revenue (million) Forecast, by Application 2019 & 2032
- Table 25: Russia LNG Refueling Stations Revenue (million) Forecast, by Application 2019 & 2032
- Table 26: Benelux LNG Refueling Stations Revenue (million) Forecast, by Application 2019 & 2032
- Table 27: Nordics LNG Refueling Stations Revenue (million) Forecast, by Application 2019 & 2032
- Table 28: Rest of Europe LNG Refueling Stations Revenue (million) Forecast, by Application 2019 & 2032
- Table 29: Global LNG Refueling Stations Revenue million Forecast, by Application 2019 & 2032
- Table 30: Global LNG Refueling Stations Revenue million Forecast, by Types 2019 & 2032
- Table 31: Global LNG Refueling Stations Revenue million Forecast, by Country 2019 & 2032
- Table 32: Turkey LNG Refueling Stations Revenue (million) Forecast, by Application 2019 & 2032
- Table 33: Israel LNG Refueling Stations Revenue (million) Forecast, by Application 2019 & 2032
- Table 34: GCC LNG Refueling Stations Revenue (million) Forecast, by Application 2019 & 2032
- Table 35: North Africa LNG Refueling Stations Revenue (million) Forecast, by Application 2019 & 2032
- Table 36: South Africa LNG Refueling Stations Revenue (million) Forecast, by Application 2019 & 2032
- Table 37: Rest of Middle East & Africa LNG Refueling Stations Revenue (million) Forecast, by Application 2019 & 2032
- Table 38: Global LNG Refueling Stations Revenue million Forecast, by Application 2019 & 2032
- Table 39: Global LNG Refueling Stations Revenue million Forecast, by Types 2019 & 2032
- Table 40: Global LNG Refueling Stations Revenue million Forecast, by Country 2019 & 2032
- Table 41: China LNG Refueling Stations Revenue (million) Forecast, by Application 2019 & 2032
- Table 42: India LNG Refueling Stations Revenue (million) Forecast, by Application 2019 & 2032
- Table 43: Japan LNG Refueling Stations Revenue (million) Forecast, by Application 2019 & 2032
- Table 44: South Korea LNG Refueling Stations Revenue (million) Forecast, by Application 2019 & 2032
- Table 45: ASEAN LNG Refueling Stations Revenue (million) Forecast, by Application 2019 & 2032
- Table 46: Oceania LNG Refueling Stations Revenue (million) Forecast, by Application 2019 & 2032
- Table 47: Rest of Asia Pacific LNG Refueling Stations Revenue (million) Forecast, by Application 2019 & 2032
Frequently Asked Questions
1. What is the projected Compound Annual Growth Rate (CAGR) of the LNG Refueling Stations?
The projected CAGR is approximately XX%.
2. Which companies are prominent players in the LNG Refueling Stations?
Key companies in the market include Linde Engineering, Cryostar, Enric Gas Equipment, Galileo Technologies, Cryolor, Karbonsan, M1 Engineering, Stena Power & LNG Solutions, TotalEnergies, Gasrec, Rolande, GoLNG, Clean Energy Fuels, Cryonorm, Cryogas, WenZhou BlueSky Energy Technology.
3. What are the main segments of the LNG Refueling Stations?
The market segments include Application, Types.
4. Can you provide details about the market size?
The market size is estimated to be USD XXX million as of 2022.
5. What are some drivers contributing to market growth?
N/A
6. What are the notable trends driving market growth?
N/A
7. Are there any restraints impacting market growth?
N/A
8. Can you provide examples of recent developments in the market?
N/A
9. What pricing options are available for accessing the report?
Pricing options include single-user, multi-user, and enterprise licenses priced at USD 3950.00, USD 5925.00, and USD 7900.00 respectively.
10. Is the market size provided in terms of value or volume?
The market size is provided in terms of value, measured in million.
11. Are there any specific market keywords associated with the report?
Yes, the market keyword associated with the report is "LNG Refueling Stations," which aids in identifying and referencing the specific market segment covered.
12. How do I determine which pricing option suits my needs best?
The pricing options vary based on user requirements and access needs. Individual users may opt for single-user licenses, while businesses requiring broader access may choose multi-user or enterprise licenses for cost-effective access to the report.
13. Are there any additional resources or data provided in the LNG Refueling Stations report?
While the report offers comprehensive insights, it's advisable to review the specific contents or supplementary materials provided to ascertain if additional resources or data are available.
14. How can I stay updated on further developments or reports in the LNG Refueling Stations?
To stay informed about further developments, trends, and reports in the LNG Refueling Stations, consider subscribing to industry newsletters, following relevant companies and organizations, or regularly checking reputable industry news sources and publications.
Methodology
Step 1 - Identification of Relevant Samples Size from Population Database


Step 2 - Approaches for Defining Global Market Size (Value, Volume* & Price*)

Note*: In applicable scenarios
Step 3 - Data Sources
Primary Research
- Web Analytics
- Survey Reports
- Research Institute
- Latest Research Reports
- Opinion Leaders
Secondary Research
- Annual Reports
- White Paper
- Latest Press Release
- Industry Association
- Paid Database
- Investor Presentations

Step 4 - Data Triangulation
Involves using different sources of information in order to increase the validity of a study
These sources are likely to be stakeholders in a program - participants, other researchers, program staff, other community members, and so on.
Then we put all data in single framework & apply various statistical tools to find out the dynamic on the market.
During the analysis stage, feedback from the stakeholder groups would be compared to determine areas of agreement as well as areas of divergence
