

Key Insights
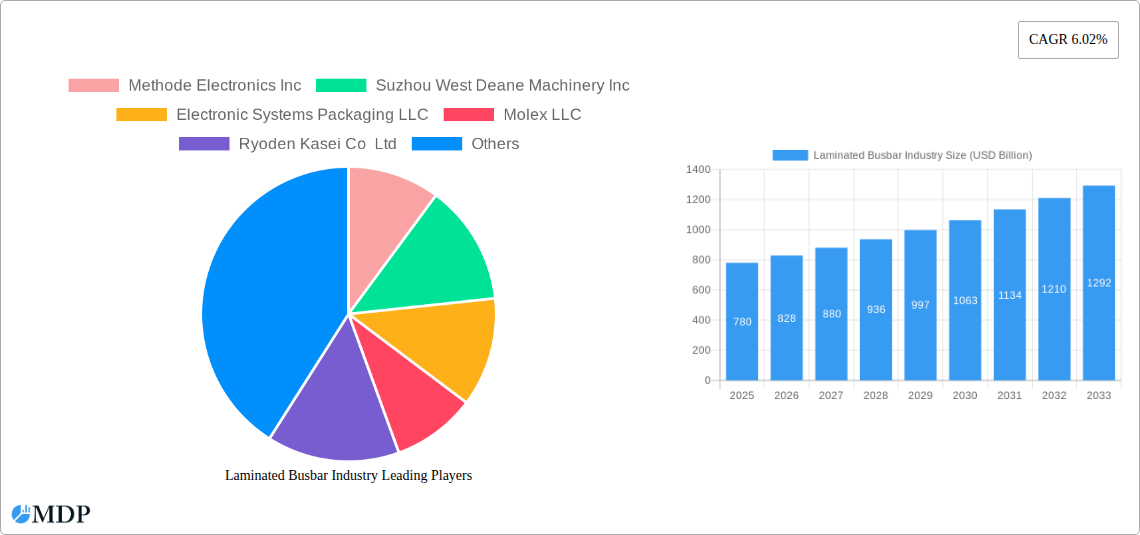
The laminated busbar market, valued at $0.78 billion in 2025, is projected to experience robust growth, driven by the increasing demand for efficient power transmission and distribution systems across various sectors. The 6.02% CAGR indicates a significant expansion over the forecast period (2025-2033), fueled by several key factors. Growth in renewable energy infrastructure, particularly solar and wind power, necessitates high-capacity, reliable busbar systems. The rising adoption of electric vehicles (EVs) and charging infrastructure further boosts demand, as these applications require advanced busbar technology for efficient power delivery. Industrial automation and the expansion of data centers are also contributing significantly to market growth, as they rely on dependable and high-current carrying capacity busbars. Technological advancements in materials science, such as the development of lighter and more efficient insulation materials like epoxy powder coatings and polyvinyl fluoride films, are enhancing the performance and reliability of laminated busbars, making them increasingly attractive to end-users.
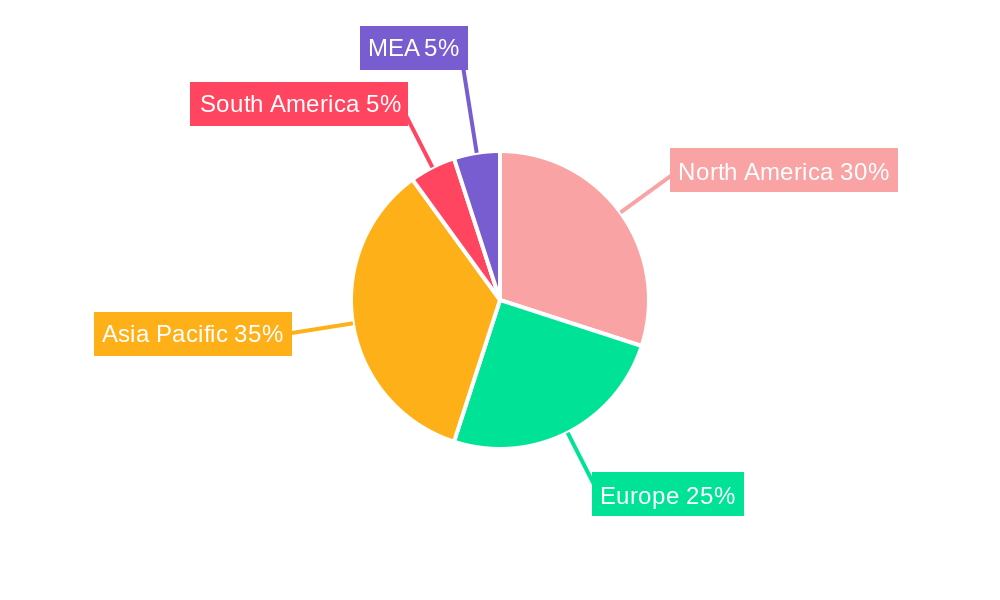
Despite the positive growth outlook, certain restraints are expected to influence the market's trajectory. Fluctuations in raw material prices, particularly for metals like copper and aluminum, could impact manufacturing costs and profitability. Furthermore, the market's competitiveness, with numerous established players and emerging regional manufacturers, could lead to price pressures. However, ongoing innovation in busbar design and manufacturing processes, coupled with increasing awareness of energy efficiency and reliability among end-users, is likely to mitigate these challenges and sustain the overall positive growth momentum. The segments showing strongest growth are likely to be those catering to the renewable energy and electric vehicle industries, alongside increasing demand from data centers and industrial automation applications. Geographic expansion into rapidly developing economies will be a key growth driver, with the Asia-Pacific region poised for significant expansion.
Laminated Busbar Industry Market Report: 2019-2033
This comprehensive report provides an in-depth analysis of the Laminated Busbar industry, projecting a market value exceeding USD xx Billion by 2033. It examines market dynamics, leading players, technological advancements, and future growth opportunities. This report is essential for industry stakeholders, investors, and strategic decision-makers seeking a clear understanding of this rapidly evolving sector. The study period covers 2019-2033, with 2025 as the base and estimated year.
Laminated Busbar Industry Market Dynamics & Concentration
The Laminated Busbar industry is experiencing dynamic shifts driven by technological innovation, stringent regulatory frameworks, and evolving end-user demands. Market concentration is moderate, with several key players vying for market share. However, smaller niche players also contribute significantly to the overall market volume. The competitive landscape is characterized by both organic growth strategies (product innovation and market expansion) and inorganic growth through mergers and acquisitions (M&A). Between 2019 and 2024, the industry witnessed approximately xx M&A deals, resulting in a xx% market share shift among the top 5 players. Innovation drivers include the demand for higher efficiency, improved safety, and compact designs in power systems. The regulatory landscape is characterized by evolving safety standards and environmental regulations. Product substitutes, such as printed circuit boards (PCBs) in specific applications, pose a moderate threat to the market. End-user trends reflect a strong demand for laminated busbars in the power utilities and industrial sectors.
Laminated Busbar Industry Industry Trends & Analysis
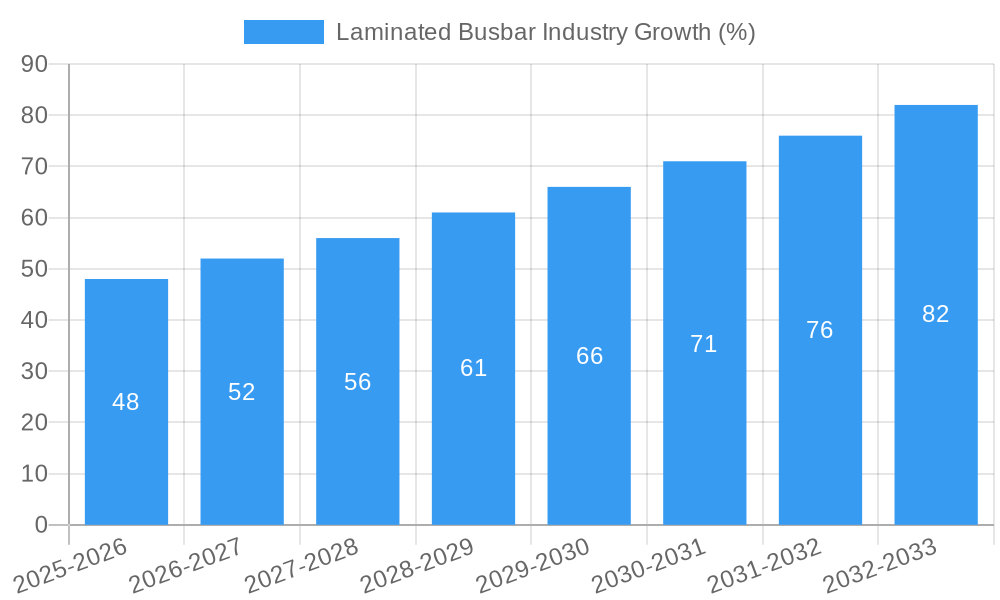
The Laminated Busbar industry is projected to witness a Compound Annual Growth Rate (CAGR) of xx% during the forecast period (2025-2033). This growth is fueled by several key factors. The increasing demand for efficient power transmission and distribution systems in developing economies is a major driver. Advancements in materials science, enabling the development of higher-performance laminated busbars, further propel market expansion. Technological disruptions, such as the adoption of smart grid technologies and automation in manufacturing processes, are transforming industry practices. Consumer preferences are shifting toward higher reliability, safety, and reduced environmental impact. This trend is driving the adoption of eco-friendly insulation materials and advanced manufacturing techniques. Competitive dynamics are marked by ongoing innovation, strategic partnerships, and a focus on cost optimization. Market penetration of laminated busbars is steadily increasing across diverse end-use sectors, particularly in transportation and renewable energy applications.
Leading Markets & Segments in Laminated Busbar Industry
The Laminated Busbar market is geographically diverse, with strong presence across multiple regions. However, the [Region Name – e.g., North America] region currently holds the largest market share, driven by robust infrastructure development and high energy consumption. Within this region, [Country Name – e.g., the United States] is the leading country.
Key Drivers:
- Robust Infrastructure Development: Ongoing investments in power infrastructure and renewable energy projects fuel the demand for laminated busbars.
- Stringent Regulatory Compliance: Stricter environmental and safety regulations drive the adoption of higher-performance and eco-friendly materials.
- High Energy Consumption: Increasing electricity consumption across various sectors necessitates the development of high-capacity power transmission systems.
Segment Dominance Analysis:
- Insulation Material: Epoxy powder coating currently dominates the insulation material segment due to its cost-effectiveness and versatile properties.
- End-User: The Power Utilities sector leads in terms of consumption volume, driven by the need for high-capacity and reliable power distribution networks.
- Material: Copper maintains a significant market share compared to aluminum due to its superior conductivity and reliability in high-current applications.
Laminated Busbar Industry Product Developments
Recent product innovations focus on improving thermal performance, enhancing insulation capabilities, and reducing overall weight and size. Advanced insulation materials, such as polyvinyl fluoride films and heat-resistant fibers, are gaining traction. These improvements provide enhanced reliability, extended lifespan, and better safety features. The integration of smart sensors and monitoring systems is also emerging as a key trend, enabling real-time performance tracking and predictive maintenance. The market fits the growing needs of the power and electronics sectors, where high performance, reliability, and miniaturization are crucial.
Key Drivers of Laminated Busbar Industry Growth
The Laminated Busbar industry's growth is primarily driven by the increasing demand for efficient and reliable power transmission and distribution systems globally. Technological advancements, such as the development of improved insulation materials and advanced manufacturing techniques, contribute significantly to market expansion. Favorable government policies promoting renewable energy and infrastructure development also create favorable conditions for growth. For example, incentives for the adoption of energy-efficient technologies in many countries stimulate demand for high-performance laminated busbars.
Challenges in the Laminated Busbar Industry Market
The Laminated Busbar market faces challenges such as fluctuating raw material prices, particularly copper and aluminum, impacting manufacturing costs. Supply chain disruptions and geopolitical instability can also affect production. Intense competition from alternative technologies, such as flexible printed circuits, poses a threat to market growth. Furthermore, stringent environmental regulations necessitate the use of eco-friendly materials, which can increase production costs. These factors can cumulatively decrease profit margins by an estimated xx% in the coming years.
Emerging Opportunities in Laminated Busbar Industry
The expanding adoption of electric vehicles (EVs) and hybrid electric vehicles (HEVs) presents a significant opportunity for laminated busbars in the automotive industry. Growth in renewable energy sectors, such as solar and wind power, creates demand for efficient power management systems. The development of smart grid technologies and the integration of advanced sensor technologies into laminated busbars open up new avenues for growth. Strategic partnerships and collaborative research initiatives can lead to the development of innovative and cost-effective solutions.
Leading Players in the Laminated Busbar Industry Sector
- Methode Electronics Inc
- Suzhou West Deane Machinery Inc
- Electronic Systems Packaging LLC
- Molex LLC
- Ryoden Kasei Co Ltd
- Rogers Corporation
- Shanghai Eagtop Electronic Technology Co Ltd
- Eaton Corporation PLC
- Amphenol Corporation
- Segue Electronics Inc
- Zhejiang RHI ELectric Co Ltd
- Mersen SA
- Zhuzhou CRRC Times Electric Co Ltd
- Sun King Power Electronics Group Ltd
- Raychem RPG Private Limited
- EMS Industrial & Service Company
- Storm Power Components
*List Not Exhaustive
Key Milestones in Laminated Busbar Industry Industry
- February 2020: ABB Ltd. announced plans to introduce laminated bus plate technology for low-voltage switchgear, integrating it with the ABB Ability platform for enhanced reliability, efficiency, safety, flexibility, and ROI.
- March 2020: BRAR successfully completed factory cold tests of busbars and Aluminum Power Conducting Arms for SMS Group.
Strategic Outlook for Laminated Busbar Industry Market
The Laminated Busbar market is poised for continued growth, driven by technological advancements, increasing demand from key end-use sectors, and supportive government policies. Strategic opportunities lie in developing innovative products with enhanced performance characteristics, expanding into new geographical markets, and forging strategic partnerships to leverage technological expertise and market access. Focusing on sustainable and eco-friendly manufacturing processes will be key to long-term success. The industry's future rests on meeting the demands of a rapidly evolving energy landscape.
Laminated Busbar Industry Segmentation
-
1. Material
- 1.1. Aluminum
- 1.2. Copper
-
2. Insulation Material
- 2.1. Epoxy Powder Coating
- 2.2. Polyvinyl Fluoride Film
- 2.3. Polyester
- 2.4. Heat-Resistant Fiber
- 2.5. Other Insulation Materials
-
3. End-User
- 3.1. Power Utilities
- 3.2. Industrial
- 3.3. Transportation
- 3.4. Residential and Commercial
Laminated Busbar Industry Segmentation By Geography
- 1. North America
- 2. Europe
- 3. Asia Pacific
- 4. South America
- 5. Middle East
Laminated Busbar Industry REPORT HIGHLIGHTS
| Aspects | Details |
|---|---|
| Study Period | 2019-2033 |
| Base Year | 2024 |
| Estimated Year | 2025 |
| Forecast Period | 2025-2033 |
| Historical Period | 2019-2024 |
| Growth Rate | CAGR of 6.02% from 2019-2033 |
| Segmentation |
|
Table of Contents
- 1. Introduction
- 1.1. Research Scope
- 1.2. Market Segmentation
- 1.3. Research Methodology
- 1.4. Definitions and Assumptions
- 2. Executive Summary
- 2.1. Introduction
- 3. Market Dynamics
- 3.1. Introduction
- 3.2. Market Drivers
- 3.2.1. 4.; Growing Energy Demand4.; Renewable Energy Transition
- 3.3. Market Restrains
- 3.3.1. 4.; Phasing out of Conventional Sources of Electricity
- 3.4. Market Trends
- 3.4.1. Power Utility Sub-sector to Dominate the Market
- 4. Market Factor Analysis
- 4.1. Porters Five Forces
- 4.2. Supply/Value Chain
- 4.3. PESTEL analysis
- 4.4. Market Entropy
- 4.5. Patent/Trademark Analysis
- 5. Global Laminated Busbar Industry Analysis, Insights and Forecast, 2019-2031
- 5.1. Market Analysis, Insights and Forecast - by Material
- 5.1.1. Aluminum
- 5.1.2. Copper
- 5.2. Market Analysis, Insights and Forecast - by Insulation Material
- 5.2.1. Epoxy Powder Coating
- 5.2.2. Polyvinyl Fluoride Film
- 5.2.3. Polyester
- 5.2.4. Heat-Resistant Fiber
- 5.2.5. Other Insulation Materials
- 5.3. Market Analysis, Insights and Forecast - by End-User
- 5.3.1. Power Utilities
- 5.3.2. Industrial
- 5.3.3. Transportation
- 5.3.4. Residential and Commercial
- 5.4. Market Analysis, Insights and Forecast - by Region
- 5.4.1. North America
- 5.4.2. Europe
- 5.4.3. Asia Pacific
- 5.4.4. South America
- 5.4.5. Middle East
- 5.1. Market Analysis, Insights and Forecast - by Material
- 6. North America Laminated Busbar Industry Analysis, Insights and Forecast, 2019-2031
- 6.1. Market Analysis, Insights and Forecast - by Material
- 6.1.1. Aluminum
- 6.1.2. Copper
- 6.2. Market Analysis, Insights and Forecast - by Insulation Material
- 6.2.1. Epoxy Powder Coating
- 6.2.2. Polyvinyl Fluoride Film
- 6.2.3. Polyester
- 6.2.4. Heat-Resistant Fiber
- 6.2.5. Other Insulation Materials
- 6.3. Market Analysis, Insights and Forecast - by End-User
- 6.3.1. Power Utilities
- 6.3.2. Industrial
- 6.3.3. Transportation
- 6.3.4. Residential and Commercial
- 6.1. Market Analysis, Insights and Forecast - by Material
- 7. Europe Laminated Busbar Industry Analysis, Insights and Forecast, 2019-2031
- 7.1. Market Analysis, Insights and Forecast - by Material
- 7.1.1. Aluminum
- 7.1.2. Copper
- 7.2. Market Analysis, Insights and Forecast - by Insulation Material
- 7.2.1. Epoxy Powder Coating
- 7.2.2. Polyvinyl Fluoride Film
- 7.2.3. Polyester
- 7.2.4. Heat-Resistant Fiber
- 7.2.5. Other Insulation Materials
- 7.3. Market Analysis, Insights and Forecast - by End-User
- 7.3.1. Power Utilities
- 7.3.2. Industrial
- 7.3.3. Transportation
- 7.3.4. Residential and Commercial
- 7.1. Market Analysis, Insights and Forecast - by Material
- 8. Asia Pacific Laminated Busbar Industry Analysis, Insights and Forecast, 2019-2031
- 8.1. Market Analysis, Insights and Forecast - by Material
- 8.1.1. Aluminum
- 8.1.2. Copper
- 8.2. Market Analysis, Insights and Forecast - by Insulation Material
- 8.2.1. Epoxy Powder Coating
- 8.2.2. Polyvinyl Fluoride Film
- 8.2.3. Polyester
- 8.2.4. Heat-Resistant Fiber
- 8.2.5. Other Insulation Materials
- 8.3. Market Analysis, Insights and Forecast - by End-User
- 8.3.1. Power Utilities
- 8.3.2. Industrial
- 8.3.3. Transportation
- 8.3.4. Residential and Commercial
- 8.1. Market Analysis, Insights and Forecast - by Material
- 9. South America Laminated Busbar Industry Analysis, Insights and Forecast, 2019-2031
- 9.1. Market Analysis, Insights and Forecast - by Material
- 9.1.1. Aluminum
- 9.1.2. Copper
- 9.2. Market Analysis, Insights and Forecast - by Insulation Material
- 9.2.1. Epoxy Powder Coating
- 9.2.2. Polyvinyl Fluoride Film
- 9.2.3. Polyester
- 9.2.4. Heat-Resistant Fiber
- 9.2.5. Other Insulation Materials
- 9.3. Market Analysis, Insights and Forecast - by End-User
- 9.3.1. Power Utilities
- 9.3.2. Industrial
- 9.3.3. Transportation
- 9.3.4. Residential and Commercial
- 9.1. Market Analysis, Insights and Forecast - by Material
- 10. Middle East Laminated Busbar Industry Analysis, Insights and Forecast, 2019-2031
- 10.1. Market Analysis, Insights and Forecast - by Material
- 10.1.1. Aluminum
- 10.1.2. Copper
- 10.2. Market Analysis, Insights and Forecast - by Insulation Material
- 10.2.1. Epoxy Powder Coating
- 10.2.2. Polyvinyl Fluoride Film
- 10.2.3. Polyester
- 10.2.4. Heat-Resistant Fiber
- 10.2.5. Other Insulation Materials
- 10.3. Market Analysis, Insights and Forecast - by End-User
- 10.3.1. Power Utilities
- 10.3.2. Industrial
- 10.3.3. Transportation
- 10.3.4. Residential and Commercial
- 10.1. Market Analysis, Insights and Forecast - by Material
- 11. North America Laminated Busbar Industry Analysis, Insights and Forecast, 2019-2031
- 11.1. Market Analysis, Insights and Forecast - By Country/Sub-region
- 11.1.1 United States
- 11.1.2 Canada
- 11.1.3 Mexico
- 12. Europe Laminated Busbar Industry Analysis, Insights and Forecast, 2019-2031
- 12.1. Market Analysis, Insights and Forecast - By Country/Sub-region
- 12.1.1 Germany
- 12.1.2 United Kingdom
- 12.1.3 France
- 12.1.4 Spain
- 12.1.5 Italy
- 12.1.6 Spain
- 12.1.7 Belgium
- 12.1.8 Netherland
- 12.1.9 Nordics
- 12.1.10 Rest of Europe
- 13. Asia Pacific Laminated Busbar Industry Analysis, Insights and Forecast, 2019-2031
- 13.1. Market Analysis, Insights and Forecast - By Country/Sub-region
- 13.1.1 China
- 13.1.2 Japan
- 13.1.3 India
- 13.1.4 South Korea
- 13.1.5 Southeast Asia
- 13.1.6 Australia
- 13.1.7 Indonesia
- 13.1.8 Phillipes
- 13.1.9 Singapore
- 13.1.10 Thailandc
- 13.1.11 Rest of Asia Pacific
- 14. South America Laminated Busbar Industry Analysis, Insights and Forecast, 2019-2031
- 14.1. Market Analysis, Insights and Forecast - By Country/Sub-region
- 14.1.1 Brazil
- 14.1.2 Argentina
- 14.1.3 Peru
- 14.1.4 Chile
- 14.1.5 Colombia
- 14.1.6 Ecuador
- 14.1.7 Venezuela
- 14.1.8 Rest of South America
- 15. North America Laminated Busbar Industry Analysis, Insights and Forecast, 2019-2031
- 15.1. Market Analysis, Insights and Forecast - By Country/Sub-region
- 15.1.1 United States
- 15.1.2 Canada
- 15.1.3 Mexico
- 16. MEA Laminated Busbar Industry Analysis, Insights and Forecast, 2019-2031
- 16.1. Market Analysis, Insights and Forecast - By Country/Sub-region
- 16.1.1 United Arab Emirates
- 16.1.2 Saudi Arabia
- 16.1.3 South Africa
- 16.1.4 Rest of Middle East and Africa
- 17. Competitive Analysis
- 17.1. Global Market Share Analysis 2024
- 17.2. Company Profiles
- 17.2.1 Methode Electronics Inc
- 17.2.1.1. Overview
- 17.2.1.2. Products
- 17.2.1.3. SWOT Analysis
- 17.2.1.4. Recent Developments
- 17.2.1.5. Financials (Based on Availability)
- 17.2.2 Suzhou West Deane Machinery Inc
- 17.2.2.1. Overview
- 17.2.2.2. Products
- 17.2.2.3. SWOT Analysis
- 17.2.2.4. Recent Developments
- 17.2.2.5. Financials (Based on Availability)
- 17.2.3 Electronic Systems Packaging LLC
- 17.2.3.1. Overview
- 17.2.3.2. Products
- 17.2.3.3. SWOT Analysis
- 17.2.3.4. Recent Developments
- 17.2.3.5. Financials (Based on Availability)
- 17.2.4 Molex LLC
- 17.2.4.1. Overview
- 17.2.4.2. Products
- 17.2.4.3. SWOT Analysis
- 17.2.4.4. Recent Developments
- 17.2.4.5. Financials (Based on Availability)
- 17.2.5 Ryoden Kasei Co Ltd
- 17.2.5.1. Overview
- 17.2.5.2. Products
- 17.2.5.3. SWOT Analysis
- 17.2.5.4. Recent Developments
- 17.2.5.5. Financials (Based on Availability)
- 17.2.6 Rogers Corporation
- 17.2.6.1. Overview
- 17.2.6.2. Products
- 17.2.6.3. SWOT Analysis
- 17.2.6.4. Recent Developments
- 17.2.6.5. Financials (Based on Availability)
- 17.2.7 Shanghai Eagtop Electronic Technology Co Ltd
- 17.2.7.1. Overview
- 17.2.7.2. Products
- 17.2.7.3. SWOT Analysis
- 17.2.7.4. Recent Developments
- 17.2.7.5. Financials (Based on Availability)
- 17.2.8 Eaton Corporation PLC
- 17.2.8.1. Overview
- 17.2.8.2. Products
- 17.2.8.3. SWOT Analysis
- 17.2.8.4. Recent Developments
- 17.2.8.5. Financials (Based on Availability)
- 17.2.9 Amphenol Corporation
- 17.2.9.1. Overview
- 17.2.9.2. Products
- 17.2.9.3. SWOT Analysis
- 17.2.9.4. Recent Developments
- 17.2.9.5. Financials (Based on Availability)
- 17.2.10 Segue Electronics Inc *List Not Exhaustive
- 17.2.10.1. Overview
- 17.2.10.2. Products
- 17.2.10.3. SWOT Analysis
- 17.2.10.4. Recent Developments
- 17.2.10.5. Financials (Based on Availability)
- 17.2.11 Zhejiang RHI ELectric Co Ltd
- 17.2.11.1. Overview
- 17.2.11.2. Products
- 17.2.11.3. SWOT Analysis
- 17.2.11.4. Recent Developments
- 17.2.11.5. Financials (Based on Availability)
- 17.2.12 Mersen SA
- 17.2.12.1. Overview
- 17.2.12.2. Products
- 17.2.12.3. SWOT Analysis
- 17.2.12.4. Recent Developments
- 17.2.12.5. Financials (Based on Availability)
- 17.2.13 Zhuzhou CRRC Times Electric Co Ltd
- 17.2.13.1. Overview
- 17.2.13.2. Products
- 17.2.13.3. SWOT Analysis
- 17.2.13.4. Recent Developments
- 17.2.13.5. Financials (Based on Availability)
- 17.2.14 Sun King Power Electronics Group Ltd
- 17.2.14.1. Overview
- 17.2.14.2. Products
- 17.2.14.3. SWOT Analysis
- 17.2.14.4. Recent Developments
- 17.2.14.5. Financials (Based on Availability)
- 17.2.15 Raychem RPG Private Limited
- 17.2.15.1. Overview
- 17.2.15.2. Products
- 17.2.15.3. SWOT Analysis
- 17.2.15.4. Recent Developments
- 17.2.15.5. Financials (Based on Availability)
- 17.2.16 EMS Industrial & Service Company
- 17.2.16.1. Overview
- 17.2.16.2. Products
- 17.2.16.3. SWOT Analysis
- 17.2.16.4. Recent Developments
- 17.2.16.5. Financials (Based on Availability)
- 17.2.17 Storm Power Components
- 17.2.17.1. Overview
- 17.2.17.2. Products
- 17.2.17.3. SWOT Analysis
- 17.2.17.4. Recent Developments
- 17.2.17.5. Financials (Based on Availability)
- 17.2.1 Methode Electronics Inc
List of Figures
- Figure 1: Global Laminated Busbar Industry Revenue Breakdown (USD Billion, %) by Region 2024 & 2032
- Figure 2: Global Laminated Busbar Industry Volume Breakdown (K Units, %) by Region 2024 & 2032
- Figure 3: North America Laminated Busbar Industry Revenue (USD Billion), by Country 2024 & 2032
- Figure 4: North America Laminated Busbar Industry Volume (K Units), by Country 2024 & 2032
- Figure 5: North America Laminated Busbar Industry Revenue Share (%), by Country 2024 & 2032
- Figure 6: North America Laminated Busbar Industry Volume Share (%), by Country 2024 & 2032
- Figure 7: Europe Laminated Busbar Industry Revenue (USD Billion), by Country 2024 & 2032
- Figure 8: Europe Laminated Busbar Industry Volume (K Units), by Country 2024 & 2032
- Figure 9: Europe Laminated Busbar Industry Revenue Share (%), by Country 2024 & 2032
- Figure 10: Europe Laminated Busbar Industry Volume Share (%), by Country 2024 & 2032
- Figure 11: Asia Pacific Laminated Busbar Industry Revenue (USD Billion), by Country 2024 & 2032
- Figure 12: Asia Pacific Laminated Busbar Industry Volume (K Units), by Country 2024 & 2032
- Figure 13: Asia Pacific Laminated Busbar Industry Revenue Share (%), by Country 2024 & 2032
- Figure 14: Asia Pacific Laminated Busbar Industry Volume Share (%), by Country 2024 & 2032
- Figure 15: South America Laminated Busbar Industry Revenue (USD Billion), by Country 2024 & 2032
- Figure 16: South America Laminated Busbar Industry Volume (K Units), by Country 2024 & 2032
- Figure 17: South America Laminated Busbar Industry Revenue Share (%), by Country 2024 & 2032
- Figure 18: South America Laminated Busbar Industry Volume Share (%), by Country 2024 & 2032
- Figure 19: North America Laminated Busbar Industry Revenue (USD Billion), by Country 2024 & 2032
- Figure 20: North America Laminated Busbar Industry Volume (K Units), by Country 2024 & 2032
- Figure 21: North America Laminated Busbar Industry Revenue Share (%), by Country 2024 & 2032
- Figure 22: North America Laminated Busbar Industry Volume Share (%), by Country 2024 & 2032
- Figure 23: MEA Laminated Busbar Industry Revenue (USD Billion), by Country 2024 & 2032
- Figure 24: MEA Laminated Busbar Industry Volume (K Units), by Country 2024 & 2032
- Figure 25: MEA Laminated Busbar Industry Revenue Share (%), by Country 2024 & 2032
- Figure 26: MEA Laminated Busbar Industry Volume Share (%), by Country 2024 & 2032
- Figure 27: North America Laminated Busbar Industry Revenue (USD Billion), by Material 2024 & 2032
- Figure 28: North America Laminated Busbar Industry Volume (K Units), by Material 2024 & 2032
- Figure 29: North America Laminated Busbar Industry Revenue Share (%), by Material 2024 & 2032
- Figure 30: North America Laminated Busbar Industry Volume Share (%), by Material 2024 & 2032
- Figure 31: North America Laminated Busbar Industry Revenue (USD Billion), by Insulation Material 2024 & 2032
- Figure 32: North America Laminated Busbar Industry Volume (K Units), by Insulation Material 2024 & 2032
- Figure 33: North America Laminated Busbar Industry Revenue Share (%), by Insulation Material 2024 & 2032
- Figure 34: North America Laminated Busbar Industry Volume Share (%), by Insulation Material 2024 & 2032
- Figure 35: North America Laminated Busbar Industry Revenue (USD Billion), by End-User 2024 & 2032
- Figure 36: North America Laminated Busbar Industry Volume (K Units), by End-User 2024 & 2032
- Figure 37: North America Laminated Busbar Industry Revenue Share (%), by End-User 2024 & 2032
- Figure 38: North America Laminated Busbar Industry Volume Share (%), by End-User 2024 & 2032
- Figure 39: North America Laminated Busbar Industry Revenue (USD Billion), by Country 2024 & 2032
- Figure 40: North America Laminated Busbar Industry Volume (K Units), by Country 2024 & 2032
- Figure 41: North America Laminated Busbar Industry Revenue Share (%), by Country 2024 & 2032
- Figure 42: North America Laminated Busbar Industry Volume Share (%), by Country 2024 & 2032
- Figure 43: Europe Laminated Busbar Industry Revenue (USD Billion), by Material 2024 & 2032
- Figure 44: Europe Laminated Busbar Industry Volume (K Units), by Material 2024 & 2032
- Figure 45: Europe Laminated Busbar Industry Revenue Share (%), by Material 2024 & 2032
- Figure 46: Europe Laminated Busbar Industry Volume Share (%), by Material 2024 & 2032
- Figure 47: Europe Laminated Busbar Industry Revenue (USD Billion), by Insulation Material 2024 & 2032
- Figure 48: Europe Laminated Busbar Industry Volume (K Units), by Insulation Material 2024 & 2032
- Figure 49: Europe Laminated Busbar Industry Revenue Share (%), by Insulation Material 2024 & 2032
- Figure 50: Europe Laminated Busbar Industry Volume Share (%), by Insulation Material 2024 & 2032
- Figure 51: Europe Laminated Busbar Industry Revenue (USD Billion), by End-User 2024 & 2032
- Figure 52: Europe Laminated Busbar Industry Volume (K Units), by End-User 2024 & 2032
- Figure 53: Europe Laminated Busbar Industry Revenue Share (%), by End-User 2024 & 2032
- Figure 54: Europe Laminated Busbar Industry Volume Share (%), by End-User 2024 & 2032
- Figure 55: Europe Laminated Busbar Industry Revenue (USD Billion), by Country 2024 & 2032
- Figure 56: Europe Laminated Busbar Industry Volume (K Units), by Country 2024 & 2032
- Figure 57: Europe Laminated Busbar Industry Revenue Share (%), by Country 2024 & 2032
- Figure 58: Europe Laminated Busbar Industry Volume Share (%), by Country 2024 & 2032
- Figure 59: Asia Pacific Laminated Busbar Industry Revenue (USD Billion), by Material 2024 & 2032
- Figure 60: Asia Pacific Laminated Busbar Industry Volume (K Units), by Material 2024 & 2032
- Figure 61: Asia Pacific Laminated Busbar Industry Revenue Share (%), by Material 2024 & 2032
- Figure 62: Asia Pacific Laminated Busbar Industry Volume Share (%), by Material 2024 & 2032
- Figure 63: Asia Pacific Laminated Busbar Industry Revenue (USD Billion), by Insulation Material 2024 & 2032
- Figure 64: Asia Pacific Laminated Busbar Industry Volume (K Units), by Insulation Material 2024 & 2032
- Figure 65: Asia Pacific Laminated Busbar Industry Revenue Share (%), by Insulation Material 2024 & 2032
- Figure 66: Asia Pacific Laminated Busbar Industry Volume Share (%), by Insulation Material 2024 & 2032
- Figure 67: Asia Pacific Laminated Busbar Industry Revenue (USD Billion), by End-User 2024 & 2032
- Figure 68: Asia Pacific Laminated Busbar Industry Volume (K Units), by End-User 2024 & 2032
- Figure 69: Asia Pacific Laminated Busbar Industry Revenue Share (%), by End-User 2024 & 2032
- Figure 70: Asia Pacific Laminated Busbar Industry Volume Share (%), by End-User 2024 & 2032
- Figure 71: Asia Pacific Laminated Busbar Industry Revenue (USD Billion), by Country 2024 & 2032
- Figure 72: Asia Pacific Laminated Busbar Industry Volume (K Units), by Country 2024 & 2032
- Figure 73: Asia Pacific Laminated Busbar Industry Revenue Share (%), by Country 2024 & 2032
- Figure 74: Asia Pacific Laminated Busbar Industry Volume Share (%), by Country 2024 & 2032
- Figure 75: South America Laminated Busbar Industry Revenue (USD Billion), by Material 2024 & 2032
- Figure 76: South America Laminated Busbar Industry Volume (K Units), by Material 2024 & 2032
- Figure 77: South America Laminated Busbar Industry Revenue Share (%), by Material 2024 & 2032
- Figure 78: South America Laminated Busbar Industry Volume Share (%), by Material 2024 & 2032
- Figure 79: South America Laminated Busbar Industry Revenue (USD Billion), by Insulation Material 2024 & 2032
- Figure 80: South America Laminated Busbar Industry Volume (K Units), by Insulation Material 2024 & 2032
- Figure 81: South America Laminated Busbar Industry Revenue Share (%), by Insulation Material 2024 & 2032
- Figure 82: South America Laminated Busbar Industry Volume Share (%), by Insulation Material 2024 & 2032
- Figure 83: South America Laminated Busbar Industry Revenue (USD Billion), by End-User 2024 & 2032
- Figure 84: South America Laminated Busbar Industry Volume (K Units), by End-User 2024 & 2032
- Figure 85: South America Laminated Busbar Industry Revenue Share (%), by End-User 2024 & 2032
- Figure 86: South America Laminated Busbar Industry Volume Share (%), by End-User 2024 & 2032
- Figure 87: South America Laminated Busbar Industry Revenue (USD Billion), by Country 2024 & 2032
- Figure 88: South America Laminated Busbar Industry Volume (K Units), by Country 2024 & 2032
- Figure 89: South America Laminated Busbar Industry Revenue Share (%), by Country 2024 & 2032
- Figure 90: South America Laminated Busbar Industry Volume Share (%), by Country 2024 & 2032
- Figure 91: Middle East Laminated Busbar Industry Revenue (USD Billion), by Material 2024 & 2032
- Figure 92: Middle East Laminated Busbar Industry Volume (K Units), by Material 2024 & 2032
- Figure 93: Middle East Laminated Busbar Industry Revenue Share (%), by Material 2024 & 2032
- Figure 94: Middle East Laminated Busbar Industry Volume Share (%), by Material 2024 & 2032
- Figure 95: Middle East Laminated Busbar Industry Revenue (USD Billion), by Insulation Material 2024 & 2032
- Figure 96: Middle East Laminated Busbar Industry Volume (K Units), by Insulation Material 2024 & 2032
- Figure 97: Middle East Laminated Busbar Industry Revenue Share (%), by Insulation Material 2024 & 2032
- Figure 98: Middle East Laminated Busbar Industry Volume Share (%), by Insulation Material 2024 & 2032
- Figure 99: Middle East Laminated Busbar Industry Revenue (USD Billion), by End-User 2024 & 2032
- Figure 100: Middle East Laminated Busbar Industry Volume (K Units), by End-User 2024 & 2032
- Figure 101: Middle East Laminated Busbar Industry Revenue Share (%), by End-User 2024 & 2032
- Figure 102: Middle East Laminated Busbar Industry Volume Share (%), by End-User 2024 & 2032
- Figure 103: Middle East Laminated Busbar Industry Revenue (USD Billion), by Country 2024 & 2032
- Figure 104: Middle East Laminated Busbar Industry Volume (K Units), by Country 2024 & 2032
- Figure 105: Middle East Laminated Busbar Industry Revenue Share (%), by Country 2024 & 2032
- Figure 106: Middle East Laminated Busbar Industry Volume Share (%), by Country 2024 & 2032
List of Tables
- Table 1: Global Laminated Busbar Industry Revenue USD Billion Forecast, by Region 2019 & 2032
- Table 2: Global Laminated Busbar Industry Volume K Units Forecast, by Region 2019 & 2032
- Table 3: Global Laminated Busbar Industry Revenue USD Billion Forecast, by Material 2019 & 2032
- Table 4: Global Laminated Busbar Industry Volume K Units Forecast, by Material 2019 & 2032
- Table 5: Global Laminated Busbar Industry Revenue USD Billion Forecast, by Insulation Material 2019 & 2032
- Table 6: Global Laminated Busbar Industry Volume K Units Forecast, by Insulation Material 2019 & 2032
- Table 7: Global Laminated Busbar Industry Revenue USD Billion Forecast, by End-User 2019 & 2032
- Table 8: Global Laminated Busbar Industry Volume K Units Forecast, by End-User 2019 & 2032
- Table 9: Global Laminated Busbar Industry Revenue USD Billion Forecast, by Region 2019 & 2032
- Table 10: Global Laminated Busbar Industry Volume K Units Forecast, by Region 2019 & 2032
- Table 11: Global Laminated Busbar Industry Revenue USD Billion Forecast, by Country 2019 & 2032
- Table 12: Global Laminated Busbar Industry Volume K Units Forecast, by Country 2019 & 2032
- Table 13: United States Laminated Busbar Industry Revenue (USD Billion) Forecast, by Application 2019 & 2032
- Table 14: United States Laminated Busbar Industry Volume (K Units) Forecast, by Application 2019 & 2032
- Table 15: Canada Laminated Busbar Industry Revenue (USD Billion) Forecast, by Application 2019 & 2032
- Table 16: Canada Laminated Busbar Industry Volume (K Units) Forecast, by Application 2019 & 2032
- Table 17: Mexico Laminated Busbar Industry Revenue (USD Billion) Forecast, by Application 2019 & 2032
- Table 18: Mexico Laminated Busbar Industry Volume (K Units) Forecast, by Application 2019 & 2032
- Table 19: Global Laminated Busbar Industry Revenue USD Billion Forecast, by Country 2019 & 2032
- Table 20: Global Laminated Busbar Industry Volume K Units Forecast, by Country 2019 & 2032
- Table 21: Germany Laminated Busbar Industry Revenue (USD Billion) Forecast, by Application 2019 & 2032
- Table 22: Germany Laminated Busbar Industry Volume (K Units) Forecast, by Application 2019 & 2032
- Table 23: United Kingdom Laminated Busbar Industry Revenue (USD Billion) Forecast, by Application 2019 & 2032
- Table 24: United Kingdom Laminated Busbar Industry Volume (K Units) Forecast, by Application 2019 & 2032
- Table 25: France Laminated Busbar Industry Revenue (USD Billion) Forecast, by Application 2019 & 2032
- Table 26: France Laminated Busbar Industry Volume (K Units) Forecast, by Application 2019 & 2032
- Table 27: Spain Laminated Busbar Industry Revenue (USD Billion) Forecast, by Application 2019 & 2032
- Table 28: Spain Laminated Busbar Industry Volume (K Units) Forecast, by Application 2019 & 2032
- Table 29: Italy Laminated Busbar Industry Revenue (USD Billion) Forecast, by Application 2019 & 2032
- Table 30: Italy Laminated Busbar Industry Volume (K Units) Forecast, by Application 2019 & 2032
- Table 31: Spain Laminated Busbar Industry Revenue (USD Billion) Forecast, by Application 2019 & 2032
- Table 32: Spain Laminated Busbar Industry Volume (K Units) Forecast, by Application 2019 & 2032
- Table 33: Belgium Laminated Busbar Industry Revenue (USD Billion) Forecast, by Application 2019 & 2032
- Table 34: Belgium Laminated Busbar Industry Volume (K Units) Forecast, by Application 2019 & 2032
- Table 35: Netherland Laminated Busbar Industry Revenue (USD Billion) Forecast, by Application 2019 & 2032
- Table 36: Netherland Laminated Busbar Industry Volume (K Units) Forecast, by Application 2019 & 2032
- Table 37: Nordics Laminated Busbar Industry Revenue (USD Billion) Forecast, by Application 2019 & 2032
- Table 38: Nordics Laminated Busbar Industry Volume (K Units) Forecast, by Application 2019 & 2032
- Table 39: Rest of Europe Laminated Busbar Industry Revenue (USD Billion) Forecast, by Application 2019 & 2032
- Table 40: Rest of Europe Laminated Busbar Industry Volume (K Units) Forecast, by Application 2019 & 2032
- Table 41: Global Laminated Busbar Industry Revenue USD Billion Forecast, by Country 2019 & 2032
- Table 42: Global Laminated Busbar Industry Volume K Units Forecast, by Country 2019 & 2032
- Table 43: China Laminated Busbar Industry Revenue (USD Billion) Forecast, by Application 2019 & 2032
- Table 44: China Laminated Busbar Industry Volume (K Units) Forecast, by Application 2019 & 2032
- Table 45: Japan Laminated Busbar Industry Revenue (USD Billion) Forecast, by Application 2019 & 2032
- Table 46: Japan Laminated Busbar Industry Volume (K Units) Forecast, by Application 2019 & 2032
- Table 47: India Laminated Busbar Industry Revenue (USD Billion) Forecast, by Application 2019 & 2032
- Table 48: India Laminated Busbar Industry Volume (K Units) Forecast, by Application 2019 & 2032
- Table 49: South Korea Laminated Busbar Industry Revenue (USD Billion) Forecast, by Application 2019 & 2032
- Table 50: South Korea Laminated Busbar Industry Volume (K Units) Forecast, by Application 2019 & 2032
- Table 51: Southeast Asia Laminated Busbar Industry Revenue (USD Billion) Forecast, by Application 2019 & 2032
- Table 52: Southeast Asia Laminated Busbar Industry Volume (K Units) Forecast, by Application 2019 & 2032
- Table 53: Australia Laminated Busbar Industry Revenue (USD Billion) Forecast, by Application 2019 & 2032
- Table 54: Australia Laminated Busbar Industry Volume (K Units) Forecast, by Application 2019 & 2032
- Table 55: Indonesia Laminated Busbar Industry Revenue (USD Billion) Forecast, by Application 2019 & 2032
- Table 56: Indonesia Laminated Busbar Industry Volume (K Units) Forecast, by Application 2019 & 2032
- Table 57: Phillipes Laminated Busbar Industry Revenue (USD Billion) Forecast, by Application 2019 & 2032
- Table 58: Phillipes Laminated Busbar Industry Volume (K Units) Forecast, by Application 2019 & 2032
- Table 59: Singapore Laminated Busbar Industry Revenue (USD Billion) Forecast, by Application 2019 & 2032
- Table 60: Singapore Laminated Busbar Industry Volume (K Units) Forecast, by Application 2019 & 2032
- Table 61: Thailandc Laminated Busbar Industry Revenue (USD Billion) Forecast, by Application 2019 & 2032
- Table 62: Thailandc Laminated Busbar Industry Volume (K Units) Forecast, by Application 2019 & 2032
- Table 63: Rest of Asia Pacific Laminated Busbar Industry Revenue (USD Billion) Forecast, by Application 2019 & 2032
- Table 64: Rest of Asia Pacific Laminated Busbar Industry Volume (K Units) Forecast, by Application 2019 & 2032
- Table 65: Global Laminated Busbar Industry Revenue USD Billion Forecast, by Country 2019 & 2032
- Table 66: Global Laminated Busbar Industry Volume K Units Forecast, by Country 2019 & 2032
- Table 67: Brazil Laminated Busbar Industry Revenue (USD Billion) Forecast, by Application 2019 & 2032
- Table 68: Brazil Laminated Busbar Industry Volume (K Units) Forecast, by Application 2019 & 2032
- Table 69: Argentina Laminated Busbar Industry Revenue (USD Billion) Forecast, by Application 2019 & 2032
- Table 70: Argentina Laminated Busbar Industry Volume (K Units) Forecast, by Application 2019 & 2032
- Table 71: Peru Laminated Busbar Industry Revenue (USD Billion) Forecast, by Application 2019 & 2032
- Table 72: Peru Laminated Busbar Industry Volume (K Units) Forecast, by Application 2019 & 2032
- Table 73: Chile Laminated Busbar Industry Revenue (USD Billion) Forecast, by Application 2019 & 2032
- Table 74: Chile Laminated Busbar Industry Volume (K Units) Forecast, by Application 2019 & 2032
- Table 75: Colombia Laminated Busbar Industry Revenue (USD Billion) Forecast, by Application 2019 & 2032
- Table 76: Colombia Laminated Busbar Industry Volume (K Units) Forecast, by Application 2019 & 2032
- Table 77: Ecuador Laminated Busbar Industry Revenue (USD Billion) Forecast, by Application 2019 & 2032
- Table 78: Ecuador Laminated Busbar Industry Volume (K Units) Forecast, by Application 2019 & 2032
- Table 79: Venezuela Laminated Busbar Industry Revenue (USD Billion) Forecast, by Application 2019 & 2032
- Table 80: Venezuela Laminated Busbar Industry Volume (K Units) Forecast, by Application 2019 & 2032
- Table 81: Rest of South America Laminated Busbar Industry Revenue (USD Billion) Forecast, by Application 2019 & 2032
- Table 82: Rest of South America Laminated Busbar Industry Volume (K Units) Forecast, by Application 2019 & 2032
- Table 83: Global Laminated Busbar Industry Revenue USD Billion Forecast, by Country 2019 & 2032
- Table 84: Global Laminated Busbar Industry Volume K Units Forecast, by Country 2019 & 2032
- Table 85: United States Laminated Busbar Industry Revenue (USD Billion) Forecast, by Application 2019 & 2032
- Table 86: United States Laminated Busbar Industry Volume (K Units) Forecast, by Application 2019 & 2032
- Table 87: Canada Laminated Busbar Industry Revenue (USD Billion) Forecast, by Application 2019 & 2032
- Table 88: Canada Laminated Busbar Industry Volume (K Units) Forecast, by Application 2019 & 2032
- Table 89: Mexico Laminated Busbar Industry Revenue (USD Billion) Forecast, by Application 2019 & 2032
- Table 90: Mexico Laminated Busbar Industry Volume (K Units) Forecast, by Application 2019 & 2032
- Table 91: Global Laminated Busbar Industry Revenue USD Billion Forecast, by Country 2019 & 2032
- Table 92: Global Laminated Busbar Industry Volume K Units Forecast, by Country 2019 & 2032
- Table 93: United Arab Emirates Laminated Busbar Industry Revenue (USD Billion) Forecast, by Application 2019 & 2032
- Table 94: United Arab Emirates Laminated Busbar Industry Volume (K Units) Forecast, by Application 2019 & 2032
- Table 95: Saudi Arabia Laminated Busbar Industry Revenue (USD Billion) Forecast, by Application 2019 & 2032
- Table 96: Saudi Arabia Laminated Busbar Industry Volume (K Units) Forecast, by Application 2019 & 2032
- Table 97: South Africa Laminated Busbar Industry Revenue (USD Billion) Forecast, by Application 2019 & 2032
- Table 98: South Africa Laminated Busbar Industry Volume (K Units) Forecast, by Application 2019 & 2032
- Table 99: Rest of Middle East and Africa Laminated Busbar Industry Revenue (USD Billion) Forecast, by Application 2019 & 2032
- Table 100: Rest of Middle East and Africa Laminated Busbar Industry Volume (K Units) Forecast, by Application 2019 & 2032
- Table 101: Global Laminated Busbar Industry Revenue USD Billion Forecast, by Material 2019 & 2032
- Table 102: Global Laminated Busbar Industry Volume K Units Forecast, by Material 2019 & 2032
- Table 103: Global Laminated Busbar Industry Revenue USD Billion Forecast, by Insulation Material 2019 & 2032
- Table 104: Global Laminated Busbar Industry Volume K Units Forecast, by Insulation Material 2019 & 2032
- Table 105: Global Laminated Busbar Industry Revenue USD Billion Forecast, by End-User 2019 & 2032
- Table 106: Global Laminated Busbar Industry Volume K Units Forecast, by End-User 2019 & 2032
- Table 107: Global Laminated Busbar Industry Revenue USD Billion Forecast, by Country 2019 & 2032
- Table 108: Global Laminated Busbar Industry Volume K Units Forecast, by Country 2019 & 2032
- Table 109: Global Laminated Busbar Industry Revenue USD Billion Forecast, by Material 2019 & 2032
- Table 110: Global Laminated Busbar Industry Volume K Units Forecast, by Material 2019 & 2032
- Table 111: Global Laminated Busbar Industry Revenue USD Billion Forecast, by Insulation Material 2019 & 2032
- Table 112: Global Laminated Busbar Industry Volume K Units Forecast, by Insulation Material 2019 & 2032
- Table 113: Global Laminated Busbar Industry Revenue USD Billion Forecast, by End-User 2019 & 2032
- Table 114: Global Laminated Busbar Industry Volume K Units Forecast, by End-User 2019 & 2032
- Table 115: Global Laminated Busbar Industry Revenue USD Billion Forecast, by Country 2019 & 2032
- Table 116: Global Laminated Busbar Industry Volume K Units Forecast, by Country 2019 & 2032
- Table 117: Global Laminated Busbar Industry Revenue USD Billion Forecast, by Material 2019 & 2032
- Table 118: Global Laminated Busbar Industry Volume K Units Forecast, by Material 2019 & 2032
- Table 119: Global Laminated Busbar Industry Revenue USD Billion Forecast, by Insulation Material 2019 & 2032
- Table 120: Global Laminated Busbar Industry Volume K Units Forecast, by Insulation Material 2019 & 2032
- Table 121: Global Laminated Busbar Industry Revenue USD Billion Forecast, by End-User 2019 & 2032
- Table 122: Global Laminated Busbar Industry Volume K Units Forecast, by End-User 2019 & 2032
- Table 123: Global Laminated Busbar Industry Revenue USD Billion Forecast, by Country 2019 & 2032
- Table 124: Global Laminated Busbar Industry Volume K Units Forecast, by Country 2019 & 2032
- Table 125: Global Laminated Busbar Industry Revenue USD Billion Forecast, by Material 2019 & 2032
- Table 126: Global Laminated Busbar Industry Volume K Units Forecast, by Material 2019 & 2032
- Table 127: Global Laminated Busbar Industry Revenue USD Billion Forecast, by Insulation Material 2019 & 2032
- Table 128: Global Laminated Busbar Industry Volume K Units Forecast, by Insulation Material 2019 & 2032
- Table 129: Global Laminated Busbar Industry Revenue USD Billion Forecast, by End-User 2019 & 2032
- Table 130: Global Laminated Busbar Industry Volume K Units Forecast, by End-User 2019 & 2032
- Table 131: Global Laminated Busbar Industry Revenue USD Billion Forecast, by Country 2019 & 2032
- Table 132: Global Laminated Busbar Industry Volume K Units Forecast, by Country 2019 & 2032
- Table 133: Global Laminated Busbar Industry Revenue USD Billion Forecast, by Material 2019 & 2032
- Table 134: Global Laminated Busbar Industry Volume K Units Forecast, by Material 2019 & 2032
- Table 135: Global Laminated Busbar Industry Revenue USD Billion Forecast, by Insulation Material 2019 & 2032
- Table 136: Global Laminated Busbar Industry Volume K Units Forecast, by Insulation Material 2019 & 2032
- Table 137: Global Laminated Busbar Industry Revenue USD Billion Forecast, by End-User 2019 & 2032
- Table 138: Global Laminated Busbar Industry Volume K Units Forecast, by End-User 2019 & 2032
- Table 139: Global Laminated Busbar Industry Revenue USD Billion Forecast, by Country 2019 & 2032
- Table 140: Global Laminated Busbar Industry Volume K Units Forecast, by Country 2019 & 2032
Frequently Asked Questions
1. What is the projected Compound Annual Growth Rate (CAGR) of the Laminated Busbar Industry?
The projected CAGR is approximately 6.02%.
2. Which companies are prominent players in the Laminated Busbar Industry?
Key companies in the market include Methode Electronics Inc, Suzhou West Deane Machinery Inc, Electronic Systems Packaging LLC, Molex LLC, Ryoden Kasei Co Ltd, Rogers Corporation, Shanghai Eagtop Electronic Technology Co Ltd, Eaton Corporation PLC, Amphenol Corporation, Segue Electronics Inc *List Not Exhaustive, Zhejiang RHI ELectric Co Ltd, Mersen SA, Zhuzhou CRRC Times Electric Co Ltd, Sun King Power Electronics Group Ltd, Raychem RPG Private Limited, EMS Industrial & Service Company, Storm Power Components.
3. What are the main segments of the Laminated Busbar Industry?
The market segments include Material, Insulation Material, End-User.
4. Can you provide details about the market size?
The market size is estimated to be USD 0.78 USD Billion as of 2022.
5. What are some drivers contributing to market growth?
4.; Growing Energy Demand4.; Renewable Energy Transition.
6. What are the notable trends driving market growth?
Power Utility Sub-sector to Dominate the Market.
7. Are there any restraints impacting market growth?
4.; Phasing out of Conventional Sources of Electricity.
8. Can you provide examples of recent developments in the market?
In February 2020, ABB Ltd planned to introduce laminated bus plate technology for low-voltage switchgear. The new technology is combined with the ABB Ability platform, and it offers the highest reliability, better efficiency, maximum safety, more flexibility, and measurable return on investment (ROI).
9. What pricing options are available for accessing the report?
Pricing options include single-user, multi-user, and enterprise licenses priced at USD 4750, USD 5250, and USD 8750 respectively.
10. Is the market size provided in terms of value or volume?
The market size is provided in terms of value, measured in USD Billion and volume, measured in K Units.
11. Are there any specific market keywords associated with the report?
Yes, the market keyword associated with the report is "Laminated Busbar Industry," which aids in identifying and referencing the specific market segment covered.
12. How do I determine which pricing option suits my needs best?
The pricing options vary based on user requirements and access needs. Individual users may opt for single-user licenses, while businesses requiring broader access may choose multi-user or enterprise licenses for cost-effective access to the report.
13. Are there any additional resources or data provided in the Laminated Busbar Industry report?
While the report offers comprehensive insights, it's advisable to review the specific contents or supplementary materials provided to ascertain if additional resources or data are available.
14. How can I stay updated on further developments or reports in the Laminated Busbar Industry?
To stay informed about further developments, trends, and reports in the Laminated Busbar Industry, consider subscribing to industry newsletters, following relevant companies and organizations, or regularly checking reputable industry news sources and publications.
Methodology
Step 1 - Identification of Relevant Samples Size from Population Database


Step 2 - Approaches for Defining Global Market Size (Value, Volume* & Price*)

Note*: In applicable scenarios
Step 3 - Data Sources
Primary Research
- Web Analytics
- Survey Reports
- Research Institute
- Latest Research Reports
- Opinion Leaders
Secondary Research
- Annual Reports
- White Paper
- Latest Press Release
- Industry Association
- Paid Database
- Investor Presentations

Step 4 - Data Triangulation
Involves using different sources of information in order to increase the validity of a study
These sources are likely to be stakeholders in a program - participants, other researchers, program staff, other community members, and so on.
Then we put all data in single framework & apply various statistical tools to find out the dynamic on the market.
During the analysis stage, feedback from the stakeholder groups would be compared to determine areas of agreement as well as areas of divergence
