

Key Insights
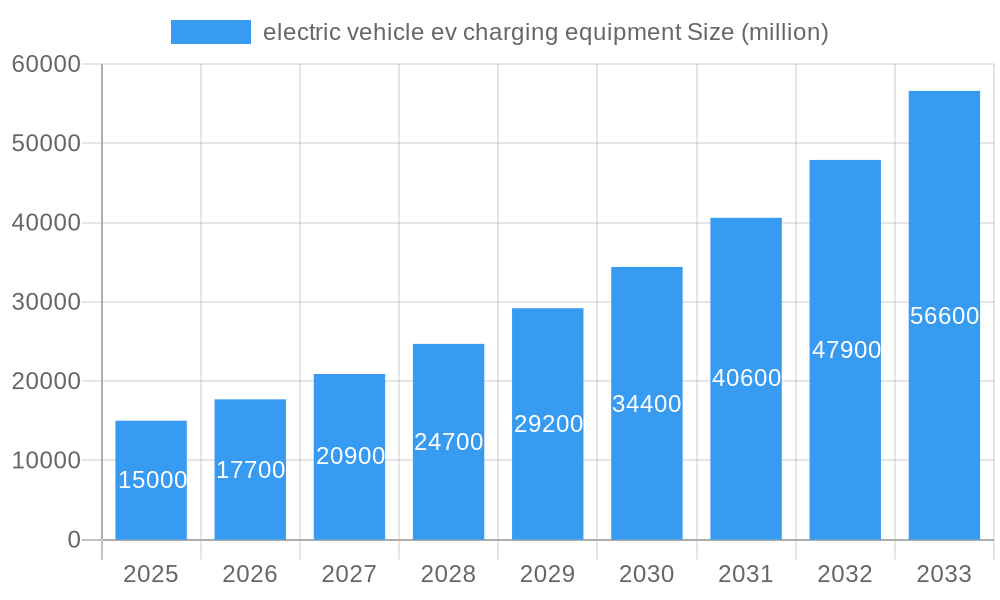
The electric vehicle (EV) charging equipment market is experiencing robust growth, driven by the increasing adoption of electric vehicles globally. The market, estimated at $15 billion in 2025, is projected to expand significantly over the next decade, fueled by supportive government policies, rising environmental concerns, and technological advancements leading to improved charging infrastructure and faster charging speeds. Key growth drivers include the expanding EV fleet, the development of fast-charging technologies like DC fast charging and ultra-fast charging, and increasing investments in public and private charging networks. Market segmentation reveals a strong demand for both AC and DC chargers, with the latter gaining traction due to its speed advantage. Applications span residential, commercial, and public spaces, reflecting the diversified charging needs of EV users. While high initial investment costs and concerns regarding grid infrastructure limitations pose challenges, ongoing innovation and decreasing battery prices are mitigating these restraints. North America and Europe currently dominate the market, but the Asia-Pacific region is expected to witness substantial growth driven by burgeoning EV adoption in countries like China and India. The market is highly competitive, with numerous global players and regional companies vying for market share through technological innovation, strategic partnerships, and expansion initiatives.
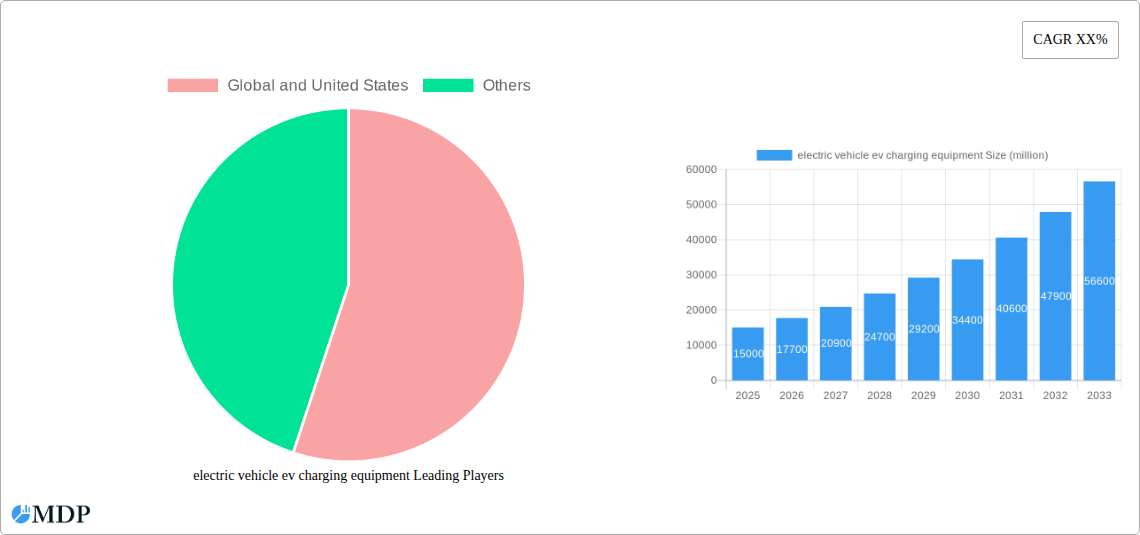
electric vehicle ev charging equipment Market Size (In Billion)
Continued growth is anticipated through 2033, with a projected Compound Annual Growth Rate (CAGR) of 18%. This positive outlook stems from several factors, including the accelerating shift toward electric mobility, improvements in battery technology extending driving range, and the development of smart charging solutions that optimize grid utilization and reduce energy costs. Moreover, the integration of renewable energy sources into charging infrastructure is gaining momentum, aligning with sustainability goals and enhancing the overall appeal of electric vehicles. However, maintaining this growth trajectory will require addressing challenges such as standardization of charging connectors, ensuring equitable access to charging infrastructure across all regions and socioeconomic groups, and scaling up manufacturing capacity to meet the rapidly increasing demand. The long-term prospects for the EV charging equipment market remain incredibly positive, driven by the undeniable global trend toward sustainable transportation.
electric vehicle ev charging equipment Company Market Share
Dive Deep into the Thriving Electric Vehicle (EV) Charging Equipment Market: A Comprehensive Report (2019-2033)
This comprehensive report provides an in-depth analysis of the global and United States electric vehicle (EV) charging equipment market, offering invaluable insights for stakeholders across the industry. From market dynamics and concentration to leading players and future opportunities, this report unveils the key trends shaping this rapidly evolving sector. With a study period spanning 2019-2033, a base year of 2025, and a forecast period of 2025-2033, this report offers a complete and up-to-date perspective. The market is projected to reach $xx million by 2033, exhibiting a CAGR of xx% during the forecast period.
Electric Vehicle EV Charging Equipment Market Dynamics & Concentration
The global EV charging equipment market is experiencing significant growth driven by increasing EV adoption, supportive government policies, and technological advancements. Market concentration is relatively high, with a few major players holding substantial market share. The estimated market share of the top 5 players in 2025 is approximately 60%, indicating a consolidated market structure. However, the entry of new players and innovative startups is anticipated to increase competition. Innovation in charging technologies, such as fast charging and wireless charging, is a primary driver, while regulatory frameworks related to safety and interoperability play a crucial role. Product substitutes, primarily gasoline-powered vehicles, are facing declining market share due to environmental concerns and technological improvements in EV performance and charging infrastructure. End-user trends are shifting towards higher-capacity charging solutions and integrated smart charging systems. M&A activities are frequent, with an estimated xx M&A deals in the historical period (2019-2024), indicating a focus on market consolidation and technological acquisition.
- Market Share: Top 5 players hold approximately 60% of the market in 2025.
- M&A Deals: Approximately xx deals occurred between 2019 and 2024.
- Innovation Drivers: Fast charging, wireless charging, smart charging technologies.
- Regulatory Frameworks: Safety standards, interoperability regulations.
Electric Vehicle EV Charging Equipment Industry Trends & Analysis
The EV charging equipment market is characterized by robust growth, fueled by several key factors. The increasing global adoption of electric vehicles is the primary driver, with sales exceeding xx million units in 2024. This surge in EV adoption necessitates a significant expansion of charging infrastructure. Technological advancements, such as the development of higher-power chargers and sophisticated charging management systems, are accelerating market expansion. Consumer preferences are shifting toward convenient and fast charging options, leading to increased demand for DC fast chargers and public charging stations. Competitive dynamics are intense, with established players and new entrants vying for market share through product innovation, strategic partnerships, and geographic expansion. Market penetration of EV charging stations continues to rise, with xx% penetration rate in major urban areas by 2025. This upward trend is expected to continue throughout the forecast period, driven by supportive government policies and rising consumer demand. The overall market is projected to experience substantial growth, with a compound annual growth rate (CAGR) of xx% from 2025 to 2033.
Leading Markets & Segments in Electric Vehicle EV Charging Equipment
The leading markets for EV charging equipment are concentrated in regions with robust EV adoption and supportive government policies. China and Europe currently dominate the market, but the North American market is experiencing rapid growth.
Dominant Regions & Countries:
- China: High EV sales, government subsidies, and large-scale infrastructure development.
- Europe: Stringent emission regulations, substantial government investments, and growing consumer awareness.
- United States: Increasing EV adoption, state-level incentives, and growing private investment.
Dominant Segments:
- Application: Public charging stations are leading due to increasing demand for convenient charging outside of residential areas.
- Types: DC fast chargers are gaining popularity due to their speed and efficiency, while AC chargers still maintain a significant market share due to their lower cost.
Key drivers for the dominant segments include:
- Economic Policies: Government subsidies, tax incentives, and funding programs for charging infrastructure development.
- Infrastructure: Availability of grid capacity, land acquisition, and permitting processes.
Electric Vehicle EV Charging Equipment Product Developments
Recent product innovations focus on enhanced charging speeds, improved reliability, and smarter charging management systems. The market is witnessing a shift toward higher-power DC fast chargers and the integration of smart technologies enabling features such as load balancing, remote monitoring, and seamless payment processing. These advancements aim to address consumer concerns regarding charging time and charging station availability, ultimately driving greater EV adoption. Key competitive advantages lie in charging speed, reliability, integration capabilities, and pricing strategies.
Key Drivers of Electric Vehicle EV Charging Equipment Growth
Several factors are driving the growth of the EV charging equipment market. Technological advancements, such as the development of faster and more efficient charging technologies, are crucial. Government policies, including subsidies, tax credits, and regulations promoting EV adoption, are significantly boosting market growth. Economic factors, such as declining battery costs and increasing fuel prices, are also fueling demand for EVs and their associated charging infrastructure. Furthermore, rising environmental concerns are promoting the shift toward sustainable transportation solutions.
Challenges in the Electric Vehicle EV Charging Equipment Market
The EV charging equipment market faces several challenges. Regulatory hurdles, such as inconsistent standards and permitting processes across different regions, can hinder market expansion. Supply chain disruptions, particularly regarding critical raw materials for battery production and charger components, can impact production and availability. Intense competition among numerous established players and emerging startups creates pricing pressure. This also leads to significant upfront capital investments in infrastructure development presenting a barrier for new entrants.
Emerging Opportunities in Electric Vehicle EV Charging Equipment
Several factors present significant growth opportunities. Technological breakthroughs in battery technology and charging infrastructure, such as wireless charging and vehicle-to-grid (V2G) technology, will unlock new market segments. Strategic partnerships between EV manufacturers, charging equipment providers, and energy companies can improve charging infrastructure deployment and consumer experience. Market expansion into developing countries with growing EV adoption presents significant potential for growth.
Leading Players in the Electric Vehicle EV Charging Equipment Sector
- ABB
- ChargePoint
- EVgo
- Tesla
- Schneider Electric
- Siemens
- Eaton
- xx
- xx
Key Milestones in Electric Vehicle EV Charging Equipment Industry
- 2020: Significant increase in government funding for EV charging infrastructure development across multiple countries.
- 2021: Launch of several high-power DC fast chargers with charging speeds exceeding 350 kW.
- 2022: Several major mergers and acquisitions within the EV charging equipment sector.
- 2023: Introduction of new wireless charging technologies for EVs.
- 2024: Growing adoption of smart charging management systems.
Strategic Outlook for Electric Vehicle EV Charging Equipment Market
The EV charging equipment market is poised for continued strong growth, driven by increasing EV adoption, technological advancements, and supportive government policies. Opportunities exist in developing advanced charging technologies, expanding charging infrastructure, and creating strategic partnerships to enhance the overall EV user experience. The focus on smart charging, integration with renewable energy sources, and the emergence of new charging models like vehicle-to-grid (V2G) will shape the future of the market.
electric vehicle ev charging equipment Segmentation
- 1. Application
- 2. Types
electric vehicle ev charging equipment Segmentation By Geography
-
1. North America
- 1.1. United States
- 1.2. Canada
- 1.3. Mexico
-
2. South America
- 2.1. Brazil
- 2.2. Argentina
- 2.3. Rest of South America
-
3. Europe
- 3.1. United Kingdom
- 3.2. Germany
- 3.3. France
- 3.4. Italy
- 3.5. Spain
- 3.6. Russia
- 3.7. Benelux
- 3.8. Nordics
- 3.9. Rest of Europe
-
4. Middle East & Africa
- 4.1. Turkey
- 4.2. Israel
- 4.3. GCC
- 4.4. North Africa
- 4.5. South Africa
- 4.6. Rest of Middle East & Africa
-
5. Asia Pacific
- 5.1. China
- 5.2. India
- 5.3. Japan
- 5.4. South Korea
- 5.5. ASEAN
- 5.6. Oceania
- 5.7. Rest of Asia Pacific

electric vehicle ev charging equipment Regional Market Share
Geographic Coverage of electric vehicle ev charging equipment
electric vehicle ev charging equipment REPORT HIGHLIGHTS
| Aspects | Details |
|---|---|
| Study Period | 2020-2034 |
| Base Year | 2025 |
| Estimated Year | 2026 |
| Forecast Period | 2026-2034 |
| Historical Period | 2020-2025 |
| Growth Rate | CAGR of XX% from 2020-2034 |
| Segmentation |
|
Table of Contents
- 1. Introduction
- 1.1. Research Scope
- 1.2. Market Segmentation
- 1.3. Research Methodology
- 1.4. Definitions and Assumptions
- 2. Executive Summary
- 2.1. Introduction
- 3. Market Dynamics
- 3.1. Introduction
- 3.2. Market Drivers
- 3.3. Market Restrains
- 3.4. Market Trends
- 4. Market Factor Analysis
- 4.1. Porters Five Forces
- 4.2. Supply/Value Chain
- 4.3. PESTEL analysis
- 4.4. Market Entropy
- 4.5. Patent/Trademark Analysis
- 5. Global electric vehicle ev charging equipment Analysis, Insights and Forecast, 2020-2032
- 5.1. Market Analysis, Insights and Forecast - by Application
- 5.2. Market Analysis, Insights and Forecast - by Types
- 5.3. Market Analysis, Insights and Forecast - by Region
- 5.3.1. North America
- 5.3.2. South America
- 5.3.3. Europe
- 5.3.4. Middle East & Africa
- 5.3.5. Asia Pacific
- 5.1. Market Analysis, Insights and Forecast - by Application
- 6. North America electric vehicle ev charging equipment Analysis, Insights and Forecast, 2020-2032
- 6.1. Market Analysis, Insights and Forecast - by Application
- 6.2. Market Analysis, Insights and Forecast - by Types
- 6.1. Market Analysis, Insights and Forecast - by Application
- 7. South America electric vehicle ev charging equipment Analysis, Insights and Forecast, 2020-2032
- 7.1. Market Analysis, Insights and Forecast - by Application
- 7.2. Market Analysis, Insights and Forecast - by Types
- 7.1. Market Analysis, Insights and Forecast - by Application
- 8. Europe electric vehicle ev charging equipment Analysis, Insights and Forecast, 2020-2032
- 8.1. Market Analysis, Insights and Forecast - by Application
- 8.2. Market Analysis, Insights and Forecast - by Types
- 8.1. Market Analysis, Insights and Forecast - by Application
- 9. Middle East & Africa electric vehicle ev charging equipment Analysis, Insights and Forecast, 2020-2032
- 9.1. Market Analysis, Insights and Forecast - by Application
- 9.2. Market Analysis, Insights and Forecast - by Types
- 9.1. Market Analysis, Insights and Forecast - by Application
- 10. Asia Pacific electric vehicle ev charging equipment Analysis, Insights and Forecast, 2020-2032
- 10.1. Market Analysis, Insights and Forecast - by Application
- 10.2. Market Analysis, Insights and Forecast - by Types
- 10.1. Market Analysis, Insights and Forecast - by Application
- 11. Competitive Analysis
- 11.1. Global Market Share Analysis 2025
- 11.2. Company Profiles
- 11.2.1. Global and United States
List of Figures
- Figure 1: Global electric vehicle ev charging equipment Revenue Breakdown (million, %) by Region 2025 & 2033
- Figure 2: Global electric vehicle ev charging equipment Volume Breakdown (K, %) by Region 2025 & 2033
- Figure 3: North America electric vehicle ev charging equipment Revenue (million), by Application 2025 & 2033
- Figure 4: North America electric vehicle ev charging equipment Volume (K), by Application 2025 & 2033
- Figure 5: North America electric vehicle ev charging equipment Revenue Share (%), by Application 2025 & 2033
- Figure 6: North America electric vehicle ev charging equipment Volume Share (%), by Application 2025 & 2033
- Figure 7: North America electric vehicle ev charging equipment Revenue (million), by Types 2025 & 2033
- Figure 8: North America electric vehicle ev charging equipment Volume (K), by Types 2025 & 2033
- Figure 9: North America electric vehicle ev charging equipment Revenue Share (%), by Types 2025 & 2033
- Figure 10: North America electric vehicle ev charging equipment Volume Share (%), by Types 2025 & 2033
- Figure 11: North America electric vehicle ev charging equipment Revenue (million), by Country 2025 & 2033
- Figure 12: North America electric vehicle ev charging equipment Volume (K), by Country 2025 & 2033
- Figure 13: North America electric vehicle ev charging equipment Revenue Share (%), by Country 2025 & 2033
- Figure 14: North America electric vehicle ev charging equipment Volume Share (%), by Country 2025 & 2033
- Figure 15: South America electric vehicle ev charging equipment Revenue (million), by Application 2025 & 2033
- Figure 16: South America electric vehicle ev charging equipment Volume (K), by Application 2025 & 2033
- Figure 17: South America electric vehicle ev charging equipment Revenue Share (%), by Application 2025 & 2033
- Figure 18: South America electric vehicle ev charging equipment Volume Share (%), by Application 2025 & 2033
- Figure 19: South America electric vehicle ev charging equipment Revenue (million), by Types 2025 & 2033
- Figure 20: South America electric vehicle ev charging equipment Volume (K), by Types 2025 & 2033
- Figure 21: South America electric vehicle ev charging equipment Revenue Share (%), by Types 2025 & 2033
- Figure 22: South America electric vehicle ev charging equipment Volume Share (%), by Types 2025 & 2033
- Figure 23: South America electric vehicle ev charging equipment Revenue (million), by Country 2025 & 2033
- Figure 24: South America electric vehicle ev charging equipment Volume (K), by Country 2025 & 2033
- Figure 25: South America electric vehicle ev charging equipment Revenue Share (%), by Country 2025 & 2033
- Figure 26: South America electric vehicle ev charging equipment Volume Share (%), by Country 2025 & 2033
- Figure 27: Europe electric vehicle ev charging equipment Revenue (million), by Application 2025 & 2033
- Figure 28: Europe electric vehicle ev charging equipment Volume (K), by Application 2025 & 2033
- Figure 29: Europe electric vehicle ev charging equipment Revenue Share (%), by Application 2025 & 2033
- Figure 30: Europe electric vehicle ev charging equipment Volume Share (%), by Application 2025 & 2033
- Figure 31: Europe electric vehicle ev charging equipment Revenue (million), by Types 2025 & 2033
- Figure 32: Europe electric vehicle ev charging equipment Volume (K), by Types 2025 & 2033
- Figure 33: Europe electric vehicle ev charging equipment Revenue Share (%), by Types 2025 & 2033
- Figure 34: Europe electric vehicle ev charging equipment Volume Share (%), by Types 2025 & 2033
- Figure 35: Europe electric vehicle ev charging equipment Revenue (million), by Country 2025 & 2033
- Figure 36: Europe electric vehicle ev charging equipment Volume (K), by Country 2025 & 2033
- Figure 37: Europe electric vehicle ev charging equipment Revenue Share (%), by Country 2025 & 2033
- Figure 38: Europe electric vehicle ev charging equipment Volume Share (%), by Country 2025 & 2033
- Figure 39: Middle East & Africa electric vehicle ev charging equipment Revenue (million), by Application 2025 & 2033
- Figure 40: Middle East & Africa electric vehicle ev charging equipment Volume (K), by Application 2025 & 2033
- Figure 41: Middle East & Africa electric vehicle ev charging equipment Revenue Share (%), by Application 2025 & 2033
- Figure 42: Middle East & Africa electric vehicle ev charging equipment Volume Share (%), by Application 2025 & 2033
- Figure 43: Middle East & Africa electric vehicle ev charging equipment Revenue (million), by Types 2025 & 2033
- Figure 44: Middle East & Africa electric vehicle ev charging equipment Volume (K), by Types 2025 & 2033
- Figure 45: Middle East & Africa electric vehicle ev charging equipment Revenue Share (%), by Types 2025 & 2033
- Figure 46: Middle East & Africa electric vehicle ev charging equipment Volume Share (%), by Types 2025 & 2033
- Figure 47: Middle East & Africa electric vehicle ev charging equipment Revenue (million), by Country 2025 & 2033
- Figure 48: Middle East & Africa electric vehicle ev charging equipment Volume (K), by Country 2025 & 2033
- Figure 49: Middle East & Africa electric vehicle ev charging equipment Revenue Share (%), by Country 2025 & 2033
- Figure 50: Middle East & Africa electric vehicle ev charging equipment Volume Share (%), by Country 2025 & 2033
- Figure 51: Asia Pacific electric vehicle ev charging equipment Revenue (million), by Application 2025 & 2033
- Figure 52: Asia Pacific electric vehicle ev charging equipment Volume (K), by Application 2025 & 2033
- Figure 53: Asia Pacific electric vehicle ev charging equipment Revenue Share (%), by Application 2025 & 2033
- Figure 54: Asia Pacific electric vehicle ev charging equipment Volume Share (%), by Application 2025 & 2033
- Figure 55: Asia Pacific electric vehicle ev charging equipment Revenue (million), by Types 2025 & 2033
- Figure 56: Asia Pacific electric vehicle ev charging equipment Volume (K), by Types 2025 & 2033
- Figure 57: Asia Pacific electric vehicle ev charging equipment Revenue Share (%), by Types 2025 & 2033
- Figure 58: Asia Pacific electric vehicle ev charging equipment Volume Share (%), by Types 2025 & 2033
- Figure 59: Asia Pacific electric vehicle ev charging equipment Revenue (million), by Country 2025 & 2033
- Figure 60: Asia Pacific electric vehicle ev charging equipment Volume (K), by Country 2025 & 2033
- Figure 61: Asia Pacific electric vehicle ev charging equipment Revenue Share (%), by Country 2025 & 2033
- Figure 62: Asia Pacific electric vehicle ev charging equipment Volume Share (%), by Country 2025 & 2033
List of Tables
- Table 1: Global electric vehicle ev charging equipment Revenue million Forecast, by Application 2020 & 2033
- Table 2: Global electric vehicle ev charging equipment Volume K Forecast, by Application 2020 & 2033
- Table 3: Global electric vehicle ev charging equipment Revenue million Forecast, by Types 2020 & 2033
- Table 4: Global electric vehicle ev charging equipment Volume K Forecast, by Types 2020 & 2033
- Table 5: Global electric vehicle ev charging equipment Revenue million Forecast, by Region 2020 & 2033
- Table 6: Global electric vehicle ev charging equipment Volume K Forecast, by Region 2020 & 2033
- Table 7: Global electric vehicle ev charging equipment Revenue million Forecast, by Application 2020 & 2033
- Table 8: Global electric vehicle ev charging equipment Volume K Forecast, by Application 2020 & 2033
- Table 9: Global electric vehicle ev charging equipment Revenue million Forecast, by Types 2020 & 2033
- Table 10: Global electric vehicle ev charging equipment Volume K Forecast, by Types 2020 & 2033
- Table 11: Global electric vehicle ev charging equipment Revenue million Forecast, by Country 2020 & 2033
- Table 12: Global electric vehicle ev charging equipment Volume K Forecast, by Country 2020 & 2033
- Table 13: United States electric vehicle ev charging equipment Revenue (million) Forecast, by Application 2020 & 2033
- Table 14: United States electric vehicle ev charging equipment Volume (K) Forecast, by Application 2020 & 2033
- Table 15: Canada electric vehicle ev charging equipment Revenue (million) Forecast, by Application 2020 & 2033
- Table 16: Canada electric vehicle ev charging equipment Volume (K) Forecast, by Application 2020 & 2033
- Table 17: Mexico electric vehicle ev charging equipment Revenue (million) Forecast, by Application 2020 & 2033
- Table 18: Mexico electric vehicle ev charging equipment Volume (K) Forecast, by Application 2020 & 2033
- Table 19: Global electric vehicle ev charging equipment Revenue million Forecast, by Application 2020 & 2033
- Table 20: Global electric vehicle ev charging equipment Volume K Forecast, by Application 2020 & 2033
- Table 21: Global electric vehicle ev charging equipment Revenue million Forecast, by Types 2020 & 2033
- Table 22: Global electric vehicle ev charging equipment Volume K Forecast, by Types 2020 & 2033
- Table 23: Global electric vehicle ev charging equipment Revenue million Forecast, by Country 2020 & 2033
- Table 24: Global electric vehicle ev charging equipment Volume K Forecast, by Country 2020 & 2033
- Table 25: Brazil electric vehicle ev charging equipment Revenue (million) Forecast, by Application 2020 & 2033
- Table 26: Brazil electric vehicle ev charging equipment Volume (K) Forecast, by Application 2020 & 2033
- Table 27: Argentina electric vehicle ev charging equipment Revenue (million) Forecast, by Application 2020 & 2033
- Table 28: Argentina electric vehicle ev charging equipment Volume (K) Forecast, by Application 2020 & 2033
- Table 29: Rest of South America electric vehicle ev charging equipment Revenue (million) Forecast, by Application 2020 & 2033
- Table 30: Rest of South America electric vehicle ev charging equipment Volume (K) Forecast, by Application 2020 & 2033
- Table 31: Global electric vehicle ev charging equipment Revenue million Forecast, by Application 2020 & 2033
- Table 32: Global electric vehicle ev charging equipment Volume K Forecast, by Application 2020 & 2033
- Table 33: Global electric vehicle ev charging equipment Revenue million Forecast, by Types 2020 & 2033
- Table 34: Global electric vehicle ev charging equipment Volume K Forecast, by Types 2020 & 2033
- Table 35: Global electric vehicle ev charging equipment Revenue million Forecast, by Country 2020 & 2033
- Table 36: Global electric vehicle ev charging equipment Volume K Forecast, by Country 2020 & 2033
- Table 37: United Kingdom electric vehicle ev charging equipment Revenue (million) Forecast, by Application 2020 & 2033
- Table 38: United Kingdom electric vehicle ev charging equipment Volume (K) Forecast, by Application 2020 & 2033
- Table 39: Germany electric vehicle ev charging equipment Revenue (million) Forecast, by Application 2020 & 2033
- Table 40: Germany electric vehicle ev charging equipment Volume (K) Forecast, by Application 2020 & 2033
- Table 41: France electric vehicle ev charging equipment Revenue (million) Forecast, by Application 2020 & 2033
- Table 42: France electric vehicle ev charging equipment Volume (K) Forecast, by Application 2020 & 2033
- Table 43: Italy electric vehicle ev charging equipment Revenue (million) Forecast, by Application 2020 & 2033
- Table 44: Italy electric vehicle ev charging equipment Volume (K) Forecast, by Application 2020 & 2033
- Table 45: Spain electric vehicle ev charging equipment Revenue (million) Forecast, by Application 2020 & 2033
- Table 46: Spain electric vehicle ev charging equipment Volume (K) Forecast, by Application 2020 & 2033
- Table 47: Russia electric vehicle ev charging equipment Revenue (million) Forecast, by Application 2020 & 2033
- Table 48: Russia electric vehicle ev charging equipment Volume (K) Forecast, by Application 2020 & 2033
- Table 49: Benelux electric vehicle ev charging equipment Revenue (million) Forecast, by Application 2020 & 2033
- Table 50: Benelux electric vehicle ev charging equipment Volume (K) Forecast, by Application 2020 & 2033
- Table 51: Nordics electric vehicle ev charging equipment Revenue (million) Forecast, by Application 2020 & 2033
- Table 52: Nordics electric vehicle ev charging equipment Volume (K) Forecast, by Application 2020 & 2033
- Table 53: Rest of Europe electric vehicle ev charging equipment Revenue (million) Forecast, by Application 2020 & 2033
- Table 54: Rest of Europe electric vehicle ev charging equipment Volume (K) Forecast, by Application 2020 & 2033
- Table 55: Global electric vehicle ev charging equipment Revenue million Forecast, by Application 2020 & 2033
- Table 56: Global electric vehicle ev charging equipment Volume K Forecast, by Application 2020 & 2033
- Table 57: Global electric vehicle ev charging equipment Revenue million Forecast, by Types 2020 & 2033
- Table 58: Global electric vehicle ev charging equipment Volume K Forecast, by Types 2020 & 2033
- Table 59: Global electric vehicle ev charging equipment Revenue million Forecast, by Country 2020 & 2033
- Table 60: Global electric vehicle ev charging equipment Volume K Forecast, by Country 2020 & 2033
- Table 61: Turkey electric vehicle ev charging equipment Revenue (million) Forecast, by Application 2020 & 2033
- Table 62: Turkey electric vehicle ev charging equipment Volume (K) Forecast, by Application 2020 & 2033
- Table 63: Israel electric vehicle ev charging equipment Revenue (million) Forecast, by Application 2020 & 2033
- Table 64: Israel electric vehicle ev charging equipment Volume (K) Forecast, by Application 2020 & 2033
- Table 65: GCC electric vehicle ev charging equipment Revenue (million) Forecast, by Application 2020 & 2033
- Table 66: GCC electric vehicle ev charging equipment Volume (K) Forecast, by Application 2020 & 2033
- Table 67: North Africa electric vehicle ev charging equipment Revenue (million) Forecast, by Application 2020 & 2033
- Table 68: North Africa electric vehicle ev charging equipment Volume (K) Forecast, by Application 2020 & 2033
- Table 69: South Africa electric vehicle ev charging equipment Revenue (million) Forecast, by Application 2020 & 2033
- Table 70: South Africa electric vehicle ev charging equipment Volume (K) Forecast, by Application 2020 & 2033
- Table 71: Rest of Middle East & Africa electric vehicle ev charging equipment Revenue (million) Forecast, by Application 2020 & 2033
- Table 72: Rest of Middle East & Africa electric vehicle ev charging equipment Volume (K) Forecast, by Application 2020 & 2033
- Table 73: Global electric vehicle ev charging equipment Revenue million Forecast, by Application 2020 & 2033
- Table 74: Global electric vehicle ev charging equipment Volume K Forecast, by Application 2020 & 2033
- Table 75: Global electric vehicle ev charging equipment Revenue million Forecast, by Types 2020 & 2033
- Table 76: Global electric vehicle ev charging equipment Volume K Forecast, by Types 2020 & 2033
- Table 77: Global electric vehicle ev charging equipment Revenue million Forecast, by Country 2020 & 2033
- Table 78: Global electric vehicle ev charging equipment Volume K Forecast, by Country 2020 & 2033
- Table 79: China electric vehicle ev charging equipment Revenue (million) Forecast, by Application 2020 & 2033
- Table 80: China electric vehicle ev charging equipment Volume (K) Forecast, by Application 2020 & 2033
- Table 81: India electric vehicle ev charging equipment Revenue (million) Forecast, by Application 2020 & 2033
- Table 82: India electric vehicle ev charging equipment Volume (K) Forecast, by Application 2020 & 2033
- Table 83: Japan electric vehicle ev charging equipment Revenue (million) Forecast, by Application 2020 & 2033
- Table 84: Japan electric vehicle ev charging equipment Volume (K) Forecast, by Application 2020 & 2033
- Table 85: South Korea electric vehicle ev charging equipment Revenue (million) Forecast, by Application 2020 & 2033
- Table 86: South Korea electric vehicle ev charging equipment Volume (K) Forecast, by Application 2020 & 2033
- Table 87: ASEAN electric vehicle ev charging equipment Revenue (million) Forecast, by Application 2020 & 2033
- Table 88: ASEAN electric vehicle ev charging equipment Volume (K) Forecast, by Application 2020 & 2033
- Table 89: Oceania electric vehicle ev charging equipment Revenue (million) Forecast, by Application 2020 & 2033
- Table 90: Oceania electric vehicle ev charging equipment Volume (K) Forecast, by Application 2020 & 2033
- Table 91: Rest of Asia Pacific electric vehicle ev charging equipment Revenue (million) Forecast, by Application 2020 & 2033
- Table 92: Rest of Asia Pacific electric vehicle ev charging equipment Volume (K) Forecast, by Application 2020 & 2033
Frequently Asked Questions
1. What is the projected Compound Annual Growth Rate (CAGR) of the electric vehicle ev charging equipment?
The projected CAGR is approximately XX%.
2. Which companies are prominent players in the electric vehicle ev charging equipment?
Key companies in the market include Global and United States.
3. What are the main segments of the electric vehicle ev charging equipment?
The market segments include Application, Types.
4. Can you provide details about the market size?
The market size is estimated to be USD XXX million as of 2022.
5. What are some drivers contributing to market growth?
N/A
6. What are the notable trends driving market growth?
N/A
7. Are there any restraints impacting market growth?
N/A
8. Can you provide examples of recent developments in the market?
N/A
9. What pricing options are available for accessing the report?
Pricing options include single-user, multi-user, and enterprise licenses priced at USD 4350.00, USD 6525.00, and USD 8700.00 respectively.
10. Is the market size provided in terms of value or volume?
The market size is provided in terms of value, measured in million and volume, measured in K.
11. Are there any specific market keywords associated with the report?
Yes, the market keyword associated with the report is "electric vehicle ev charging equipment," which aids in identifying and referencing the specific market segment covered.
12. How do I determine which pricing option suits my needs best?
The pricing options vary based on user requirements and access needs. Individual users may opt for single-user licenses, while businesses requiring broader access may choose multi-user or enterprise licenses for cost-effective access to the report.
13. Are there any additional resources or data provided in the electric vehicle ev charging equipment report?
While the report offers comprehensive insights, it's advisable to review the specific contents or supplementary materials provided to ascertain if additional resources or data are available.
14. How can I stay updated on further developments or reports in the electric vehicle ev charging equipment?
To stay informed about further developments, trends, and reports in the electric vehicle ev charging equipment, consider subscribing to industry newsletters, following relevant companies and organizations, or regularly checking reputable industry news sources and publications.
Methodology
Step 1 - Identification of Relevant Samples Size from Population Database


Step 2 - Approaches for Defining Global Market Size (Value, Volume* & Price*)

Note*: In applicable scenarios
Step 3 - Data Sources
Primary Research
- Web Analytics
- Survey Reports
- Research Institute
- Latest Research Reports
- Opinion Leaders
Secondary Research
- Annual Reports
- White Paper
- Latest Press Release
- Industry Association
- Paid Database
- Investor Presentations

Step 4 - Data Triangulation
Involves using different sources of information in order to increase the validity of a study
These sources are likely to be stakeholders in a program - participants, other researchers, program staff, other community members, and so on.
Then we put all data in single framework & apply various statistical tools to find out the dynamic on the market.
During the analysis stage, feedback from the stakeholder groups would be compared to determine areas of agreement as well as areas of divergence