

Key Insights
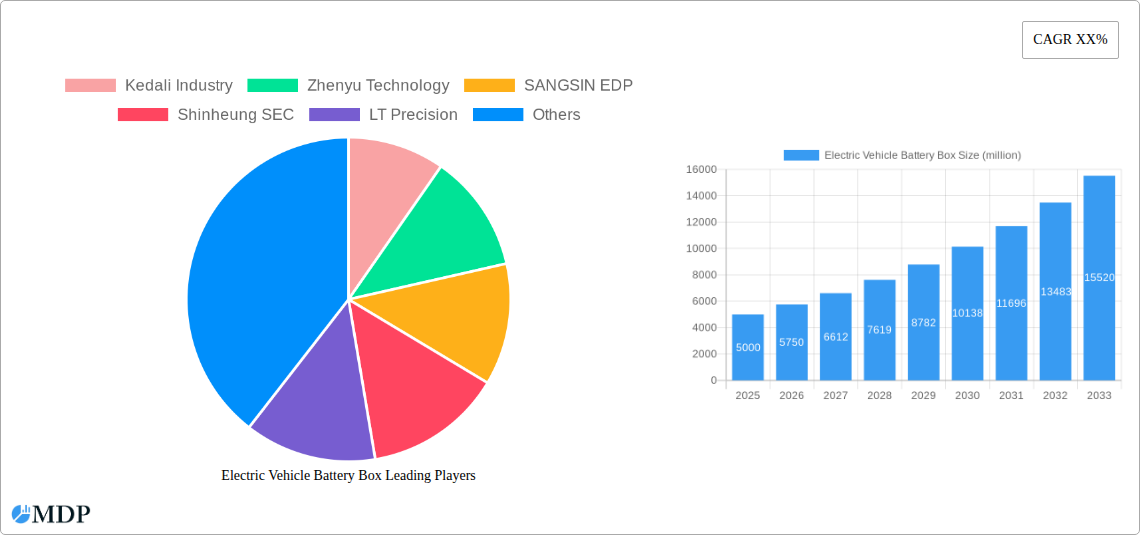
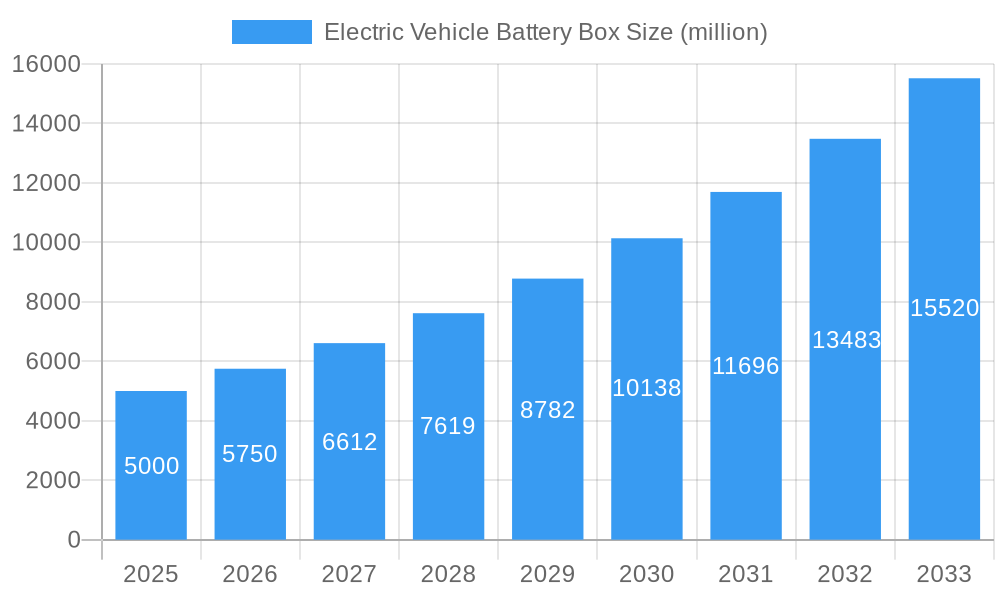
The global Electric Vehicle (EV) Battery Box market is poised for significant expansion, driven by the accelerating adoption of Battery Electric Vehicles (BEVs) and Plug-in Hybrid Electric Vehicles (PHEVs). The market, valued at $7.25 billion in the base year of 2025, is projected to achieve a Compound Annual Growth Rate (CAGR) of 13.71% between 2025 and 2033, reaching an estimated $20 billion by 2033. This robust growth is underpinned by several key drivers. Favorable government regulations promoting EV uptake, coupled with declining battery costs and technological advancements, are creating an opportune environment for market expansion. Increasing consumer demand for extended driving ranges and enhanced battery performance is spurring innovation in battery box design and materials, resulting in lighter, more durable, and safer solutions. The market segmentation, covering applications (BEV, PHEV) and types (square, cylindrical, soft case), highlights the diverse requirements of the EV industry. Square and cylindrical battery box types currently lead the market, owing to their established technology and cost-effectiveness. Leading players such as Kedali Industry, Zhenyu Technology, and SANGSIN EDP are actively responding to this demand through strategic investments in research and development and expanded production capabilities.
Electric Vehicle Battery Box Market Size (In Billion)
Geographically, market growth is expected to be varied. While North America and Europe currently dominate, the Asia-Pacific region, particularly China and India, is anticipated to experience substantial growth fueled by increased manufacturing activities and supportive governmental policies. However, certain challenges persist. The high initial cost of EVs and the insufficient charging infrastructure in some areas may present restraints to market penetration. Moreover, ensuring the safety and long-term durability of battery boxes across diverse operating conditions remains a critical focus for ongoing research and development. Despite these challenges, the overall outlook for the EV Battery Box market is highly positive, with substantial growth opportunities expected in the coming years.
Electric Vehicle Battery Box Company Market Share
Electric Vehicle Battery Box Market Report: 2019-2033
Dive deep into the booming Electric Vehicle Battery Box market with this comprehensive report, projecting a market value exceeding $XX million by 2033. This in-depth analysis covers market dynamics, industry trends, leading players, and future opportunities, providing actionable insights for stakeholders across the EV ecosystem. The report leverages data from 2019-2024 (Historical Period), with a base year of 2025 and forecast extending to 2033.
Electric Vehicle Battery Box Market Dynamics & Concentration
The global electric vehicle battery box market is experiencing explosive growth, driven by the surging demand for electric vehicles (EVs). Market concentration is currently moderate, with several key players holding significant shares. However, the market is expected to become more consolidated in the coming years due to increased M&A activity and the emergence of larger, more integrated players. Over the study period (2019-2033), we estimate xx million M&A deals in the sector. Innovation is a key driver, with companies constantly striving to improve battery box designs for better energy density, safety, and cost-effectiveness. Stringent government regulations promoting EV adoption and emission reduction targets are further boosting market growth. Product substitutes, such as alternative battery packaging solutions, pose a limited threat, with the current focus largely on improving existing designs rather than replacing them entirely. End-user trends heavily favor lighter, more efficient, and safer battery boxes, shaping product development strategies across the board.
- Market Share (2025): Kedali Industry (xx%), Zhenyu Technology (xx%), SANGSIN EDP (xx%), Others (xx%).
- M&A Activity (2019-2024): xx million deals, primarily focused on vertical integration and technology acquisition.
- Innovation Drivers: Improved thermal management, lightweight materials, enhanced safety features.
- Regulatory Landscape: Stringent safety standards and emission regulations are shaping market dynamics.
Electric Vehicle Battery Box Industry Trends & Analysis
The electric vehicle battery box market is witnessing a Compound Annual Growth Rate (CAGR) of xx% during the forecast period (2025-2033), fueled by several key factors. The global shift towards electric mobility is the primary driver, with governments worldwide implementing policies incentivizing EV adoption. Technological advancements in battery technology, specifically higher energy density and faster charging capabilities, are also significantly impacting market growth. Consumer preference for longer driving ranges and improved safety features continues to push demand. Competitive dynamics are intensifying, with established players focusing on innovation and expansion while new entrants strive to gain market share. Market penetration of electric vehicles is rapidly increasing, driving higher demand for battery boxes. Significant investments in research and development are leading to breakthroughs in material science and manufacturing processes, further enhancing market growth. The market is also becoming increasingly segmented, with specialized designs emerging for various EV types and battery chemistries.
Leading Markets & Segments in Electric Vehicle Battery Box
The Asia-Pacific region is expected to dominate the electric vehicle battery box market throughout the forecast period. China, in particular, is a significant contributor due to its massive EV market and robust domestic manufacturing base.
Key Drivers for Market Dominance:
- China: Government subsidies, strong domestic EV demand, substantial manufacturing capacity, extensive supply chain infrastructure.
- Europe: Stricter emission regulations, growing EV adoption rates, supportive government policies.
- North America: Increasing EV sales, growing consumer awareness of environmental concerns.
Dominant Segments:
- Application: BEV (Battery Electric Vehicles) segment is expected to hold a larger market share than PHEV (Plug-in Hybrid Electric Vehicles) due to its higher growth rate. This trend is expected to continue throughout the forecast period.
- Type: The square type battery box is currently dominating the market owing to its compatibility with various battery pack configurations and better space utilization. However, cylindrical and soft-case types are gaining traction due to their suitability for specific vehicle designs and emerging battery chemistries.
Electric Vehicle Battery Box Product Developments
Recent product innovations focus on improved thermal management systems, lightweight materials like aluminum alloys and carbon fiber composites, and enhanced safety features such as integrated fire suppression systems. These advancements are aimed at improving battery performance, extending lifespan, and enhancing overall vehicle safety. The market is witnessing increased integration of smart features, including battery monitoring systems and predictive maintenance capabilities. These features provide benefits to both vehicle manufacturers and end-users.
Key Drivers of Electric Vehicle Battery Box Growth
Technological advancements in battery technology and manufacturing processes, coupled with supportive government policies and incentives, are the primary growth drivers. Increasing consumer demand for electric vehicles and the need for more efficient and cost-effective battery packaging solutions are also significant factors. The expansion of charging infrastructure and the decreasing cost of EVs are accelerating market growth.
Challenges in the Electric Vehicle Battery Box Market
The market faces several challenges, including supply chain disruptions, potential material shortages, and intense price competition. Stringent safety regulations and the need for continuous innovation to meet evolving technological demands also pose significant hurdles. Furthermore, maintaining consistent quality and ensuring efficient production to meet the exponentially growing demand is a significant challenge. The impact of these challenges is estimated to result in a xx million loss annually within the industry.
Emerging Opportunities in Electric Vehicle Battery Box
The growing adoption of solid-state batteries, the development of more sustainable and recyclable materials, and the increasing focus on battery management systems (BMS) integration present substantial opportunities. Strategic partnerships between battery manufacturers and vehicle OEMs are expected to drive innovation and market expansion. The emergence of new battery chemistries and designs, as well as the penetration of EVs in new markets, create further growth opportunities.
Leading Players in the Electric Vehicle Battery Box Sector
- Kedali Industry
- Zhenyu Technology
- SANGSIN EDP
- Shinheung SEC
- LT Precision
- Dongwon Systems
- Jie Jing Precision
- Red Fairy Precision
- JINYANG
- Alcha Aluminium
- SLAC Precision Equipment
- Hefei Lixiang
- FUJI SPRINGS
- Zhengyuan Electronic
- ZZ electric
- SuZhou Sumzone
- YALUXING
- Jihou Intelligent
Key Milestones in Electric Vehicle Battery Box Industry
- 2020: Introduction of a new lightweight aluminum alloy battery box by Kedali Industry.
- 2021: Strategic partnership between Zhenyu Technology and a major battery manufacturer to develop advanced thermal management systems.
- 2022: Launch of a new cylindrical battery box design by SANGSIN EDP.
- 2023: Significant investment in R&D by several key players to improve battery box safety features.
- 2024: Acquisition of a smaller battery box manufacturer by a major automotive supplier.
Strategic Outlook for Electric Vehicle Battery Box Market
The long-term outlook for the electric vehicle battery box market remains highly positive, driven by continued growth in the EV industry and technological advancements in battery and packaging technologies. Strategic investments in R&D, strategic partnerships, and expansion into new markets will be key factors in shaping market leadership in the coming years. The focus on sustainability and recyclability will also drive innovation and shape future market trends. Companies that can effectively navigate the evolving regulatory landscape, manage supply chain risks, and meet the growing demand for high-performance, cost-effective battery boxes will be best positioned for success.
Electric Vehicle Battery Box Segmentation
-
1. Application
- 1.1. BEV
- 1.2. PHEV
-
2. Types
- 2.1. Square Type
- 2.2. Cylindrical Type
- 2.3. Soft Case Type
Electric Vehicle Battery Box Segmentation By Geography
-
1. North America
- 1.1. United States
- 1.2. Canada
- 1.3. Mexico
-
2. South America
- 2.1. Brazil
- 2.2. Argentina
- 2.3. Rest of South America
-
3. Europe
- 3.1. United Kingdom
- 3.2. Germany
- 3.3. France
- 3.4. Italy
- 3.5. Spain
- 3.6. Russia
- 3.7. Benelux
- 3.8. Nordics
- 3.9. Rest of Europe
-
4. Middle East & Africa
- 4.1. Turkey
- 4.2. Israel
- 4.3. GCC
- 4.4. North Africa
- 4.5. South Africa
- 4.6. Rest of Middle East & Africa
-
5. Asia Pacific
- 5.1. China
- 5.2. India
- 5.3. Japan
- 5.4. South Korea
- 5.5. ASEAN
- 5.6. Oceania
- 5.7. Rest of Asia Pacific

Electric Vehicle Battery Box Regional Market Share
Geographic Coverage of Electric Vehicle Battery Box
Electric Vehicle Battery Box REPORT HIGHLIGHTS
| Aspects | Details |
|---|---|
| Study Period | 2020-2034 |
| Base Year | 2025 |
| Estimated Year | 2026 |
| Forecast Period | 2026-2034 |
| Historical Period | 2020-2025 |
| Growth Rate | CAGR of 13.71% from 2020-2034 |
| Segmentation |
|
Table of Contents
- 1. Introduction
- 1.1. Research Scope
- 1.2. Market Segmentation
- 1.3. Research Methodology
- 1.4. Definitions and Assumptions
- 2. Executive Summary
- 2.1. Introduction
- 3. Market Dynamics
- 3.1. Introduction
- 3.2. Market Drivers
- 3.3. Market Restrains
- 3.4. Market Trends
- 4. Market Factor Analysis
- 4.1. Porters Five Forces
- 4.2. Supply/Value Chain
- 4.3. PESTEL analysis
- 4.4. Market Entropy
- 4.5. Patent/Trademark Analysis
- 5. Global Electric Vehicle Battery Box Analysis, Insights and Forecast, 2020-2032
- 5.1. Market Analysis, Insights and Forecast - by Application
- 5.1.1. BEV
- 5.1.2. PHEV
- 5.2. Market Analysis, Insights and Forecast - by Types
- 5.2.1. Square Type
- 5.2.2. Cylindrical Type
- 5.2.3. Soft Case Type
- 5.3. Market Analysis, Insights and Forecast - by Region
- 5.3.1. North America
- 5.3.2. South America
- 5.3.3. Europe
- 5.3.4. Middle East & Africa
- 5.3.5. Asia Pacific
- 5.1. Market Analysis, Insights and Forecast - by Application
- 6. North America Electric Vehicle Battery Box Analysis, Insights and Forecast, 2020-2032
- 6.1. Market Analysis, Insights and Forecast - by Application
- 6.1.1. BEV
- 6.1.2. PHEV
- 6.2. Market Analysis, Insights and Forecast - by Types
- 6.2.1. Square Type
- 6.2.2. Cylindrical Type
- 6.2.3. Soft Case Type
- 6.1. Market Analysis, Insights and Forecast - by Application
- 7. South America Electric Vehicle Battery Box Analysis, Insights and Forecast, 2020-2032
- 7.1. Market Analysis, Insights and Forecast - by Application
- 7.1.1. BEV
- 7.1.2. PHEV
- 7.2. Market Analysis, Insights and Forecast - by Types
- 7.2.1. Square Type
- 7.2.2. Cylindrical Type
- 7.2.3. Soft Case Type
- 7.1. Market Analysis, Insights and Forecast - by Application
- 8. Europe Electric Vehicle Battery Box Analysis, Insights and Forecast, 2020-2032
- 8.1. Market Analysis, Insights and Forecast - by Application
- 8.1.1. BEV
- 8.1.2. PHEV
- 8.2. Market Analysis, Insights and Forecast - by Types
- 8.2.1. Square Type
- 8.2.2. Cylindrical Type
- 8.2.3. Soft Case Type
- 8.1. Market Analysis, Insights and Forecast - by Application
- 9. Middle East & Africa Electric Vehicle Battery Box Analysis, Insights and Forecast, 2020-2032
- 9.1. Market Analysis, Insights and Forecast - by Application
- 9.1.1. BEV
- 9.1.2. PHEV
- 9.2. Market Analysis, Insights and Forecast - by Types
- 9.2.1. Square Type
- 9.2.2. Cylindrical Type
- 9.2.3. Soft Case Type
- 9.1. Market Analysis, Insights and Forecast - by Application
- 10. Asia Pacific Electric Vehicle Battery Box Analysis, Insights and Forecast, 2020-2032
- 10.1. Market Analysis, Insights and Forecast - by Application
- 10.1.1. BEV
- 10.1.2. PHEV
- 10.2. Market Analysis, Insights and Forecast - by Types
- 10.2.1. Square Type
- 10.2.2. Cylindrical Type
- 10.2.3. Soft Case Type
- 10.1. Market Analysis, Insights and Forecast - by Application
- 11. Competitive Analysis
- 11.1. Global Market Share Analysis 2025
- 11.2. Company Profiles
- 11.2.1 Kedali Industry
- 11.2.1.1. Overview
- 11.2.1.2. Products
- 11.2.1.3. SWOT Analysis
- 11.2.1.4. Recent Developments
- 11.2.1.5. Financials (Based on Availability)
- 11.2.2 Zhenyu Technology
- 11.2.2.1. Overview
- 11.2.2.2. Products
- 11.2.2.3. SWOT Analysis
- 11.2.2.4. Recent Developments
- 11.2.2.5. Financials (Based on Availability)
- 11.2.3 SANGSIN EDP
- 11.2.3.1. Overview
- 11.2.3.2. Products
- 11.2.3.3. SWOT Analysis
- 11.2.3.4. Recent Developments
- 11.2.3.5. Financials (Based on Availability)
- 11.2.4 Shinheung SEC
- 11.2.4.1. Overview
- 11.2.4.2. Products
- 11.2.4.3. SWOT Analysis
- 11.2.4.4. Recent Developments
- 11.2.4.5. Financials (Based on Availability)
- 11.2.5 LT Precision
- 11.2.5.1. Overview
- 11.2.5.2. Products
- 11.2.5.3. SWOT Analysis
- 11.2.5.4. Recent Developments
- 11.2.5.5. Financials (Based on Availability)
- 11.2.6 Dongwon Systems
- 11.2.6.1. Overview
- 11.2.6.2. Products
- 11.2.6.3. SWOT Analysis
- 11.2.6.4. Recent Developments
- 11.2.6.5. Financials (Based on Availability)
- 11.2.7 Jie Jing Precision
- 11.2.7.1. Overview
- 11.2.7.2. Products
- 11.2.7.3. SWOT Analysis
- 11.2.7.4. Recent Developments
- 11.2.7.5. Financials (Based on Availability)
- 11.2.8 Red Fairy Precision
- 11.2.8.1. Overview
- 11.2.8.2. Products
- 11.2.8.3. SWOT Analysis
- 11.2.8.4. Recent Developments
- 11.2.8.5. Financials (Based on Availability)
- 11.2.9 JINYANG
- 11.2.9.1. Overview
- 11.2.9.2. Products
- 11.2.9.3. SWOT Analysis
- 11.2.9.4. Recent Developments
- 11.2.9.5. Financials (Based on Availability)
- 11.2.10 Alcha Aluminium
- 11.2.10.1. Overview
- 11.2.10.2. Products
- 11.2.10.3. SWOT Analysis
- 11.2.10.4. Recent Developments
- 11.2.10.5. Financials (Based on Availability)
- 11.2.11 SLAC Precision Equipment
- 11.2.11.1. Overview
- 11.2.11.2. Products
- 11.2.11.3. SWOT Analysis
- 11.2.11.4. Recent Developments
- 11.2.11.5. Financials (Based on Availability)
- 11.2.12 Hefei Lixiang
- 11.2.12.1. Overview
- 11.2.12.2. Products
- 11.2.12.3. SWOT Analysis
- 11.2.12.4. Recent Developments
- 11.2.12.5. Financials (Based on Availability)
- 11.2.13 FUJI SPRINGS
- 11.2.13.1. Overview
- 11.2.13.2. Products
- 11.2.13.3. SWOT Analysis
- 11.2.13.4. Recent Developments
- 11.2.13.5. Financials (Based on Availability)
- 11.2.14 Zhengyuan Electronic
- 11.2.14.1. Overview
- 11.2.14.2. Products
- 11.2.14.3. SWOT Analysis
- 11.2.14.4. Recent Developments
- 11.2.14.5. Financials (Based on Availability)
- 11.2.15 ZZ electric
- 11.2.15.1. Overview
- 11.2.15.2. Products
- 11.2.15.3. SWOT Analysis
- 11.2.15.4. Recent Developments
- 11.2.15.5. Financials (Based on Availability)
- 11.2.16 SuZhou Sumzone
- 11.2.16.1. Overview
- 11.2.16.2. Products
- 11.2.16.3. SWOT Analysis
- 11.2.16.4. Recent Developments
- 11.2.16.5. Financials (Based on Availability)
- 11.2.17 YALUXING
- 11.2.17.1. Overview
- 11.2.17.2. Products
- 11.2.17.3. SWOT Analysis
- 11.2.17.4. Recent Developments
- 11.2.17.5. Financials (Based on Availability)
- 11.2.18 Jihou Intelligent
- 11.2.18.1. Overview
- 11.2.18.2. Products
- 11.2.18.3. SWOT Analysis
- 11.2.18.4. Recent Developments
- 11.2.18.5. Financials (Based on Availability)
- 11.2.1 Kedali Industry
List of Figures
- Figure 1: Global Electric Vehicle Battery Box Revenue Breakdown (billion, %) by Region 2025 & 2033
- Figure 2: Global Electric Vehicle Battery Box Volume Breakdown (K, %) by Region 2025 & 2033
- Figure 3: North America Electric Vehicle Battery Box Revenue (billion), by Application 2025 & 2033
- Figure 4: North America Electric Vehicle Battery Box Volume (K), by Application 2025 & 2033
- Figure 5: North America Electric Vehicle Battery Box Revenue Share (%), by Application 2025 & 2033
- Figure 6: North America Electric Vehicle Battery Box Volume Share (%), by Application 2025 & 2033
- Figure 7: North America Electric Vehicle Battery Box Revenue (billion), by Types 2025 & 2033
- Figure 8: North America Electric Vehicle Battery Box Volume (K), by Types 2025 & 2033
- Figure 9: North America Electric Vehicle Battery Box Revenue Share (%), by Types 2025 & 2033
- Figure 10: North America Electric Vehicle Battery Box Volume Share (%), by Types 2025 & 2033
- Figure 11: North America Electric Vehicle Battery Box Revenue (billion), by Country 2025 & 2033
- Figure 12: North America Electric Vehicle Battery Box Volume (K), by Country 2025 & 2033
- Figure 13: North America Electric Vehicle Battery Box Revenue Share (%), by Country 2025 & 2033
- Figure 14: North America Electric Vehicle Battery Box Volume Share (%), by Country 2025 & 2033
- Figure 15: South America Electric Vehicle Battery Box Revenue (billion), by Application 2025 & 2033
- Figure 16: South America Electric Vehicle Battery Box Volume (K), by Application 2025 & 2033
- Figure 17: South America Electric Vehicle Battery Box Revenue Share (%), by Application 2025 & 2033
- Figure 18: South America Electric Vehicle Battery Box Volume Share (%), by Application 2025 & 2033
- Figure 19: South America Electric Vehicle Battery Box Revenue (billion), by Types 2025 & 2033
- Figure 20: South America Electric Vehicle Battery Box Volume (K), by Types 2025 & 2033
- Figure 21: South America Electric Vehicle Battery Box Revenue Share (%), by Types 2025 & 2033
- Figure 22: South America Electric Vehicle Battery Box Volume Share (%), by Types 2025 & 2033
- Figure 23: South America Electric Vehicle Battery Box Revenue (billion), by Country 2025 & 2033
- Figure 24: South America Electric Vehicle Battery Box Volume (K), by Country 2025 & 2033
- Figure 25: South America Electric Vehicle Battery Box Revenue Share (%), by Country 2025 & 2033
- Figure 26: South America Electric Vehicle Battery Box Volume Share (%), by Country 2025 & 2033
- Figure 27: Europe Electric Vehicle Battery Box Revenue (billion), by Application 2025 & 2033
- Figure 28: Europe Electric Vehicle Battery Box Volume (K), by Application 2025 & 2033
- Figure 29: Europe Electric Vehicle Battery Box Revenue Share (%), by Application 2025 & 2033
- Figure 30: Europe Electric Vehicle Battery Box Volume Share (%), by Application 2025 & 2033
- Figure 31: Europe Electric Vehicle Battery Box Revenue (billion), by Types 2025 & 2033
- Figure 32: Europe Electric Vehicle Battery Box Volume (K), by Types 2025 & 2033
- Figure 33: Europe Electric Vehicle Battery Box Revenue Share (%), by Types 2025 & 2033
- Figure 34: Europe Electric Vehicle Battery Box Volume Share (%), by Types 2025 & 2033
- Figure 35: Europe Electric Vehicle Battery Box Revenue (billion), by Country 2025 & 2033
- Figure 36: Europe Electric Vehicle Battery Box Volume (K), by Country 2025 & 2033
- Figure 37: Europe Electric Vehicle Battery Box Revenue Share (%), by Country 2025 & 2033
- Figure 38: Europe Electric Vehicle Battery Box Volume Share (%), by Country 2025 & 2033
- Figure 39: Middle East & Africa Electric Vehicle Battery Box Revenue (billion), by Application 2025 & 2033
- Figure 40: Middle East & Africa Electric Vehicle Battery Box Volume (K), by Application 2025 & 2033
- Figure 41: Middle East & Africa Electric Vehicle Battery Box Revenue Share (%), by Application 2025 & 2033
- Figure 42: Middle East & Africa Electric Vehicle Battery Box Volume Share (%), by Application 2025 & 2033
- Figure 43: Middle East & Africa Electric Vehicle Battery Box Revenue (billion), by Types 2025 & 2033
- Figure 44: Middle East & Africa Electric Vehicle Battery Box Volume (K), by Types 2025 & 2033
- Figure 45: Middle East & Africa Electric Vehicle Battery Box Revenue Share (%), by Types 2025 & 2033
- Figure 46: Middle East & Africa Electric Vehicle Battery Box Volume Share (%), by Types 2025 & 2033
- Figure 47: Middle East & Africa Electric Vehicle Battery Box Revenue (billion), by Country 2025 & 2033
- Figure 48: Middle East & Africa Electric Vehicle Battery Box Volume (K), by Country 2025 & 2033
- Figure 49: Middle East & Africa Electric Vehicle Battery Box Revenue Share (%), by Country 2025 & 2033
- Figure 50: Middle East & Africa Electric Vehicle Battery Box Volume Share (%), by Country 2025 & 2033
- Figure 51: Asia Pacific Electric Vehicle Battery Box Revenue (billion), by Application 2025 & 2033
- Figure 52: Asia Pacific Electric Vehicle Battery Box Volume (K), by Application 2025 & 2033
- Figure 53: Asia Pacific Electric Vehicle Battery Box Revenue Share (%), by Application 2025 & 2033
- Figure 54: Asia Pacific Electric Vehicle Battery Box Volume Share (%), by Application 2025 & 2033
- Figure 55: Asia Pacific Electric Vehicle Battery Box Revenue (billion), by Types 2025 & 2033
- Figure 56: Asia Pacific Electric Vehicle Battery Box Volume (K), by Types 2025 & 2033
- Figure 57: Asia Pacific Electric Vehicle Battery Box Revenue Share (%), by Types 2025 & 2033
- Figure 58: Asia Pacific Electric Vehicle Battery Box Volume Share (%), by Types 2025 & 2033
- Figure 59: Asia Pacific Electric Vehicle Battery Box Revenue (billion), by Country 2025 & 2033
- Figure 60: Asia Pacific Electric Vehicle Battery Box Volume (K), by Country 2025 & 2033
- Figure 61: Asia Pacific Electric Vehicle Battery Box Revenue Share (%), by Country 2025 & 2033
- Figure 62: Asia Pacific Electric Vehicle Battery Box Volume Share (%), by Country 2025 & 2033
List of Tables
- Table 1: Global Electric Vehicle Battery Box Revenue billion Forecast, by Application 2020 & 2033
- Table 2: Global Electric Vehicle Battery Box Volume K Forecast, by Application 2020 & 2033
- Table 3: Global Electric Vehicle Battery Box Revenue billion Forecast, by Types 2020 & 2033
- Table 4: Global Electric Vehicle Battery Box Volume K Forecast, by Types 2020 & 2033
- Table 5: Global Electric Vehicle Battery Box Revenue billion Forecast, by Region 2020 & 2033
- Table 6: Global Electric Vehicle Battery Box Volume K Forecast, by Region 2020 & 2033
- Table 7: Global Electric Vehicle Battery Box Revenue billion Forecast, by Application 2020 & 2033
- Table 8: Global Electric Vehicle Battery Box Volume K Forecast, by Application 2020 & 2033
- Table 9: Global Electric Vehicle Battery Box Revenue billion Forecast, by Types 2020 & 2033
- Table 10: Global Electric Vehicle Battery Box Volume K Forecast, by Types 2020 & 2033
- Table 11: Global Electric Vehicle Battery Box Revenue billion Forecast, by Country 2020 & 2033
- Table 12: Global Electric Vehicle Battery Box Volume K Forecast, by Country 2020 & 2033
- Table 13: United States Electric Vehicle Battery Box Revenue (billion) Forecast, by Application 2020 & 2033
- Table 14: United States Electric Vehicle Battery Box Volume (K) Forecast, by Application 2020 & 2033
- Table 15: Canada Electric Vehicle Battery Box Revenue (billion) Forecast, by Application 2020 & 2033
- Table 16: Canada Electric Vehicle Battery Box Volume (K) Forecast, by Application 2020 & 2033
- Table 17: Mexico Electric Vehicle Battery Box Revenue (billion) Forecast, by Application 2020 & 2033
- Table 18: Mexico Electric Vehicle Battery Box Volume (K) Forecast, by Application 2020 & 2033
- Table 19: Global Electric Vehicle Battery Box Revenue billion Forecast, by Application 2020 & 2033
- Table 20: Global Electric Vehicle Battery Box Volume K Forecast, by Application 2020 & 2033
- Table 21: Global Electric Vehicle Battery Box Revenue billion Forecast, by Types 2020 & 2033
- Table 22: Global Electric Vehicle Battery Box Volume K Forecast, by Types 2020 & 2033
- Table 23: Global Electric Vehicle Battery Box Revenue billion Forecast, by Country 2020 & 2033
- Table 24: Global Electric Vehicle Battery Box Volume K Forecast, by Country 2020 & 2033
- Table 25: Brazil Electric Vehicle Battery Box Revenue (billion) Forecast, by Application 2020 & 2033
- Table 26: Brazil Electric Vehicle Battery Box Volume (K) Forecast, by Application 2020 & 2033
- Table 27: Argentina Electric Vehicle Battery Box Revenue (billion) Forecast, by Application 2020 & 2033
- Table 28: Argentina Electric Vehicle Battery Box Volume (K) Forecast, by Application 2020 & 2033
- Table 29: Rest of South America Electric Vehicle Battery Box Revenue (billion) Forecast, by Application 2020 & 2033
- Table 30: Rest of South America Electric Vehicle Battery Box Volume (K) Forecast, by Application 2020 & 2033
- Table 31: Global Electric Vehicle Battery Box Revenue billion Forecast, by Application 2020 & 2033
- Table 32: Global Electric Vehicle Battery Box Volume K Forecast, by Application 2020 & 2033
- Table 33: Global Electric Vehicle Battery Box Revenue billion Forecast, by Types 2020 & 2033
- Table 34: Global Electric Vehicle Battery Box Volume K Forecast, by Types 2020 & 2033
- Table 35: Global Electric Vehicle Battery Box Revenue billion Forecast, by Country 2020 & 2033
- Table 36: Global Electric Vehicle Battery Box Volume K Forecast, by Country 2020 & 2033
- Table 37: United Kingdom Electric Vehicle Battery Box Revenue (billion) Forecast, by Application 2020 & 2033
- Table 38: United Kingdom Electric Vehicle Battery Box Volume (K) Forecast, by Application 2020 & 2033
- Table 39: Germany Electric Vehicle Battery Box Revenue (billion) Forecast, by Application 2020 & 2033
- Table 40: Germany Electric Vehicle Battery Box Volume (K) Forecast, by Application 2020 & 2033
- Table 41: France Electric Vehicle Battery Box Revenue (billion) Forecast, by Application 2020 & 2033
- Table 42: France Electric Vehicle Battery Box Volume (K) Forecast, by Application 2020 & 2033
- Table 43: Italy Electric Vehicle Battery Box Revenue (billion) Forecast, by Application 2020 & 2033
- Table 44: Italy Electric Vehicle Battery Box Volume (K) Forecast, by Application 2020 & 2033
- Table 45: Spain Electric Vehicle Battery Box Revenue (billion) Forecast, by Application 2020 & 2033
- Table 46: Spain Electric Vehicle Battery Box Volume (K) Forecast, by Application 2020 & 2033
- Table 47: Russia Electric Vehicle Battery Box Revenue (billion) Forecast, by Application 2020 & 2033
- Table 48: Russia Electric Vehicle Battery Box Volume (K) Forecast, by Application 2020 & 2033
- Table 49: Benelux Electric Vehicle Battery Box Revenue (billion) Forecast, by Application 2020 & 2033
- Table 50: Benelux Electric Vehicle Battery Box Volume (K) Forecast, by Application 2020 & 2033
- Table 51: Nordics Electric Vehicle Battery Box Revenue (billion) Forecast, by Application 2020 & 2033
- Table 52: Nordics Electric Vehicle Battery Box Volume (K) Forecast, by Application 2020 & 2033
- Table 53: Rest of Europe Electric Vehicle Battery Box Revenue (billion) Forecast, by Application 2020 & 2033
- Table 54: Rest of Europe Electric Vehicle Battery Box Volume (K) Forecast, by Application 2020 & 2033
- Table 55: Global Electric Vehicle Battery Box Revenue billion Forecast, by Application 2020 & 2033
- Table 56: Global Electric Vehicle Battery Box Volume K Forecast, by Application 2020 & 2033
- Table 57: Global Electric Vehicle Battery Box Revenue billion Forecast, by Types 2020 & 2033
- Table 58: Global Electric Vehicle Battery Box Volume K Forecast, by Types 2020 & 2033
- Table 59: Global Electric Vehicle Battery Box Revenue billion Forecast, by Country 2020 & 2033
- Table 60: Global Electric Vehicle Battery Box Volume K Forecast, by Country 2020 & 2033
- Table 61: Turkey Electric Vehicle Battery Box Revenue (billion) Forecast, by Application 2020 & 2033
- Table 62: Turkey Electric Vehicle Battery Box Volume (K) Forecast, by Application 2020 & 2033
- Table 63: Israel Electric Vehicle Battery Box Revenue (billion) Forecast, by Application 2020 & 2033
- Table 64: Israel Electric Vehicle Battery Box Volume (K) Forecast, by Application 2020 & 2033
- Table 65: GCC Electric Vehicle Battery Box Revenue (billion) Forecast, by Application 2020 & 2033
- Table 66: GCC Electric Vehicle Battery Box Volume (K) Forecast, by Application 2020 & 2033
- Table 67: North Africa Electric Vehicle Battery Box Revenue (billion) Forecast, by Application 2020 & 2033
- Table 68: North Africa Electric Vehicle Battery Box Volume (K) Forecast, by Application 2020 & 2033
- Table 69: South Africa Electric Vehicle Battery Box Revenue (billion) Forecast, by Application 2020 & 2033
- Table 70: South Africa Electric Vehicle Battery Box Volume (K) Forecast, by Application 2020 & 2033
- Table 71: Rest of Middle East & Africa Electric Vehicle Battery Box Revenue (billion) Forecast, by Application 2020 & 2033
- Table 72: Rest of Middle East & Africa Electric Vehicle Battery Box Volume (K) Forecast, by Application 2020 & 2033
- Table 73: Global Electric Vehicle Battery Box Revenue billion Forecast, by Application 2020 & 2033
- Table 74: Global Electric Vehicle Battery Box Volume K Forecast, by Application 2020 & 2033
- Table 75: Global Electric Vehicle Battery Box Revenue billion Forecast, by Types 2020 & 2033
- Table 76: Global Electric Vehicle Battery Box Volume K Forecast, by Types 2020 & 2033
- Table 77: Global Electric Vehicle Battery Box Revenue billion Forecast, by Country 2020 & 2033
- Table 78: Global Electric Vehicle Battery Box Volume K Forecast, by Country 2020 & 2033
- Table 79: China Electric Vehicle Battery Box Revenue (billion) Forecast, by Application 2020 & 2033
- Table 80: China Electric Vehicle Battery Box Volume (K) Forecast, by Application 2020 & 2033
- Table 81: India Electric Vehicle Battery Box Revenue (billion) Forecast, by Application 2020 & 2033
- Table 82: India Electric Vehicle Battery Box Volume (K) Forecast, by Application 2020 & 2033
- Table 83: Japan Electric Vehicle Battery Box Revenue (billion) Forecast, by Application 2020 & 2033
- Table 84: Japan Electric Vehicle Battery Box Volume (K) Forecast, by Application 2020 & 2033
- Table 85: South Korea Electric Vehicle Battery Box Revenue (billion) Forecast, by Application 2020 & 2033
- Table 86: South Korea Electric Vehicle Battery Box Volume (K) Forecast, by Application 2020 & 2033
- Table 87: ASEAN Electric Vehicle Battery Box Revenue (billion) Forecast, by Application 2020 & 2033
- Table 88: ASEAN Electric Vehicle Battery Box Volume (K) Forecast, by Application 2020 & 2033
- Table 89: Oceania Electric Vehicle Battery Box Revenue (billion) Forecast, by Application 2020 & 2033
- Table 90: Oceania Electric Vehicle Battery Box Volume (K) Forecast, by Application 2020 & 2033
- Table 91: Rest of Asia Pacific Electric Vehicle Battery Box Revenue (billion) Forecast, by Application 2020 & 2033
- Table 92: Rest of Asia Pacific Electric Vehicle Battery Box Volume (K) Forecast, by Application 2020 & 2033
Frequently Asked Questions
1. What is the projected Compound Annual Growth Rate (CAGR) of the Electric Vehicle Battery Box?
The projected CAGR is approximately 13.71%.
2. Which companies are prominent players in the Electric Vehicle Battery Box?
Key companies in the market include Kedali Industry, Zhenyu Technology, SANGSIN EDP, Shinheung SEC, LT Precision, Dongwon Systems, Jie Jing Precision, Red Fairy Precision, JINYANG, Alcha Aluminium, SLAC Precision Equipment, Hefei Lixiang, FUJI SPRINGS, Zhengyuan Electronic, ZZ electric, SuZhou Sumzone, YALUXING, Jihou Intelligent.
3. What are the main segments of the Electric Vehicle Battery Box?
The market segments include Application, Types.
4. Can you provide details about the market size?
The market size is estimated to be USD 7.25 billion as of 2022.
5. What are some drivers contributing to market growth?
N/A
6. What are the notable trends driving market growth?
N/A
7. Are there any restraints impacting market growth?
N/A
8. Can you provide examples of recent developments in the market?
N/A
9. What pricing options are available for accessing the report?
Pricing options include single-user, multi-user, and enterprise licenses priced at USD 3350.00, USD 5025.00, and USD 6700.00 respectively.
10. Is the market size provided in terms of value or volume?
The market size is provided in terms of value, measured in billion and volume, measured in K.
11. Are there any specific market keywords associated with the report?
Yes, the market keyword associated with the report is "Electric Vehicle Battery Box," which aids in identifying and referencing the specific market segment covered.
12. How do I determine which pricing option suits my needs best?
The pricing options vary based on user requirements and access needs. Individual users may opt for single-user licenses, while businesses requiring broader access may choose multi-user or enterprise licenses for cost-effective access to the report.
13. Are there any additional resources or data provided in the Electric Vehicle Battery Box report?
While the report offers comprehensive insights, it's advisable to review the specific contents or supplementary materials provided to ascertain if additional resources or data are available.
14. How can I stay updated on further developments or reports in the Electric Vehicle Battery Box?
To stay informed about further developments, trends, and reports in the Electric Vehicle Battery Box, consider subscribing to industry newsletters, following relevant companies and organizations, or regularly checking reputable industry news sources and publications.
Methodology
Step 1 - Identification of Relevant Samples Size from Population Database


Step 2 - Approaches for Defining Global Market Size (Value, Volume* & Price*)

Note*: In applicable scenarios
Step 3 - Data Sources
Primary Research
- Web Analytics
- Survey Reports
- Research Institute
- Latest Research Reports
- Opinion Leaders
Secondary Research
- Annual Reports
- White Paper
- Latest Press Release
- Industry Association
- Paid Database
- Investor Presentations

Step 4 - Data Triangulation
Involves using different sources of information in order to increase the validity of a study
These sources are likely to be stakeholders in a program - participants, other researchers, program staff, other community members, and so on.
Then we put all data in single framework & apply various statistical tools to find out the dynamic on the market.
During the analysis stage, feedback from the stakeholder groups would be compared to determine areas of agreement as well as areas of divergence