

Key Insights
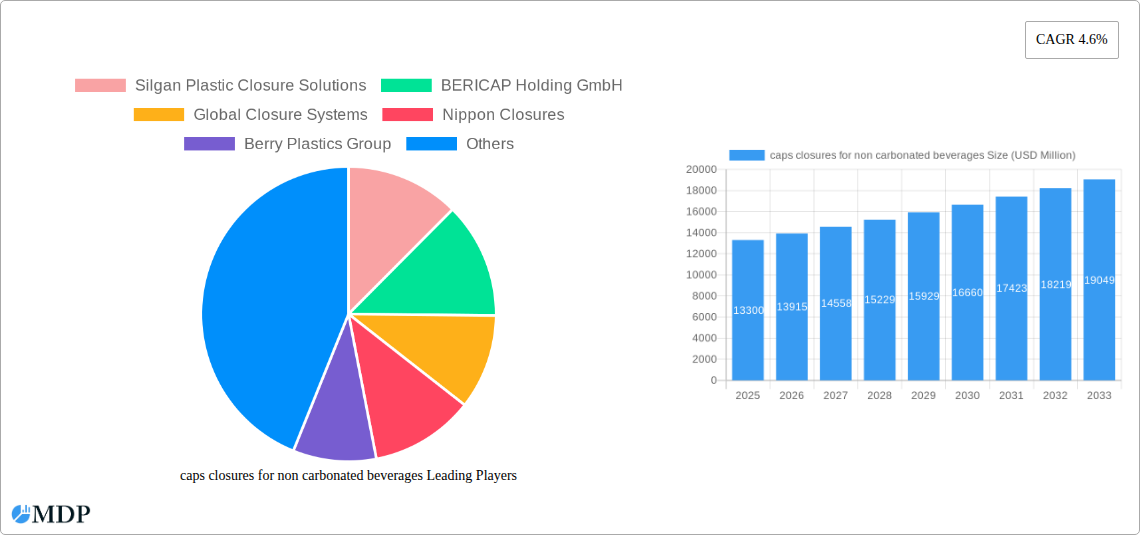
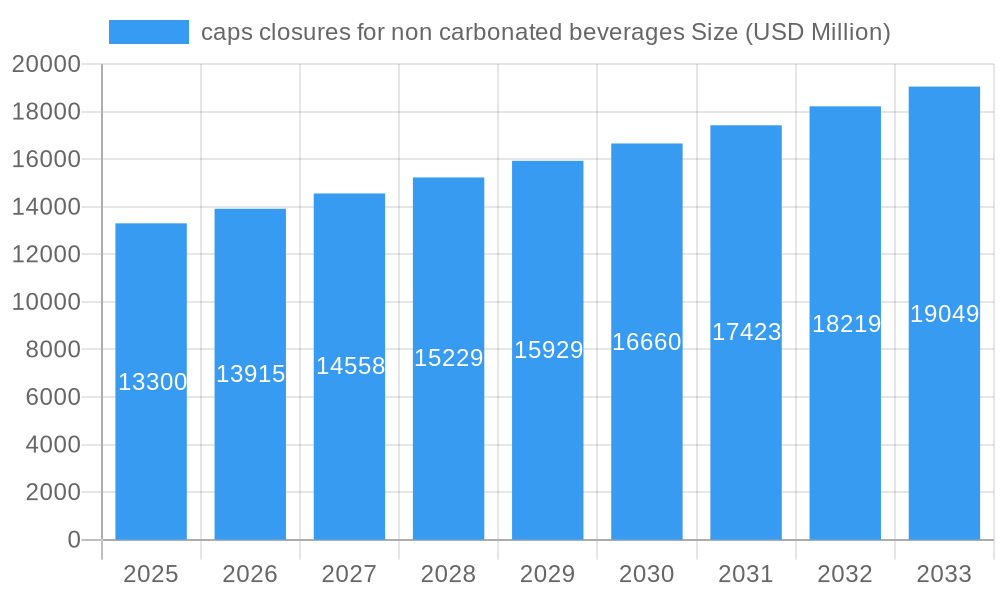
The global market for caps and closures for non-carbonated beverages is poised for robust growth, projected to reach $13.3 billion in 2025 with a healthy CAGR of 4.6% through 2033. This expansion is fueled by several key drivers, including the increasing global demand for healthy and functional non-carbonated drinks, such as flavored waters, teas, and functional beverages, coupled with a growing preference for convenient, single-serve packaging formats. Consumers are increasingly seeking beverages that align with wellness trends, leading to higher consumption of these liquid refreshments and, consequently, a greater need for reliable and innovative capping solutions. Furthermore, advancements in material science and manufacturing technologies are enabling the development of lighter, more sustainable, and tamper-evident closures, appealing to both manufacturers and environmentally conscious consumers. The market also benefits from the continuous innovation in beverage formulations and packaging designs, requiring specialized closure solutions to maintain product integrity and enhance consumer experience.
caps closures for non carbonated beverages Market Size (In Billion)
While the market presents significant opportunities, certain restraints could temper growth. These include the escalating costs of raw materials, particularly plastics, which directly impact manufacturing expenses for caps and closures. Stringent environmental regulations concerning plastic waste and a growing consumer demand for sustainable packaging alternatives are also significant considerations, pushing manufacturers towards the adoption of recycled content, biodegradable materials, and advanced recycling technologies. Geopolitical factors and supply chain disruptions can also pose challenges to market stability. Nevertheless, the overwhelming trend towards healthy hydration and the dynamic beverage industry, characterized by new product launches and evolving consumer preferences, are expected to outweigh these challenges, ensuring sustained market expansion. The Asia Pacific region, driven by its large population and rising disposable incomes, is anticipated to be a significant growth engine, alongside the established markets in North America and Europe.
caps closures for non carbonated beverages Company Market Share
Report Description:
This in-depth market research report provides a definitive analysis of the global Caps & Closures for Non-Carbonated Beverages market, offering unparalleled insights for industry stakeholders. Spanning a comprehensive study period from 2019 to 2033, with a base year of 2025 and a forecast period from 2025 to 2033, this report meticulously dissects market dynamics, emerging trends, leading segments, product innovations, growth drivers, challenges, and strategic opportunities. Leveraging high-traffic keywords such as "plastic closures," "beverage packaging," "non-carbonated drinks," "bottle caps," "sustainable packaging," "food and beverage industry," and "packaging solutions," this report is optimized for maximum search visibility and aims to attract key decision-makers, manufacturers, suppliers, and investors within the billion-dollar global packaging sector. Our analysis includes granular data on market share, CAGR, market penetration, M&A activities, and key regional dominance, providing actionable intelligence for strategic planning and competitive advantage.
caps closures for non carbonated beverages Market Dynamics & Concentration
The global caps and closures for non-carbonated beverages market is characterized by a moderate to high level of concentration, with several multinational corporations holding significant market share, estimated to be in the hundreds of billions. Key players such as Silgan Plastic Closure Solutions, BERICAP Holding GmbH, Global Closure Systems, Nippon Closures, Berry Plastics Group, Amcor, O.Berk Company, Blackhawk Molding, Tecnocap, AptarGroup, Sonoco Products, and WestRock Company are at the forefront of innovation and market penetration. The primary drivers of market growth include the escalating global demand for bottled water, juices, and dairy-based beverages, coupled with increasing consumer preference for convenient and safe packaging solutions. Regulatory frameworks, particularly those focused on food safety and environmental sustainability, play a crucial role in shaping product development and manufacturing processes, often driving the adoption of recyclable and lightweight materials. Product substitutes, such as alternative sealing mechanisms or multi-use containers, exist but currently hold a minor market share due to established consumer habits and cost-effectiveness of traditional caps and closures. End-user trends are increasingly leaning towards tamper-evident features, ergonomic designs, and sustainable materials, reflecting a growing environmental consciousness among consumers. Mergers and acquisitions (M&A) activity has been consistent, with an estimated dozens of deals annually, as larger companies seek to expand their product portfolios, geographic reach, and technological capabilities. For instance, the historical period (2019-2024) saw several strategic acquisitions aimed at consolidating market positions and acquiring innovative technologies, contributing to the overall market concentration. The base year of 2025 is projected to see the market value exceed several hundred billion, with a significant portion attributed to these leading players.
caps closures for non carbonated beverages Industry Trends & Analysis
The caps and closures for non-carbonated beverages industry is experiencing robust growth, projected to expand at a Compound Annual Growth Rate (CAGR) of approximately 5.5% from 2025 to 2033. This sustained growth is propelled by a confluence of factors, including the burgeoning global population and its increased consumption of convenient, ready-to-drink beverages. The expanding middle class in developing economies, particularly in Asia-Pacific and Latin America, is a significant market penetration driver, as disposable incomes rise and demand for packaged goods escalates. Technological disruptions are playing a pivotal role, with a strong emphasis on lightweighting of closures to reduce material usage and transportation costs, estimated to contribute to billions in cost savings annually across the industry. The development of advanced materials, such as high-barrier plastics and bio-based polymers, is also a key trend, addressing consumer demand for sustainable and eco-friendly packaging. Smart closures, incorporating features like NFC (Near Field Communication) tags or QR codes for product authentication and traceability, are emerging as a niche but rapidly growing segment. Consumer preferences are evolving, with a heightened awareness of health and wellness leading to a surge in demand for functional beverages, which in turn fuels the need for specialized closures that maintain product integrity and shelf life. The convenience factor remains paramount, with consumers seeking easy-to-open and resealable closures for on-the-go consumption. Competitive dynamics within the industry are intense, with established players continuously investing in research and development to stay ahead of the curve. Pricing strategies are influenced by raw material costs, particularly for petrochemicals, and the increasing adoption of recycled content, which can impact overall production expenses. The base year of 2025 is estimated to represent a market value in the hundreds of billions, with the forecast period expected to see significant value creation driven by these multifaceted trends. The historical period (2019-2024) laid the groundwork for these advancements, with early adoption of sustainable practices and initial forays into smart closure technologies. The market penetration for advanced closure technologies is still in its nascent stages but shows tremendous potential for exponential growth.
Leading Markets & Segments in caps closures for non carbonated beverages
The global caps and closures for non-carbonated beverages market is dominated by several key regions and segments, driven by a combination of economic policies, robust infrastructure, and high per capita consumption.
Dominant Regions:
Asia-Pacific: This region consistently emerges as the largest and fastest-growing market, accounting for a significant portion of the global market value, estimated to be in the hundreds of billions.
- Key Drivers:
- Rapid Urbanization and Growing Middle Class: Increasing disposable incomes in countries like China, India, and Southeast Asian nations translate to higher demand for packaged beverages.
- Untapped Market Potential: A large, young population with increasing awareness of convenience and packaged goods presents substantial growth opportunities.
- Favorable Government Policies: Initiatives promoting manufacturing and export, alongside investments in infrastructure, support the growth of the packaging sector.
- Abundant Raw Material Availability: Proximity to petrochemical sources and a developing plastics manufacturing base contribute to cost-effectiveness.
- Key Drivers:
North America: A mature yet consistently strong market, valued in the hundreds of billions, characterized by high consumer spending on bottled beverages and a strong focus on innovation and sustainability.
- Key Drivers:
- High Per Capita Consumption: Established consumer habits for bottled water, juices, and sports drinks drive consistent demand.
- Technological Advancements: Significant investment in R&D for sustainable, lightweight, and smart closure solutions.
- Stringent Regulatory Standards: Emphasis on food safety and environmental regulations pushes for advanced and compliant packaging.
- Strong Retail and Distribution Networks: Well-developed supply chains ensure widespread availability of bottled beverages.
- Key Drivers:
Dominant Segments:
Application: Bottled Water: This segment represents the largest application, driven by global health consciousness and the convenience of portable hydration. The market value for closures specifically for bottled water is in the hundreds of billions.
- Detailed Dominance Analysis: The sheer volume of bottled water consumption worldwide makes this application the primary demand generator for caps and closures. The simplicity of its requirements (e.g., tamper-evident seals, ease of opening) has led to mass production and optimized supply chains, further solidifying its dominant position. Innovations in this segment often focus on cost reduction and sustainability, such as the development of mono-material closures for easier recycling.
Types: Screw Caps: Screw caps, particularly those made from Polypropylene (PP) and High-Density Polyethylene (HDPE), are the most prevalent type of closure for non-carbonated beverages, estimated to hold a substantial share of the market, valued in the hundreds of billions.
- Detailed Dominance Analysis: Their versatility, cost-effectiveness, ease of manufacturing, and superior resealability make them the go-to choice for a vast array of non-carbonated drinks. The established manufacturing infrastructure and the inherent design benefits of screw caps for sealing and dispensing contribute to their widespread adoption across various bottle sizes and neck finishes. Developments in this area often focus on improving sealing performance, reducing material usage through lightweighting, and enhancing tamper-evident features.
The forecast period (2025–2033) is expected to see continued dominance of these regions and segments, with the Asia-Pacific region potentially narrowing the gap with North America in terms of market value and growth rate.
caps closures for non carbonated beverages Product Developments
Product innovation in the caps and closures for non-carbonated beverages market is primarily focused on enhancing functionality, sustainability, and consumer convenience. Advancements in material science are leading to the development of lighter-weight closures made from recycled and bio-based plastics, significantly reducing the environmental footprint. Tamper-evident features are becoming more sophisticated, offering enhanced security and consumer confidence. Furthermore, the integration of smart technologies, such as NFC tags for supply chain traceability and product authentication, is a growing trend. Ergonomic designs are also a key focus, ensuring ease of opening and resealing for consumers on the go. These developments provide a competitive advantage by meeting evolving consumer preferences and stringent regulatory requirements, ensuring market relevance and a strong market fit in the billion-dollar industry.
Key Drivers of caps closures for non carbonated beverages Growth
The growth of the caps and closures for non-carbonated beverages market is propelled by several interconnected factors.
- Technological Advancements: Innovations in material science, leading to lightweight, recyclable, and bio-based closures, are reducing costs and environmental impact.
- Economic Factors: Rising disposable incomes in emerging economies are increasing the demand for packaged beverages, consequently boosting closure consumption.
- Regulatory Frameworks: Stringent regulations concerning food safety and sustainability are driving the adoption of advanced and compliant closure solutions.
- Consumer Preferences: The growing demand for convenience, health-conscious beverages, and eco-friendly products directly influences the types of closures required.
- Urbanization: The shift of populations to urban centers increases the demand for packaged and easily accessible food and beverage products.
Challenges in the caps closures for non carbonated beverages Market
Despite robust growth, the caps and closures for non-carbonated beverages market faces several challenges that can impact its trajectory.
- Volatility in Raw Material Prices: Fluctuations in the cost of petrochemicals, the primary feedstock for plastic closures, can significantly impact profitability and pricing strategies.
- Increasing Environmental Scrutiny and Regulations: Growing concerns over plastic waste and stricter government regulations on single-use plastics may necessitate costly adjustments in manufacturing processes and materials.
- Supply Chain Disruptions: Geopolitical events, natural disasters, and logistical bottlenecks can disrupt the supply of raw materials and the distribution of finished products.
- Intense Competition and Price Pressure: A highly competitive market landscape often leads to price wars, impacting profit margins for manufacturers.
- Development of Alternative Packaging: The emergence of innovative alternative packaging solutions, though currently a minor threat, could pose a long-term challenge.
Emerging Opportunities in caps closures for non carbonated beverages
The caps and closures for non-carbonated beverages market presents numerous emerging opportunities for growth and innovation. The escalating demand for sustainable and circular economy solutions is a major catalyst, driving the development and adoption of closures made from recycled content and plant-based materials. Strategic partnerships between closure manufacturers and beverage brands are crucial for co-developing customized and innovative packaging solutions that meet specific product needs and consumer expectations. Market expansion into untapped regions, particularly in developing economies with growing middle classes and increasing consumption of bottled beverages, offers significant potential. Furthermore, the integration of smart technologies into closures for enhanced traceability, brand engagement, and consumer interaction represents a burgeoning area of opportunity.
Leading Players in the caps closures for non carbonated beverages Sector
- Silgan Plastic Closure Solutions
- BERICAP Holding GmbH
- Global Closure Systems
- Nippon Closures
- Berry Plastics Group
- Amcor
- O.Berk Company
- Blackhawk Molding
- Tecnocap
- AptarGroup
- Sonoco Products
- WestRock Company
Key Milestones in caps closures for non carbonated beverages Industry
- 2019: Increased focus on lightweighting initiatives to reduce plastic usage and carbon footprint.
- 2020: Early adoption of rPET (recycled polyethylene terephthalate) in closure manufacturing for beverage bottles.
- 2021: Introduction of novel tamper-evident closure designs offering enhanced security.
- 2022: Growing investment in research and development for bio-based and biodegradable closure materials.
- 2023: Significant M&A activities as larger players consolidate to expand market reach and product portfolios.
- 2024: Increased exploration of smart closure technologies for supply chain traceability and consumer engagement.
Strategic Outlook for caps closures for non carbonated beverages Market
The strategic outlook for the caps and closures for non-carbonated beverages market is overwhelmingly positive, characterized by sustained growth and continuous innovation. Key growth accelerators include the increasing global demand for bottled water and functional beverages, driven by health and wellness trends. The imperative for sustainability will continue to shape product development, with a strong emphasis on recycled content, bio-based materials, and circular economy principles. Technological advancements, particularly in lightweighting and smart closure solutions, will offer significant competitive advantages. Strategic partnerships between manufacturers and beverage brands will be crucial for fostering innovation and market penetration. The market is poised for continued value creation, estimated in the hundreds of billions, as companies adapt to evolving consumer demands and regulatory landscapes, ensuring a robust and dynamic future.
caps closures for non carbonated beverages Segmentation
- 1. Application
- 2. Types
caps closures for non carbonated beverages Segmentation By Geography
-
1. North America
- 1.1. United States
- 1.2. Canada
- 1.3. Mexico
-
2. South America
- 2.1. Brazil
- 2.2. Argentina
- 2.3. Rest of South America
-
3. Europe
- 3.1. United Kingdom
- 3.2. Germany
- 3.3. France
- 3.4. Italy
- 3.5. Spain
- 3.6. Russia
- 3.7. Benelux
- 3.8. Nordics
- 3.9. Rest of Europe
-
4. Middle East & Africa
- 4.1. Turkey
- 4.2. Israel
- 4.3. GCC
- 4.4. North Africa
- 4.5. South Africa
- 4.6. Rest of Middle East & Africa
-
5. Asia Pacific
- 5.1. China
- 5.2. India
- 5.3. Japan
- 5.4. South Korea
- 5.5. ASEAN
- 5.6. Oceania
- 5.7. Rest of Asia Pacific
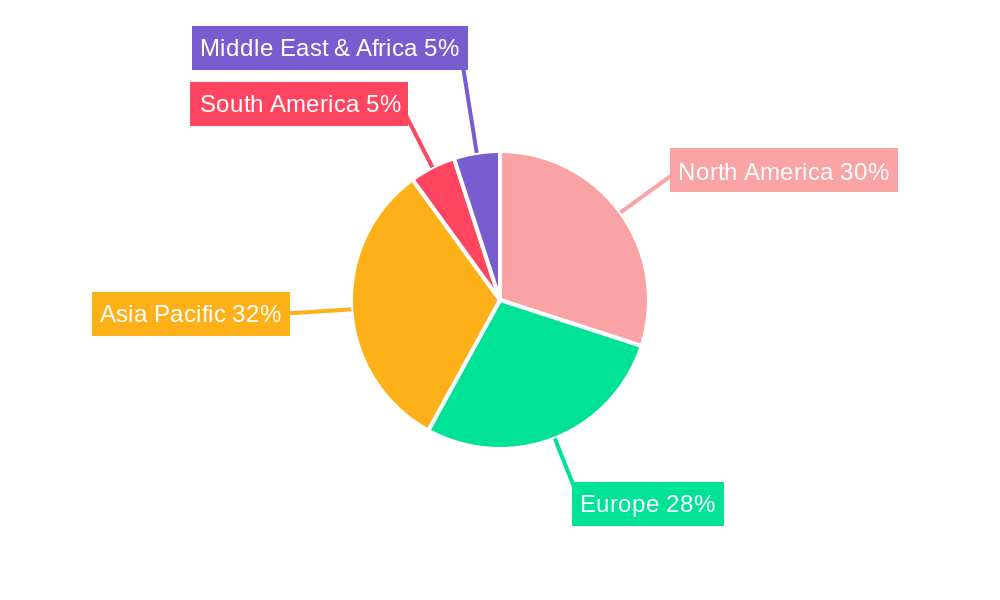
caps closures for non carbonated beverages Regional Market Share
Geographic Coverage of caps closures for non carbonated beverages
caps closures for non carbonated beverages REPORT HIGHLIGHTS
| Aspects | Details |
|---|---|
| Study Period | 2020-2034 |
| Base Year | 2025 |
| Estimated Year | 2026 |
| Forecast Period | 2026-2034 |
| Historical Period | 2020-2025 |
| Growth Rate | CAGR of 4.6% from 2020-2034 |
| Segmentation |
|
Table of Contents
- 1. Introduction
- 1.1. Research Scope
- 1.2. Market Segmentation
- 1.3. Research Methodology
- 1.4. Definitions and Assumptions
- 2. Executive Summary
- 2.1. Introduction
- 3. Market Dynamics
- 3.1. Introduction
- 3.2. Market Drivers
- 3.3. Market Restrains
- 3.4. Market Trends
- 4. Market Factor Analysis
- 4.1. Porters Five Forces
- 4.2. Supply/Value Chain
- 4.3. PESTEL analysis
- 4.4. Market Entropy
- 4.5. Patent/Trademark Analysis
- 5. Global caps closures for non carbonated beverages Analysis, Insights and Forecast, 2020-2032
- 5.1. Market Analysis, Insights and Forecast - by Application
- 5.2. Market Analysis, Insights and Forecast - by Types
- 5.3. Market Analysis, Insights and Forecast - by Region
- 5.3.1. North America
- 5.3.2. South America
- 5.3.3. Europe
- 5.3.4. Middle East & Africa
- 5.3.5. Asia Pacific
- 5.1. Market Analysis, Insights and Forecast - by Application
- 6. North America caps closures for non carbonated beverages Analysis, Insights and Forecast, 2020-2032
- 6.1. Market Analysis, Insights and Forecast - by Application
- 6.2. Market Analysis, Insights and Forecast - by Types
- 6.1. Market Analysis, Insights and Forecast - by Application
- 7. South America caps closures for non carbonated beverages Analysis, Insights and Forecast, 2020-2032
- 7.1. Market Analysis, Insights and Forecast - by Application
- 7.2. Market Analysis, Insights and Forecast - by Types
- 7.1. Market Analysis, Insights and Forecast - by Application
- 8. Europe caps closures for non carbonated beverages Analysis, Insights and Forecast, 2020-2032
- 8.1. Market Analysis, Insights and Forecast - by Application
- 8.2. Market Analysis, Insights and Forecast - by Types
- 8.1. Market Analysis, Insights and Forecast - by Application
- 9. Middle East & Africa caps closures for non carbonated beverages Analysis, Insights and Forecast, 2020-2032
- 9.1. Market Analysis, Insights and Forecast - by Application
- 9.2. Market Analysis, Insights and Forecast - by Types
- 9.1. Market Analysis, Insights and Forecast - by Application
- 10. Asia Pacific caps closures for non carbonated beverages Analysis, Insights and Forecast, 2020-2032
- 10.1. Market Analysis, Insights and Forecast - by Application
- 10.2. Market Analysis, Insights and Forecast - by Types
- 10.1. Market Analysis, Insights and Forecast - by Application
- 11. Competitive Analysis
- 11.1. Global Market Share Analysis 2025
- 11.2. Company Profiles
- 11.2.1 Silgan Plastic Closure Solutions
- 11.2.1.1. Overview
- 11.2.1.2. Products
- 11.2.1.3. SWOT Analysis
- 11.2.1.4. Recent Developments
- 11.2.1.5. Financials (Based on Availability)
- 11.2.2 BERICAP Holding GmbH
- 11.2.2.1. Overview
- 11.2.2.2. Products
- 11.2.2.3. SWOT Analysis
- 11.2.2.4. Recent Developments
- 11.2.2.5. Financials (Based on Availability)
- 11.2.3 Global Closure Systems
- 11.2.3.1. Overview
- 11.2.3.2. Products
- 11.2.3.3. SWOT Analysis
- 11.2.3.4. Recent Developments
- 11.2.3.5. Financials (Based on Availability)
- 11.2.4 Nippon Closures
- 11.2.4.1. Overview
- 11.2.4.2. Products
- 11.2.4.3. SWOT Analysis
- 11.2.4.4. Recent Developments
- 11.2.4.5. Financials (Based on Availability)
- 11.2.5 Berry Plastics Group
- 11.2.5.1. Overview
- 11.2.5.2. Products
- 11.2.5.3. SWOT Analysis
- 11.2.5.4. Recent Developments
- 11.2.5.5. Financials (Based on Availability)
- 11.2.6 Amcor
- 11.2.6.1. Overview
- 11.2.6.2. Products
- 11.2.6.3. SWOT Analysis
- 11.2.6.4. Recent Developments
- 11.2.6.5. Financials (Based on Availability)
- 11.2.7 O.Berk Company
- 11.2.7.1. Overview
- 11.2.7.2. Products
- 11.2.7.3. SWOT Analysis
- 11.2.7.4. Recent Developments
- 11.2.7.5. Financials (Based on Availability)
- 11.2.8 Blackhawk Molding
- 11.2.8.1. Overview
- 11.2.8.2. Products
- 11.2.8.3. SWOT Analysis
- 11.2.8.4. Recent Developments
- 11.2.8.5. Financials (Based on Availability)
- 11.2.9 Tecnocap
- 11.2.9.1. Overview
- 11.2.9.2. Products
- 11.2.9.3. SWOT Analysis
- 11.2.9.4. Recent Developments
- 11.2.9.5. Financials (Based on Availability)
- 11.2.10 AptarGroup
- 11.2.10.1. Overview
- 11.2.10.2. Products
- 11.2.10.3. SWOT Analysis
- 11.2.10.4. Recent Developments
- 11.2.10.5. Financials (Based on Availability)
- 11.2.11 Sonoco Products
- 11.2.11.1. Overview
- 11.2.11.2. Products
- 11.2.11.3. SWOT Analysis
- 11.2.11.4. Recent Developments
- 11.2.11.5. Financials (Based on Availability)
- 11.2.12 WestRock Company
- 11.2.12.1. Overview
- 11.2.12.2. Products
- 11.2.12.3. SWOT Analysis
- 11.2.12.4. Recent Developments
- 11.2.12.5. Financials (Based on Availability)
- 11.2.1 Silgan Plastic Closure Solutions
List of Figures
- Figure 1: Global caps closures for non carbonated beverages Revenue Breakdown (undefined, %) by Region 2025 & 2033
- Figure 2: Global caps closures for non carbonated beverages Volume Breakdown (K, %) by Region 2025 & 2033
- Figure 3: North America caps closures for non carbonated beverages Revenue (undefined), by Application 2025 & 2033
- Figure 4: North America caps closures for non carbonated beverages Volume (K), by Application 2025 & 2033
- Figure 5: North America caps closures for non carbonated beverages Revenue Share (%), by Application 2025 & 2033
- Figure 6: North America caps closures for non carbonated beverages Volume Share (%), by Application 2025 & 2033
- Figure 7: North America caps closures for non carbonated beverages Revenue (undefined), by Types 2025 & 2033
- Figure 8: North America caps closures for non carbonated beverages Volume (K), by Types 2025 & 2033
- Figure 9: North America caps closures for non carbonated beverages Revenue Share (%), by Types 2025 & 2033
- Figure 10: North America caps closures for non carbonated beverages Volume Share (%), by Types 2025 & 2033
- Figure 11: North America caps closures for non carbonated beverages Revenue (undefined), by Country 2025 & 2033
- Figure 12: North America caps closures for non carbonated beverages Volume (K), by Country 2025 & 2033
- Figure 13: North America caps closures for non carbonated beverages Revenue Share (%), by Country 2025 & 2033
- Figure 14: North America caps closures for non carbonated beverages Volume Share (%), by Country 2025 & 2033
- Figure 15: South America caps closures for non carbonated beverages Revenue (undefined), by Application 2025 & 2033
- Figure 16: South America caps closures for non carbonated beverages Volume (K), by Application 2025 & 2033
- Figure 17: South America caps closures for non carbonated beverages Revenue Share (%), by Application 2025 & 2033
- Figure 18: South America caps closures for non carbonated beverages Volume Share (%), by Application 2025 & 2033
- Figure 19: South America caps closures for non carbonated beverages Revenue (undefined), by Types 2025 & 2033
- Figure 20: South America caps closures for non carbonated beverages Volume (K), by Types 2025 & 2033
- Figure 21: South America caps closures for non carbonated beverages Revenue Share (%), by Types 2025 & 2033
- Figure 22: South America caps closures for non carbonated beverages Volume Share (%), by Types 2025 & 2033
- Figure 23: South America caps closures for non carbonated beverages Revenue (undefined), by Country 2025 & 2033
- Figure 24: South America caps closures for non carbonated beverages Volume (K), by Country 2025 & 2033
- Figure 25: South America caps closures for non carbonated beverages Revenue Share (%), by Country 2025 & 2033
- Figure 26: South America caps closures for non carbonated beverages Volume Share (%), by Country 2025 & 2033
- Figure 27: Europe caps closures for non carbonated beverages Revenue (undefined), by Application 2025 & 2033
- Figure 28: Europe caps closures for non carbonated beverages Volume (K), by Application 2025 & 2033
- Figure 29: Europe caps closures for non carbonated beverages Revenue Share (%), by Application 2025 & 2033
- Figure 30: Europe caps closures for non carbonated beverages Volume Share (%), by Application 2025 & 2033
- Figure 31: Europe caps closures for non carbonated beverages Revenue (undefined), by Types 2025 & 2033
- Figure 32: Europe caps closures for non carbonated beverages Volume (K), by Types 2025 & 2033
- Figure 33: Europe caps closures for non carbonated beverages Revenue Share (%), by Types 2025 & 2033
- Figure 34: Europe caps closures for non carbonated beverages Volume Share (%), by Types 2025 & 2033
- Figure 35: Europe caps closures for non carbonated beverages Revenue (undefined), by Country 2025 & 2033
- Figure 36: Europe caps closures for non carbonated beverages Volume (K), by Country 2025 & 2033
- Figure 37: Europe caps closures for non carbonated beverages Revenue Share (%), by Country 2025 & 2033
- Figure 38: Europe caps closures for non carbonated beverages Volume Share (%), by Country 2025 & 2033
- Figure 39: Middle East & Africa caps closures for non carbonated beverages Revenue (undefined), by Application 2025 & 2033
- Figure 40: Middle East & Africa caps closures for non carbonated beverages Volume (K), by Application 2025 & 2033
- Figure 41: Middle East & Africa caps closures for non carbonated beverages Revenue Share (%), by Application 2025 & 2033
- Figure 42: Middle East & Africa caps closures for non carbonated beverages Volume Share (%), by Application 2025 & 2033
- Figure 43: Middle East & Africa caps closures for non carbonated beverages Revenue (undefined), by Types 2025 & 2033
- Figure 44: Middle East & Africa caps closures for non carbonated beverages Volume (K), by Types 2025 & 2033
- Figure 45: Middle East & Africa caps closures for non carbonated beverages Revenue Share (%), by Types 2025 & 2033
- Figure 46: Middle East & Africa caps closures for non carbonated beverages Volume Share (%), by Types 2025 & 2033
- Figure 47: Middle East & Africa caps closures for non carbonated beverages Revenue (undefined), by Country 2025 & 2033
- Figure 48: Middle East & Africa caps closures for non carbonated beverages Volume (K), by Country 2025 & 2033
- Figure 49: Middle East & Africa caps closures for non carbonated beverages Revenue Share (%), by Country 2025 & 2033
- Figure 50: Middle East & Africa caps closures for non carbonated beverages Volume Share (%), by Country 2025 & 2033
- Figure 51: Asia Pacific caps closures for non carbonated beverages Revenue (undefined), by Application 2025 & 2033
- Figure 52: Asia Pacific caps closures for non carbonated beverages Volume (K), by Application 2025 & 2033
- Figure 53: Asia Pacific caps closures for non carbonated beverages Revenue Share (%), by Application 2025 & 2033
- Figure 54: Asia Pacific caps closures for non carbonated beverages Volume Share (%), by Application 2025 & 2033
- Figure 55: Asia Pacific caps closures for non carbonated beverages Revenue (undefined), by Types 2025 & 2033
- Figure 56: Asia Pacific caps closures for non carbonated beverages Volume (K), by Types 2025 & 2033
- Figure 57: Asia Pacific caps closures for non carbonated beverages Revenue Share (%), by Types 2025 & 2033
- Figure 58: Asia Pacific caps closures for non carbonated beverages Volume Share (%), by Types 2025 & 2033
- Figure 59: Asia Pacific caps closures for non carbonated beverages Revenue (undefined), by Country 2025 & 2033
- Figure 60: Asia Pacific caps closures for non carbonated beverages Volume (K), by Country 2025 & 2033
- Figure 61: Asia Pacific caps closures for non carbonated beverages Revenue Share (%), by Country 2025 & 2033
- Figure 62: Asia Pacific caps closures for non carbonated beverages Volume Share (%), by Country 2025 & 2033
List of Tables
- Table 1: Global caps closures for non carbonated beverages Revenue undefined Forecast, by Application 2020 & 2033
- Table 2: Global caps closures for non carbonated beverages Volume K Forecast, by Application 2020 & 2033
- Table 3: Global caps closures for non carbonated beverages Revenue undefined Forecast, by Types 2020 & 2033
- Table 4: Global caps closures for non carbonated beverages Volume K Forecast, by Types 2020 & 2033
- Table 5: Global caps closures for non carbonated beverages Revenue undefined Forecast, by Region 2020 & 2033
- Table 6: Global caps closures for non carbonated beverages Volume K Forecast, by Region 2020 & 2033
- Table 7: Global caps closures for non carbonated beverages Revenue undefined Forecast, by Application 2020 & 2033
- Table 8: Global caps closures for non carbonated beverages Volume K Forecast, by Application 2020 & 2033
- Table 9: Global caps closures for non carbonated beverages Revenue undefined Forecast, by Types 2020 & 2033
- Table 10: Global caps closures for non carbonated beverages Volume K Forecast, by Types 2020 & 2033
- Table 11: Global caps closures for non carbonated beverages Revenue undefined Forecast, by Country 2020 & 2033
- Table 12: Global caps closures for non carbonated beverages Volume K Forecast, by Country 2020 & 2033
- Table 13: United States caps closures for non carbonated beverages Revenue (undefined) Forecast, by Application 2020 & 2033
- Table 14: United States caps closures for non carbonated beverages Volume (K) Forecast, by Application 2020 & 2033
- Table 15: Canada caps closures for non carbonated beverages Revenue (undefined) Forecast, by Application 2020 & 2033
- Table 16: Canada caps closures for non carbonated beverages Volume (K) Forecast, by Application 2020 & 2033
- Table 17: Mexico caps closures for non carbonated beverages Revenue (undefined) Forecast, by Application 2020 & 2033
- Table 18: Mexico caps closures for non carbonated beverages Volume (K) Forecast, by Application 2020 & 2033
- Table 19: Global caps closures for non carbonated beverages Revenue undefined Forecast, by Application 2020 & 2033
- Table 20: Global caps closures for non carbonated beverages Volume K Forecast, by Application 2020 & 2033
- Table 21: Global caps closures for non carbonated beverages Revenue undefined Forecast, by Types 2020 & 2033
- Table 22: Global caps closures for non carbonated beverages Volume K Forecast, by Types 2020 & 2033
- Table 23: Global caps closures for non carbonated beverages Revenue undefined Forecast, by Country 2020 & 2033
- Table 24: Global caps closures for non carbonated beverages Volume K Forecast, by Country 2020 & 2033
- Table 25: Brazil caps closures for non carbonated beverages Revenue (undefined) Forecast, by Application 2020 & 2033
- Table 26: Brazil caps closures for non carbonated beverages Volume (K) Forecast, by Application 2020 & 2033
- Table 27: Argentina caps closures for non carbonated beverages Revenue (undefined) Forecast, by Application 2020 & 2033
- Table 28: Argentina caps closures for non carbonated beverages Volume (K) Forecast, by Application 2020 & 2033
- Table 29: Rest of South America caps closures for non carbonated beverages Revenue (undefined) Forecast, by Application 2020 & 2033
- Table 30: Rest of South America caps closures for non carbonated beverages Volume (K) Forecast, by Application 2020 & 2033
- Table 31: Global caps closures for non carbonated beverages Revenue undefined Forecast, by Application 2020 & 2033
- Table 32: Global caps closures for non carbonated beverages Volume K Forecast, by Application 2020 & 2033
- Table 33: Global caps closures for non carbonated beverages Revenue undefined Forecast, by Types 2020 & 2033
- Table 34: Global caps closures for non carbonated beverages Volume K Forecast, by Types 2020 & 2033
- Table 35: Global caps closures for non carbonated beverages Revenue undefined Forecast, by Country 2020 & 2033
- Table 36: Global caps closures for non carbonated beverages Volume K Forecast, by Country 2020 & 2033
- Table 37: United Kingdom caps closures for non carbonated beverages Revenue (undefined) Forecast, by Application 2020 & 2033
- Table 38: United Kingdom caps closures for non carbonated beverages Volume (K) Forecast, by Application 2020 & 2033
- Table 39: Germany caps closures for non carbonated beverages Revenue (undefined) Forecast, by Application 2020 & 2033
- Table 40: Germany caps closures for non carbonated beverages Volume (K) Forecast, by Application 2020 & 2033
- Table 41: France caps closures for non carbonated beverages Revenue (undefined) Forecast, by Application 2020 & 2033
- Table 42: France caps closures for non carbonated beverages Volume (K) Forecast, by Application 2020 & 2033
- Table 43: Italy caps closures for non carbonated beverages Revenue (undefined) Forecast, by Application 2020 & 2033
- Table 44: Italy caps closures for non carbonated beverages Volume (K) Forecast, by Application 2020 & 2033
- Table 45: Spain caps closures for non carbonated beverages Revenue (undefined) Forecast, by Application 2020 & 2033
- Table 46: Spain caps closures for non carbonated beverages Volume (K) Forecast, by Application 2020 & 2033
- Table 47: Russia caps closures for non carbonated beverages Revenue (undefined) Forecast, by Application 2020 & 2033
- Table 48: Russia caps closures for non carbonated beverages Volume (K) Forecast, by Application 2020 & 2033
- Table 49: Benelux caps closures for non carbonated beverages Revenue (undefined) Forecast, by Application 2020 & 2033
- Table 50: Benelux caps closures for non carbonated beverages Volume (K) Forecast, by Application 2020 & 2033
- Table 51: Nordics caps closures for non carbonated beverages Revenue (undefined) Forecast, by Application 2020 & 2033
- Table 52: Nordics caps closures for non carbonated beverages Volume (K) Forecast, by Application 2020 & 2033
- Table 53: Rest of Europe caps closures for non carbonated beverages Revenue (undefined) Forecast, by Application 2020 & 2033
- Table 54: Rest of Europe caps closures for non carbonated beverages Volume (K) Forecast, by Application 2020 & 2033
- Table 55: Global caps closures for non carbonated beverages Revenue undefined Forecast, by Application 2020 & 2033
- Table 56: Global caps closures for non carbonated beverages Volume K Forecast, by Application 2020 & 2033
- Table 57: Global caps closures for non carbonated beverages Revenue undefined Forecast, by Types 2020 & 2033
- Table 58: Global caps closures for non carbonated beverages Volume K Forecast, by Types 2020 & 2033
- Table 59: Global caps closures for non carbonated beverages Revenue undefined Forecast, by Country 2020 & 2033
- Table 60: Global caps closures for non carbonated beverages Volume K Forecast, by Country 2020 & 2033
- Table 61: Turkey caps closures for non carbonated beverages Revenue (undefined) Forecast, by Application 2020 & 2033
- Table 62: Turkey caps closures for non carbonated beverages Volume (K) Forecast, by Application 2020 & 2033
- Table 63: Israel caps closures for non carbonated beverages Revenue (undefined) Forecast, by Application 2020 & 2033
- Table 64: Israel caps closures for non carbonated beverages Volume (K) Forecast, by Application 2020 & 2033
- Table 65: GCC caps closures for non carbonated beverages Revenue (undefined) Forecast, by Application 2020 & 2033
- Table 66: GCC caps closures for non carbonated beverages Volume (K) Forecast, by Application 2020 & 2033
- Table 67: North Africa caps closures for non carbonated beverages Revenue (undefined) Forecast, by Application 2020 & 2033
- Table 68: North Africa caps closures for non carbonated beverages Volume (K) Forecast, by Application 2020 & 2033
- Table 69: South Africa caps closures for non carbonated beverages Revenue (undefined) Forecast, by Application 2020 & 2033
- Table 70: South Africa caps closures for non carbonated beverages Volume (K) Forecast, by Application 2020 & 2033
- Table 71: Rest of Middle East & Africa caps closures for non carbonated beverages Revenue (undefined) Forecast, by Application 2020 & 2033
- Table 72: Rest of Middle East & Africa caps closures for non carbonated beverages Volume (K) Forecast, by Application 2020 & 2033
- Table 73: Global caps closures for non carbonated beverages Revenue undefined Forecast, by Application 2020 & 2033
- Table 74: Global caps closures for non carbonated beverages Volume K Forecast, by Application 2020 & 2033
- Table 75: Global caps closures for non carbonated beverages Revenue undefined Forecast, by Types 2020 & 2033
- Table 76: Global caps closures for non carbonated beverages Volume K Forecast, by Types 2020 & 2033
- Table 77: Global caps closures for non carbonated beverages Revenue undefined Forecast, by Country 2020 & 2033
- Table 78: Global caps closures for non carbonated beverages Volume K Forecast, by Country 2020 & 2033
- Table 79: China caps closures for non carbonated beverages Revenue (undefined) Forecast, by Application 2020 & 2033
- Table 80: China caps closures for non carbonated beverages Volume (K) Forecast, by Application 2020 & 2033
- Table 81: India caps closures for non carbonated beverages Revenue (undefined) Forecast, by Application 2020 & 2033
- Table 82: India caps closures for non carbonated beverages Volume (K) Forecast, by Application 2020 & 2033
- Table 83: Japan caps closures for non carbonated beverages Revenue (undefined) Forecast, by Application 2020 & 2033
- Table 84: Japan caps closures for non carbonated beverages Volume (K) Forecast, by Application 2020 & 2033
- Table 85: South Korea caps closures for non carbonated beverages Revenue (undefined) Forecast, by Application 2020 & 2033
- Table 86: South Korea caps closures for non carbonated beverages Volume (K) Forecast, by Application 2020 & 2033
- Table 87: ASEAN caps closures for non carbonated beverages Revenue (undefined) Forecast, by Application 2020 & 2033
- Table 88: ASEAN caps closures for non carbonated beverages Volume (K) Forecast, by Application 2020 & 2033
- Table 89: Oceania caps closures for non carbonated beverages Revenue (undefined) Forecast, by Application 2020 & 2033
- Table 90: Oceania caps closures for non carbonated beverages Volume (K) Forecast, by Application 2020 & 2033
- Table 91: Rest of Asia Pacific caps closures for non carbonated beverages Revenue (undefined) Forecast, by Application 2020 & 2033
- Table 92: Rest of Asia Pacific caps closures for non carbonated beverages Volume (K) Forecast, by Application 2020 & 2033
Frequently Asked Questions
1. What is the projected Compound Annual Growth Rate (CAGR) of the caps closures for non carbonated beverages?
The projected CAGR is approximately 4.6%.
2. Which companies are prominent players in the caps closures for non carbonated beverages?
Key companies in the market include Silgan Plastic Closure Solutions, BERICAP Holding GmbH, Global Closure Systems, Nippon Closures, Berry Plastics Group, Amcor, O.Berk Company, Blackhawk Molding, Tecnocap, AptarGroup, Sonoco Products, WestRock Company.
3. What are the main segments of the caps closures for non carbonated beverages?
The market segments include Application, Types.
4. Can you provide details about the market size?
The market size is estimated to be USD XXX N/A as of 2022.
5. What are some drivers contributing to market growth?
N/A
6. What are the notable trends driving market growth?
N/A
7. Are there any restraints impacting market growth?
N/A
8. Can you provide examples of recent developments in the market?
N/A
9. What pricing options are available for accessing the report?
Pricing options include single-user, multi-user, and enterprise licenses priced at USD 4350.00, USD 6525.00, and USD 8700.00 respectively.
10. Is the market size provided in terms of value or volume?
The market size is provided in terms of value, measured in N/A and volume, measured in K.
11. Are there any specific market keywords associated with the report?
Yes, the market keyword associated with the report is "caps closures for non carbonated beverages," which aids in identifying and referencing the specific market segment covered.
12. How do I determine which pricing option suits my needs best?
The pricing options vary based on user requirements and access needs. Individual users may opt for single-user licenses, while businesses requiring broader access may choose multi-user or enterprise licenses for cost-effective access to the report.
13. Are there any additional resources or data provided in the caps closures for non carbonated beverages report?
While the report offers comprehensive insights, it's advisable to review the specific contents or supplementary materials provided to ascertain if additional resources or data are available.
14. How can I stay updated on further developments or reports in the caps closures for non carbonated beverages?
To stay informed about further developments, trends, and reports in the caps closures for non carbonated beverages, consider subscribing to industry newsletters, following relevant companies and organizations, or regularly checking reputable industry news sources and publications.
Methodology
Step 1 - Identification of Relevant Samples Size from Population Database


Step 2 - Approaches for Defining Global Market Size (Value, Volume* & Price*)

Note*: In applicable scenarios
Step 3 - Data Sources
Primary Research
- Web Analytics
- Survey Reports
- Research Institute
- Latest Research Reports
- Opinion Leaders
Secondary Research
- Annual Reports
- White Paper
- Latest Press Release
- Industry Association
- Paid Database
- Investor Presentations

Step 4 - Data Triangulation
Involves using different sources of information in order to increase the validity of a study
These sources are likely to be stakeholders in a program - participants, other researchers, program staff, other community members, and so on.
Then we put all data in single framework & apply various statistical tools to find out the dynamic on the market.
During the analysis stage, feedback from the stakeholder groups would be compared to determine areas of agreement as well as areas of divergence