

Key Insights
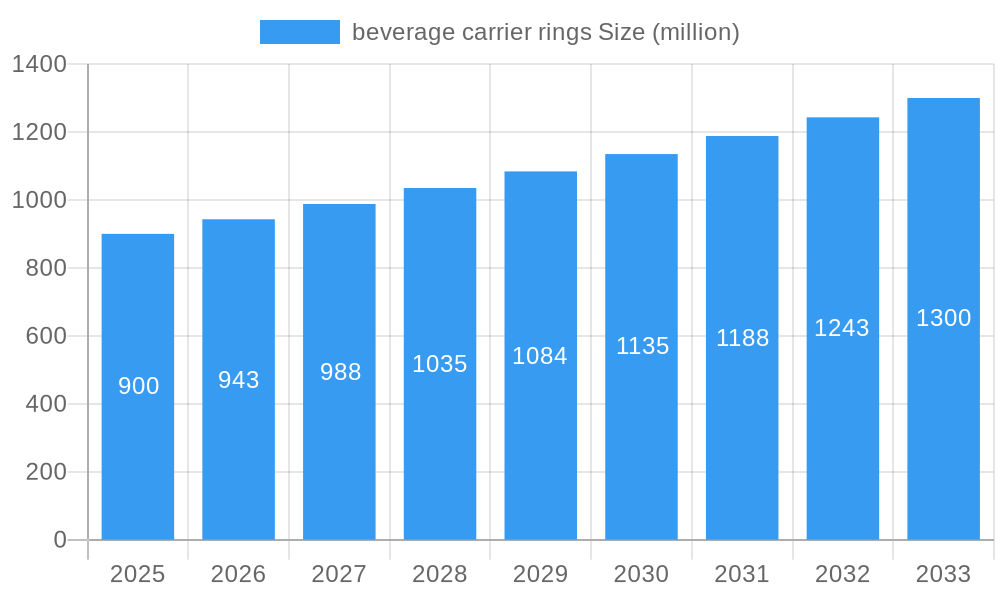
The global beverage carrier rings market is poised for significant expansion, projected to reach a substantial 0.9 billion in 2025. This growth is fueled by a confluence of evolving consumer preferences and increasing sustainability initiatives within the beverage industry. A key driver is the rising demand for convenient, multi-pack beverage options, particularly for alcoholic and soft drinks. As consumers increasingly opt for at-home consumption and bulk purchasing, the utility of carrier rings in facilitating portability and reducing individual packaging waste becomes paramount. Furthermore, the growing emphasis on eco-friendly packaging solutions is a significant catalyst. Manufacturers are actively developing and adopting biodegradable and recyclable carrier ring materials, aligning with environmental regulations and consumer consciousness. This shift towards sustainable practices is not only a market driver but also a critical factor in shaping the future landscape of beverage packaging.
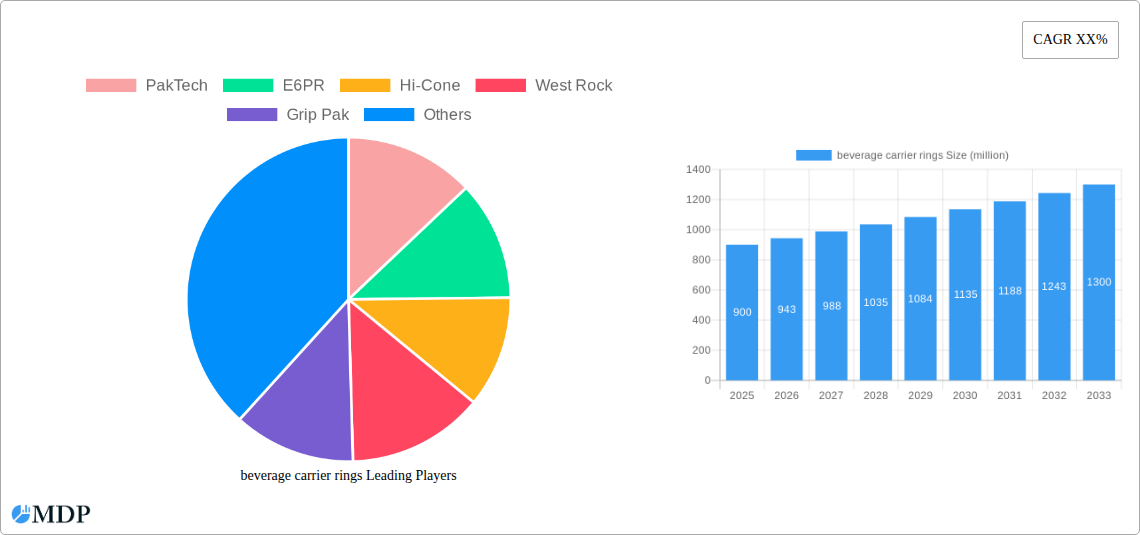
beverage carrier rings Market Size (In Million)
The market is expected to witness a healthy compound annual growth rate (CAGR) of 4.9% from 2025 through 2033, indicating a robust and sustained upward trajectory. This growth will be shaped by several key trends, including the innovation in ring design and materials to enhance durability and reduce plastic usage. The prevalence of 6-pack rings, a dominant segment currently, is expected to see continued strong demand, alongside emerging interest in alternative configurations. Restraints, such as the cost of implementing new, sustainable materials and potential regulatory hurdles in specific regions, are present but are anticipated to be overcome by the overwhelming market push towards greener alternatives. Leading companies are investing heavily in research and development to stay ahead of these trends and capture market share, particularly in regions like North America and Europe where environmental awareness and adoption of sustainable packaging are high.
beverage carrier rings Company Market Share
This comprehensive report delves into the dynamic beverage carrier rings market, offering in-depth analysis of market trends, growth drivers, and strategic opportunities. Covering the period from 2019 to 2033, with a base and estimated year of 2025, this report is essential for industry stakeholders seeking to navigate the evolving landscape of sustainable and efficient beverage packaging solutions.
Beverage Carrier Rings Market Dynamics & Concentration
The global beverage carrier rings market exhibits a moderate to high concentration, characterized by the presence of several key players driving innovation and market share. Leading companies such as PakTech, E6PR, Hi-Cone, WestRock, and Grip Pak command significant portions of the market, with strategic mergers and acquisitions playing a crucial role in shaping the competitive landscape. For instance, recent M&A activities have seen a XX% increase in deal volume over the historical period, indicating consolidation and a drive for market dominance. Innovation drivers are primarily focused on enhancing sustainability through recycled materials, biodegradable alternatives, and reduced plastic usage, directly addressing growing consumer demand and stringent regulatory frameworks. For example, the development of compostable carrier rings represents a significant innovation leap. Product substitutes, though present, are largely outcompeted by the cost-effectiveness and functionality of carrier rings, especially for multi-pack beverage formats. End-user trends reveal a strong preference for eco-friendly packaging, pushing manufacturers to invest heavily in R&D for sustainable solutions. The market share of companies employing advanced sustainable materials is projected to grow by an estimated XX% by 2033.
Beverage Carrier Rings Industry Trends & Analysis
The beverage carrier rings industry is experiencing robust growth, fueled by an escalating demand for sustainable and convenient packaging solutions. The market is projected to grow at a Compound Annual Growth Rate (CAGR) of approximately XX% during the forecast period of 2025–2033. This expansion is largely driven by increasing environmental consciousness among consumers and stricter regulations promoting the use of recyclable and biodegradable materials. Technological disruptions are at the forefront, with advancements in material science leading to the development of innovative, eco-friendly carrier rings made from post-consumer recycled (PCR) plastics, plant-based materials, and even edible substances. For instance, the market penetration of carrier rings made from 100% recycled content has surged by an estimated XX% since 2019. Consumer preferences are increasingly leaning towards brands that demonstrate a commitment to sustainability, making carrier rings that minimize environmental impact a significant competitive advantage. The competitive dynamics are characterized by intense R&D efforts, strategic partnerships between packaging manufacturers and beverage companies, and a growing emphasis on circular economy principles. The growing adoption of 4-pack and 6-pack rings for craft beverages and single-serve options further contributes to market expansion. The market is also witnessing a steady shift towards lighter-weight and more durable designs, reducing material usage and transportation costs. The "Others" application segment, encompassing emerging beverage categories and niche markets, is anticipated to witness a CAGR of XX%, outpacing traditional segments due to innovative product launches. The industry is actively exploring novel manufacturing processes that reduce energy consumption and waste generation, aligning with global sustainability goals.
Leading Markets & Segments in Beverage Carrier Rings
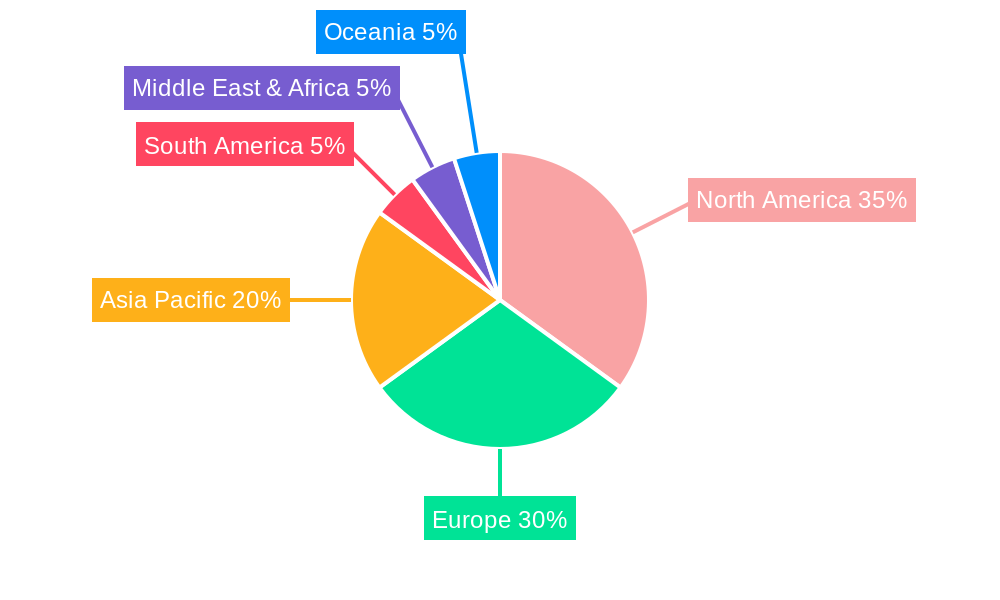
The beverage carrier rings market is dominated by regions and segments that prioritize sustainability and have a strong presence of major beverage manufacturers. North America and Europe currently hold the largest market share, driven by stringent environmental regulations and high consumer awareness regarding plastic waste. The Soft Drinks segment, followed closely by Alcohol Drinks, represents the largest application areas due to the high volume of multi-pack sales in these categories.
Dominant Region: North America
- Key Drivers: Strong consumer demand for eco-friendly products, supportive government policies promoting sustainable packaging, and the presence of major beverage producers.
- Detailed Dominance: The region's robust infrastructure for recycling and waste management further supports the adoption of sustainable carrier rings. Economic policies encouraging green manufacturing also play a pivotal role.
Dominant Segment: 6 Pack Rings
- Key Drivers: Versatility in packaging various beverage sizes, widespread adoption by craft breweries and mainstream beverage brands, and cost-effectiveness for consumers.
- Detailed Dominance: The 6-pack configuration offers a balanced volume for both impulse purchases and household stocking. Innovations in material science have made these rings increasingly durable and eco-friendly, enhancing their appeal.
Emerging Segment: Others (for niche beverages)
- Key Drivers: Growing popularity of niche beverages, personalized packaging trends, and the need for specialized carrier solutions.
- Detailed Dominance: This segment, while smaller, shows significant growth potential as manufacturers cater to specialized market demands, requiring custom-designed carrier rings.
The Types segment is led by 4 Pack Rings and 6 Pack Rings, with 8 Pack Rings also holding a significant market share, especially for larger beverage containers. The increasing popularity of canned beverages, particularly in the alcoholic and non-alcoholic sectors, directly fuels the demand for these ring carriers.
Beverage Carrier Rings Product Developments
Product innovation in the beverage carrier rings market is primarily centered on sustainability and enhanced functionality. Companies are actively developing rings made from 100% recycled content, biodegradable materials, and plant-based polymers. Key innovations include the introduction of rings with reduced material density for lighter weight, improved strength for secure handling, and user-friendly designs for easy removal. For instance, PakTech has pioneered advanced HDPE carrier rings utilizing substantial post-consumer recycled content, offering superior durability and recyclability. E6PR's innovative molded fiber rings made from recycled paperboard provide a fully compostable and biodegradable alternative. These developments offer significant competitive advantages by aligning with eco-conscious consumer demands and regulatory pressures.
Key Drivers of Beverage Carrier Rings Growth
The growth of the beverage carrier rings market is propelled by several converging factors. Growing environmental awareness and consumer demand for sustainable packaging are paramount. Government regulations and initiatives promoting waste reduction and the use of recycled materials are significant catalysts. Technological advancements in material science, leading to the development of more eco-friendly and cost-effective carrier rings, are also driving adoption. The expanding market for canned beverages, particularly in the alcohol and soft drink sectors, directly translates to increased demand for carrier rings. Strategic partnerships between packaging manufacturers and beverage companies are fostering innovation and market penetration.
Challenges in the Beverage Carrier Rings Market
Despite strong growth prospects, the beverage carrier rings market faces several challenges. Fluctuations in raw material prices, particularly for recycled plastics, can impact production costs and profitability. Stringent and evolving regulatory landscapes across different regions can create compliance hurdles and necessitate continuous product adaptation. Supply chain disruptions, as witnessed in recent years, can affect the availability of raw materials and finished goods. Intense competition among established players and the emergence of new entrants can lead to pricing pressures and affect market share. Furthermore, consumer perception regarding the environmental impact of plastic, even when recycled, remains a factor, necessitating clear communication and education on the benefits of sustainable carrier ring solutions.
Emerging Opportunities in Beverage Carrier Rings
Emerging opportunities in the beverage carrier rings market are largely driven by a commitment to circular economy principles and technological innovation. The development and widespread adoption of fully compostable and biodegradable carrier rings present a significant growth avenue, catering to a growing segment of environmentally conscious consumers. Strategic partnerships between beverage brands and packaging manufacturers to co-develop customized and sustainable packaging solutions offer substantial potential. Market expansion into developing economies, where environmental awareness is rising and regulations are evolving, represents another key opportunity. Furthermore, advancements in smart packaging technologies, integrating QR codes or other trackable elements into carrier rings, could open up new possibilities for brand engagement and supply chain management.
Leading Players in the Beverage Carrier Rings Sector
- PakTech
- E6PR
- Hi-Cone
- WestRock
- Grip Pak
- Lawson Kegs
- Pak-It-Products
- American Canning
- BevSource
- Lucky Clover Packaging
Key Milestones in Beverage Carrier Rings Industry
- 2019: Increased focus on biodegradable materials for carrier rings, driven by early environmental advocacy.
- 2020: Launch of new lines of 100% recycled content carrier rings by major manufacturers, responding to consumer demand.
- 2021: E6PR gains significant traction with its compostable molded fiber rings, setting a new benchmark for sustainability.
- 2022: Several beverage companies publicly commit to phasing out single-use plastic rings for multi-packs, accelerating market shift.
- 2023: Advancements in material science lead to lighter-weight and more durable carrier rings, reducing material usage.
- 2024: Growing adoption of carrier rings for a wider range of beverage types beyond traditional beer and soft drinks.
- 2025 (Estimated): Expected significant increase in market share for compostable and plant-based carrier ring solutions.
- 2026-2033 (Forecast): Continued innovation in sustainable materials, potential for wider adoption of circular economy models in carrier ring production.
Strategic Outlook for Beverage Carrier Rings Market
The strategic outlook for the beverage carrier rings market is overwhelmingly positive, characterized by continuous innovation and a strong alignment with global sustainability goals. Growth accelerators will stem from the ongoing development and market penetration of advanced eco-friendly materials, including fully compostable and plant-based alternatives. Strategic collaborations between packaging manufacturers, beverage producers, and waste management companies will be crucial for establishing robust circular economy models. Furthermore, market expansion into emerging economies, coupled with evolving regulatory frameworks that favor sustainable packaging, will unlock new growth avenues. The focus on enhancing product functionality, such as improved durability and ease of use, will continue to be a key differentiator for market leaders.
beverage carrier rings Segmentation
-
1. Application
- 1.1. Alcohol Drinks
- 1.2. Soft Drinks
- 1.3. Others
-
2. Types
- 2.1. 4 Pack Rings
- 2.2. 6 Pack Rings
- 2.3. 8 Pack Rings
beverage carrier rings Segmentation By Geography
-
1. North America
- 1.1. United States
- 1.2. Canada
- 1.3. Mexico
-
2. South America
- 2.1. Brazil
- 2.2. Argentina
- 2.3. Rest of South America
-
3. Europe
- 3.1. United Kingdom
- 3.2. Germany
- 3.3. France
- 3.4. Italy
- 3.5. Spain
- 3.6. Russia
- 3.7. Benelux
- 3.8. Nordics
- 3.9. Rest of Europe
-
4. Middle East & Africa
- 4.1. Turkey
- 4.2. Israel
- 4.3. GCC
- 4.4. North Africa
- 4.5. South Africa
- 4.6. Rest of Middle East & Africa
-
5. Asia Pacific
- 5.1. China
- 5.2. India
- 5.3. Japan
- 5.4. South Korea
- 5.5. ASEAN
- 5.6. Oceania
- 5.7. Rest of Asia Pacific
beverage carrier rings Regional Market Share
Geographic Coverage of beverage carrier rings
beverage carrier rings REPORT HIGHLIGHTS
| Aspects | Details |
|---|---|
| Study Period | 2020-2034 |
| Base Year | 2025 |
| Estimated Year | 2026 |
| Forecast Period | 2026-2034 |
| Historical Period | 2020-2025 |
| Growth Rate | CAGR of 4.9% from 2020-2034 |
| Segmentation |
|
Table of Contents
- 1. Introduction
- 1.1. Research Scope
- 1.2. Market Segmentation
- 1.3. Research Methodology
- 1.4. Definitions and Assumptions
- 2. Executive Summary
- 2.1. Introduction
- 3. Market Dynamics
- 3.1. Introduction
- 3.2. Market Drivers
- 3.3. Market Restrains
- 3.4. Market Trends
- 4. Market Factor Analysis
- 4.1. Porters Five Forces
- 4.2. Supply/Value Chain
- 4.3. PESTEL analysis
- 4.4. Market Entropy
- 4.5. Patent/Trademark Analysis
- 5. Global beverage carrier rings Analysis, Insights and Forecast, 2020-2032
- 5.1. Market Analysis, Insights and Forecast - by Application
- 5.1.1. Alcohol Drinks
- 5.1.2. Soft Drinks
- 5.1.3. Others
- 5.2. Market Analysis, Insights and Forecast - by Types
- 5.2.1. 4 Pack Rings
- 5.2.2. 6 Pack Rings
- 5.2.3. 8 Pack Rings
- 5.3. Market Analysis, Insights and Forecast - by Region
- 5.3.1. North America
- 5.3.2. South America
- 5.3.3. Europe
- 5.3.4. Middle East & Africa
- 5.3.5. Asia Pacific
- 5.1. Market Analysis, Insights and Forecast - by Application
- 6. North America beverage carrier rings Analysis, Insights and Forecast, 2020-2032
- 6.1. Market Analysis, Insights and Forecast - by Application
- 6.1.1. Alcohol Drinks
- 6.1.2. Soft Drinks
- 6.1.3. Others
- 6.2. Market Analysis, Insights and Forecast - by Types
- 6.2.1. 4 Pack Rings
- 6.2.2. 6 Pack Rings
- 6.2.3. 8 Pack Rings
- 6.1. Market Analysis, Insights and Forecast - by Application
- 7. South America beverage carrier rings Analysis, Insights and Forecast, 2020-2032
- 7.1. Market Analysis, Insights and Forecast - by Application
- 7.1.1. Alcohol Drinks
- 7.1.2. Soft Drinks
- 7.1.3. Others
- 7.2. Market Analysis, Insights and Forecast - by Types
- 7.2.1. 4 Pack Rings
- 7.2.2. 6 Pack Rings
- 7.2.3. 8 Pack Rings
- 7.1. Market Analysis, Insights and Forecast - by Application
- 8. Europe beverage carrier rings Analysis, Insights and Forecast, 2020-2032
- 8.1. Market Analysis, Insights and Forecast - by Application
- 8.1.1. Alcohol Drinks
- 8.1.2. Soft Drinks
- 8.1.3. Others
- 8.2. Market Analysis, Insights and Forecast - by Types
- 8.2.1. 4 Pack Rings
- 8.2.2. 6 Pack Rings
- 8.2.3. 8 Pack Rings
- 8.1. Market Analysis, Insights and Forecast - by Application
- 9. Middle East & Africa beverage carrier rings Analysis, Insights and Forecast, 2020-2032
- 9.1. Market Analysis, Insights and Forecast - by Application
- 9.1.1. Alcohol Drinks
- 9.1.2. Soft Drinks
- 9.1.3. Others
- 9.2. Market Analysis, Insights and Forecast - by Types
- 9.2.1. 4 Pack Rings
- 9.2.2. 6 Pack Rings
- 9.2.3. 8 Pack Rings
- 9.1. Market Analysis, Insights and Forecast - by Application
- 10. Asia Pacific beverage carrier rings Analysis, Insights and Forecast, 2020-2032
- 10.1. Market Analysis, Insights and Forecast - by Application
- 10.1.1. Alcohol Drinks
- 10.1.2. Soft Drinks
- 10.1.3. Others
- 10.2. Market Analysis, Insights and Forecast - by Types
- 10.2.1. 4 Pack Rings
- 10.2.2. 6 Pack Rings
- 10.2.3. 8 Pack Rings
- 10.1. Market Analysis, Insights and Forecast - by Application
- 11. Competitive Analysis
- 11.1. Global Market Share Analysis 2025
- 11.2. Company Profiles
- 11.2.1 PakTech
- 11.2.1.1. Overview
- 11.2.1.2. Products
- 11.2.1.3. SWOT Analysis
- 11.2.1.4. Recent Developments
- 11.2.1.5. Financials (Based on Availability)
- 11.2.2 E6PR
- 11.2.2.1. Overview
- 11.2.2.2. Products
- 11.2.2.3. SWOT Analysis
- 11.2.2.4. Recent Developments
- 11.2.2.5. Financials (Based on Availability)
- 11.2.3 Hi-Cone
- 11.2.3.1. Overview
- 11.2.3.2. Products
- 11.2.3.3. SWOT Analysis
- 11.2.3.4. Recent Developments
- 11.2.3.5. Financials (Based on Availability)
- 11.2.4 West Rock
- 11.2.4.1. Overview
- 11.2.4.2. Products
- 11.2.4.3. SWOT Analysis
- 11.2.4.4. Recent Developments
- 11.2.4.5. Financials (Based on Availability)
- 11.2.5 Grip Pak
- 11.2.5.1. Overview
- 11.2.5.2. Products
- 11.2.5.3. SWOT Analysis
- 11.2.5.4. Recent Developments
- 11.2.5.5. Financials (Based on Availability)
- 11.2.6 Lawson Kegs
- 11.2.6.1. Overview
- 11.2.6.2. Products
- 11.2.6.3. SWOT Analysis
- 11.2.6.4. Recent Developments
- 11.2.6.5. Financials (Based on Availability)
- 11.2.7 Pak-It-Products
- 11.2.7.1. Overview
- 11.2.7.2. Products
- 11.2.7.3. SWOT Analysis
- 11.2.7.4. Recent Developments
- 11.2.7.5. Financials (Based on Availability)
- 11.2.8 American Canning
- 11.2.8.1. Overview
- 11.2.8.2. Products
- 11.2.8.3. SWOT Analysis
- 11.2.8.4. Recent Developments
- 11.2.8.5. Financials (Based on Availability)
- 11.2.9 BevSource
- 11.2.9.1. Overview
- 11.2.9.2. Products
- 11.2.9.3. SWOT Analysis
- 11.2.9.4. Recent Developments
- 11.2.9.5. Financials (Based on Availability)
- 11.2.10 Lucky Clover Packaging
- 11.2.10.1. Overview
- 11.2.10.2. Products
- 11.2.10.3. SWOT Analysis
- 11.2.10.4. Recent Developments
- 11.2.10.5. Financials (Based on Availability)
- 11.2.1 PakTech
List of Figures
- Figure 1: Global beverage carrier rings Revenue Breakdown (undefined, %) by Region 2025 & 2033
- Figure 2: Global beverage carrier rings Volume Breakdown (K, %) by Region 2025 & 2033
- Figure 3: North America beverage carrier rings Revenue (undefined), by Application 2025 & 2033
- Figure 4: North America beverage carrier rings Volume (K), by Application 2025 & 2033
- Figure 5: North America beverage carrier rings Revenue Share (%), by Application 2025 & 2033
- Figure 6: North America beverage carrier rings Volume Share (%), by Application 2025 & 2033
- Figure 7: North America beverage carrier rings Revenue (undefined), by Types 2025 & 2033
- Figure 8: North America beverage carrier rings Volume (K), by Types 2025 & 2033
- Figure 9: North America beverage carrier rings Revenue Share (%), by Types 2025 & 2033
- Figure 10: North America beverage carrier rings Volume Share (%), by Types 2025 & 2033
- Figure 11: North America beverage carrier rings Revenue (undefined), by Country 2025 & 2033
- Figure 12: North America beverage carrier rings Volume (K), by Country 2025 & 2033
- Figure 13: North America beverage carrier rings Revenue Share (%), by Country 2025 & 2033
- Figure 14: North America beverage carrier rings Volume Share (%), by Country 2025 & 2033
- Figure 15: South America beverage carrier rings Revenue (undefined), by Application 2025 & 2033
- Figure 16: South America beverage carrier rings Volume (K), by Application 2025 & 2033
- Figure 17: South America beverage carrier rings Revenue Share (%), by Application 2025 & 2033
- Figure 18: South America beverage carrier rings Volume Share (%), by Application 2025 & 2033
- Figure 19: South America beverage carrier rings Revenue (undefined), by Types 2025 & 2033
- Figure 20: South America beverage carrier rings Volume (K), by Types 2025 & 2033
- Figure 21: South America beverage carrier rings Revenue Share (%), by Types 2025 & 2033
- Figure 22: South America beverage carrier rings Volume Share (%), by Types 2025 & 2033
- Figure 23: South America beverage carrier rings Revenue (undefined), by Country 2025 & 2033
- Figure 24: South America beverage carrier rings Volume (K), by Country 2025 & 2033
- Figure 25: South America beverage carrier rings Revenue Share (%), by Country 2025 & 2033
- Figure 26: South America beverage carrier rings Volume Share (%), by Country 2025 & 2033
- Figure 27: Europe beverage carrier rings Revenue (undefined), by Application 2025 & 2033
- Figure 28: Europe beverage carrier rings Volume (K), by Application 2025 & 2033
- Figure 29: Europe beverage carrier rings Revenue Share (%), by Application 2025 & 2033
- Figure 30: Europe beverage carrier rings Volume Share (%), by Application 2025 & 2033
- Figure 31: Europe beverage carrier rings Revenue (undefined), by Types 2025 & 2033
- Figure 32: Europe beverage carrier rings Volume (K), by Types 2025 & 2033
- Figure 33: Europe beverage carrier rings Revenue Share (%), by Types 2025 & 2033
- Figure 34: Europe beverage carrier rings Volume Share (%), by Types 2025 & 2033
- Figure 35: Europe beverage carrier rings Revenue (undefined), by Country 2025 & 2033
- Figure 36: Europe beverage carrier rings Volume (K), by Country 2025 & 2033
- Figure 37: Europe beverage carrier rings Revenue Share (%), by Country 2025 & 2033
- Figure 38: Europe beverage carrier rings Volume Share (%), by Country 2025 & 2033
- Figure 39: Middle East & Africa beverage carrier rings Revenue (undefined), by Application 2025 & 2033
- Figure 40: Middle East & Africa beverage carrier rings Volume (K), by Application 2025 & 2033
- Figure 41: Middle East & Africa beverage carrier rings Revenue Share (%), by Application 2025 & 2033
- Figure 42: Middle East & Africa beverage carrier rings Volume Share (%), by Application 2025 & 2033
- Figure 43: Middle East & Africa beverage carrier rings Revenue (undefined), by Types 2025 & 2033
- Figure 44: Middle East & Africa beverage carrier rings Volume (K), by Types 2025 & 2033
- Figure 45: Middle East & Africa beverage carrier rings Revenue Share (%), by Types 2025 & 2033
- Figure 46: Middle East & Africa beverage carrier rings Volume Share (%), by Types 2025 & 2033
- Figure 47: Middle East & Africa beverage carrier rings Revenue (undefined), by Country 2025 & 2033
- Figure 48: Middle East & Africa beverage carrier rings Volume (K), by Country 2025 & 2033
- Figure 49: Middle East & Africa beverage carrier rings Revenue Share (%), by Country 2025 & 2033
- Figure 50: Middle East & Africa beverage carrier rings Volume Share (%), by Country 2025 & 2033
- Figure 51: Asia Pacific beverage carrier rings Revenue (undefined), by Application 2025 & 2033
- Figure 52: Asia Pacific beverage carrier rings Volume (K), by Application 2025 & 2033
- Figure 53: Asia Pacific beverage carrier rings Revenue Share (%), by Application 2025 & 2033
- Figure 54: Asia Pacific beverage carrier rings Volume Share (%), by Application 2025 & 2033
- Figure 55: Asia Pacific beverage carrier rings Revenue (undefined), by Types 2025 & 2033
- Figure 56: Asia Pacific beverage carrier rings Volume (K), by Types 2025 & 2033
- Figure 57: Asia Pacific beverage carrier rings Revenue Share (%), by Types 2025 & 2033
- Figure 58: Asia Pacific beverage carrier rings Volume Share (%), by Types 2025 & 2033
- Figure 59: Asia Pacific beverage carrier rings Revenue (undefined), by Country 2025 & 2033
- Figure 60: Asia Pacific beverage carrier rings Volume (K), by Country 2025 & 2033
- Figure 61: Asia Pacific beverage carrier rings Revenue Share (%), by Country 2025 & 2033
- Figure 62: Asia Pacific beverage carrier rings Volume Share (%), by Country 2025 & 2033
List of Tables
- Table 1: Global beverage carrier rings Revenue undefined Forecast, by Application 2020 & 2033
- Table 2: Global beverage carrier rings Volume K Forecast, by Application 2020 & 2033
- Table 3: Global beverage carrier rings Revenue undefined Forecast, by Types 2020 & 2033
- Table 4: Global beverage carrier rings Volume K Forecast, by Types 2020 & 2033
- Table 5: Global beverage carrier rings Revenue undefined Forecast, by Region 2020 & 2033
- Table 6: Global beverage carrier rings Volume K Forecast, by Region 2020 & 2033
- Table 7: Global beverage carrier rings Revenue undefined Forecast, by Application 2020 & 2033
- Table 8: Global beverage carrier rings Volume K Forecast, by Application 2020 & 2033
- Table 9: Global beverage carrier rings Revenue undefined Forecast, by Types 2020 & 2033
- Table 10: Global beverage carrier rings Volume K Forecast, by Types 2020 & 2033
- Table 11: Global beverage carrier rings Revenue undefined Forecast, by Country 2020 & 2033
- Table 12: Global beverage carrier rings Volume K Forecast, by Country 2020 & 2033
- Table 13: United States beverage carrier rings Revenue (undefined) Forecast, by Application 2020 & 2033
- Table 14: United States beverage carrier rings Volume (K) Forecast, by Application 2020 & 2033
- Table 15: Canada beverage carrier rings Revenue (undefined) Forecast, by Application 2020 & 2033
- Table 16: Canada beverage carrier rings Volume (K) Forecast, by Application 2020 & 2033
- Table 17: Mexico beverage carrier rings Revenue (undefined) Forecast, by Application 2020 & 2033
- Table 18: Mexico beverage carrier rings Volume (K) Forecast, by Application 2020 & 2033
- Table 19: Global beverage carrier rings Revenue undefined Forecast, by Application 2020 & 2033
- Table 20: Global beverage carrier rings Volume K Forecast, by Application 2020 & 2033
- Table 21: Global beverage carrier rings Revenue undefined Forecast, by Types 2020 & 2033
- Table 22: Global beverage carrier rings Volume K Forecast, by Types 2020 & 2033
- Table 23: Global beverage carrier rings Revenue undefined Forecast, by Country 2020 & 2033
- Table 24: Global beverage carrier rings Volume K Forecast, by Country 2020 & 2033
- Table 25: Brazil beverage carrier rings Revenue (undefined) Forecast, by Application 2020 & 2033
- Table 26: Brazil beverage carrier rings Volume (K) Forecast, by Application 2020 & 2033
- Table 27: Argentina beverage carrier rings Revenue (undefined) Forecast, by Application 2020 & 2033
- Table 28: Argentina beverage carrier rings Volume (K) Forecast, by Application 2020 & 2033
- Table 29: Rest of South America beverage carrier rings Revenue (undefined) Forecast, by Application 2020 & 2033
- Table 30: Rest of South America beverage carrier rings Volume (K) Forecast, by Application 2020 & 2033
- Table 31: Global beverage carrier rings Revenue undefined Forecast, by Application 2020 & 2033
- Table 32: Global beverage carrier rings Volume K Forecast, by Application 2020 & 2033
- Table 33: Global beverage carrier rings Revenue undefined Forecast, by Types 2020 & 2033
- Table 34: Global beverage carrier rings Volume K Forecast, by Types 2020 & 2033
- Table 35: Global beverage carrier rings Revenue undefined Forecast, by Country 2020 & 2033
- Table 36: Global beverage carrier rings Volume K Forecast, by Country 2020 & 2033
- Table 37: United Kingdom beverage carrier rings Revenue (undefined) Forecast, by Application 2020 & 2033
- Table 38: United Kingdom beverage carrier rings Volume (K) Forecast, by Application 2020 & 2033
- Table 39: Germany beverage carrier rings Revenue (undefined) Forecast, by Application 2020 & 2033
- Table 40: Germany beverage carrier rings Volume (K) Forecast, by Application 2020 & 2033
- Table 41: France beverage carrier rings Revenue (undefined) Forecast, by Application 2020 & 2033
- Table 42: France beverage carrier rings Volume (K) Forecast, by Application 2020 & 2033
- Table 43: Italy beverage carrier rings Revenue (undefined) Forecast, by Application 2020 & 2033
- Table 44: Italy beverage carrier rings Volume (K) Forecast, by Application 2020 & 2033
- Table 45: Spain beverage carrier rings Revenue (undefined) Forecast, by Application 2020 & 2033
- Table 46: Spain beverage carrier rings Volume (K) Forecast, by Application 2020 & 2033
- Table 47: Russia beverage carrier rings Revenue (undefined) Forecast, by Application 2020 & 2033
- Table 48: Russia beverage carrier rings Volume (K) Forecast, by Application 2020 & 2033
- Table 49: Benelux beverage carrier rings Revenue (undefined) Forecast, by Application 2020 & 2033
- Table 50: Benelux beverage carrier rings Volume (K) Forecast, by Application 2020 & 2033
- Table 51: Nordics beverage carrier rings Revenue (undefined) Forecast, by Application 2020 & 2033
- Table 52: Nordics beverage carrier rings Volume (K) Forecast, by Application 2020 & 2033
- Table 53: Rest of Europe beverage carrier rings Revenue (undefined) Forecast, by Application 2020 & 2033
- Table 54: Rest of Europe beverage carrier rings Volume (K) Forecast, by Application 2020 & 2033
- Table 55: Global beverage carrier rings Revenue undefined Forecast, by Application 2020 & 2033
- Table 56: Global beverage carrier rings Volume K Forecast, by Application 2020 & 2033
- Table 57: Global beverage carrier rings Revenue undefined Forecast, by Types 2020 & 2033
- Table 58: Global beverage carrier rings Volume K Forecast, by Types 2020 & 2033
- Table 59: Global beverage carrier rings Revenue undefined Forecast, by Country 2020 & 2033
- Table 60: Global beverage carrier rings Volume K Forecast, by Country 2020 & 2033
- Table 61: Turkey beverage carrier rings Revenue (undefined) Forecast, by Application 2020 & 2033
- Table 62: Turkey beverage carrier rings Volume (K) Forecast, by Application 2020 & 2033
- Table 63: Israel beverage carrier rings Revenue (undefined) Forecast, by Application 2020 & 2033
- Table 64: Israel beverage carrier rings Volume (K) Forecast, by Application 2020 & 2033
- Table 65: GCC beverage carrier rings Revenue (undefined) Forecast, by Application 2020 & 2033
- Table 66: GCC beverage carrier rings Volume (K) Forecast, by Application 2020 & 2033
- Table 67: North Africa beverage carrier rings Revenue (undefined) Forecast, by Application 2020 & 2033
- Table 68: North Africa beverage carrier rings Volume (K) Forecast, by Application 2020 & 2033
- Table 69: South Africa beverage carrier rings Revenue (undefined) Forecast, by Application 2020 & 2033
- Table 70: South Africa beverage carrier rings Volume (K) Forecast, by Application 2020 & 2033
- Table 71: Rest of Middle East & Africa beverage carrier rings Revenue (undefined) Forecast, by Application 2020 & 2033
- Table 72: Rest of Middle East & Africa beverage carrier rings Volume (K) Forecast, by Application 2020 & 2033
- Table 73: Global beverage carrier rings Revenue undefined Forecast, by Application 2020 & 2033
- Table 74: Global beverage carrier rings Volume K Forecast, by Application 2020 & 2033
- Table 75: Global beverage carrier rings Revenue undefined Forecast, by Types 2020 & 2033
- Table 76: Global beverage carrier rings Volume K Forecast, by Types 2020 & 2033
- Table 77: Global beverage carrier rings Revenue undefined Forecast, by Country 2020 & 2033
- Table 78: Global beverage carrier rings Volume K Forecast, by Country 2020 & 2033
- Table 79: China beverage carrier rings Revenue (undefined) Forecast, by Application 2020 & 2033
- Table 80: China beverage carrier rings Volume (K) Forecast, by Application 2020 & 2033
- Table 81: India beverage carrier rings Revenue (undefined) Forecast, by Application 2020 & 2033
- Table 82: India beverage carrier rings Volume (K) Forecast, by Application 2020 & 2033
- Table 83: Japan beverage carrier rings Revenue (undefined) Forecast, by Application 2020 & 2033
- Table 84: Japan beverage carrier rings Volume (K) Forecast, by Application 2020 & 2033
- Table 85: South Korea beverage carrier rings Revenue (undefined) Forecast, by Application 2020 & 2033
- Table 86: South Korea beverage carrier rings Volume (K) Forecast, by Application 2020 & 2033
- Table 87: ASEAN beverage carrier rings Revenue (undefined) Forecast, by Application 2020 & 2033
- Table 88: ASEAN beverage carrier rings Volume (K) Forecast, by Application 2020 & 2033
- Table 89: Oceania beverage carrier rings Revenue (undefined) Forecast, by Application 2020 & 2033
- Table 90: Oceania beverage carrier rings Volume (K) Forecast, by Application 2020 & 2033
- Table 91: Rest of Asia Pacific beverage carrier rings Revenue (undefined) Forecast, by Application 2020 & 2033
- Table 92: Rest of Asia Pacific beverage carrier rings Volume (K) Forecast, by Application 2020 & 2033
Frequently Asked Questions
1. What is the projected Compound Annual Growth Rate (CAGR) of the beverage carrier rings?
The projected CAGR is approximately 4.9%.
2. Which companies are prominent players in the beverage carrier rings?
Key companies in the market include PakTech, E6PR, Hi-Cone, West Rock, Grip Pak, Lawson Kegs, Pak-It-Products, American Canning, BevSource, Lucky Clover Packaging.
3. What are the main segments of the beverage carrier rings?
The market segments include Application, Types.
4. Can you provide details about the market size?
The market size is estimated to be USD XXX N/A as of 2022.
5. What are some drivers contributing to market growth?
N/A
6. What are the notable trends driving market growth?
N/A
7. Are there any restraints impacting market growth?
N/A
8. Can you provide examples of recent developments in the market?
N/A
9. What pricing options are available for accessing the report?
Pricing options include single-user, multi-user, and enterprise licenses priced at USD 4350.00, USD 6525.00, and USD 8700.00 respectively.
10. Is the market size provided in terms of value or volume?
The market size is provided in terms of value, measured in N/A and volume, measured in K.
11. Are there any specific market keywords associated with the report?
Yes, the market keyword associated with the report is "beverage carrier rings," which aids in identifying and referencing the specific market segment covered.
12. How do I determine which pricing option suits my needs best?
The pricing options vary based on user requirements and access needs. Individual users may opt for single-user licenses, while businesses requiring broader access may choose multi-user or enterprise licenses for cost-effective access to the report.
13. Are there any additional resources or data provided in the beverage carrier rings report?
While the report offers comprehensive insights, it's advisable to review the specific contents or supplementary materials provided to ascertain if additional resources or data are available.
14. How can I stay updated on further developments or reports in the beverage carrier rings?
To stay informed about further developments, trends, and reports in the beverage carrier rings, consider subscribing to industry newsletters, following relevant companies and organizations, or regularly checking reputable industry news sources and publications.
Methodology
Step 1 - Identification of Relevant Samples Size from Population Database


Step 2 - Approaches for Defining Global Market Size (Value, Volume* & Price*)

Note*: In applicable scenarios
Step 3 - Data Sources
Primary Research
- Web Analytics
- Survey Reports
- Research Institute
- Latest Research Reports
- Opinion Leaders
Secondary Research
- Annual Reports
- White Paper
- Latest Press Release
- Industry Association
- Paid Database
- Investor Presentations

Step 4 - Data Triangulation
Involves using different sources of information in order to increase the validity of a study
These sources are likely to be stakeholders in a program - participants, other researchers, program staff, other community members, and so on.
Then we put all data in single framework & apply various statistical tools to find out the dynamic on the market.
During the analysis stage, feedback from the stakeholder groups would be compared to determine areas of agreement as well as areas of divergence