

Key Insights
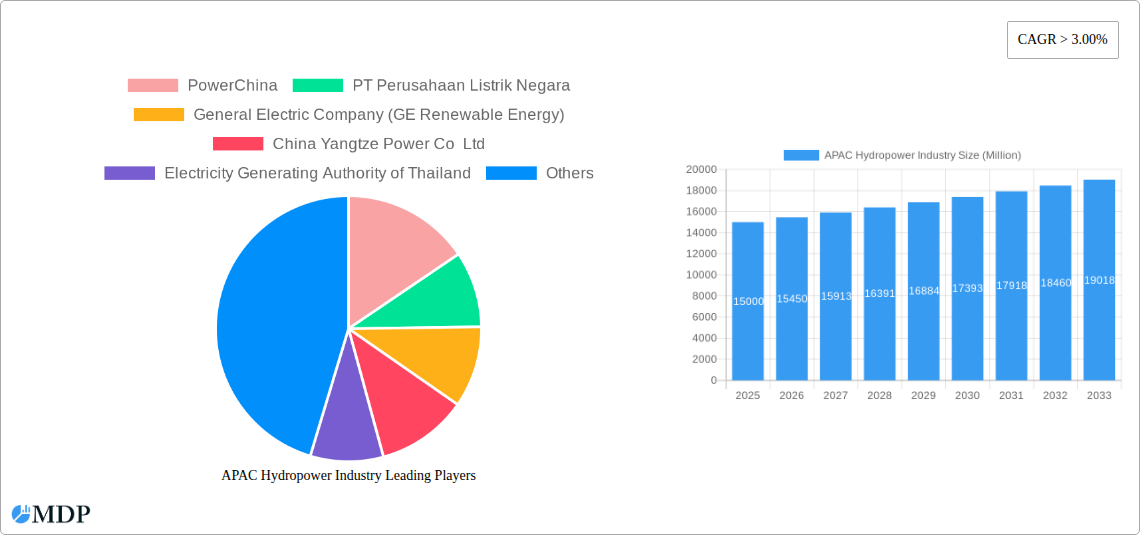
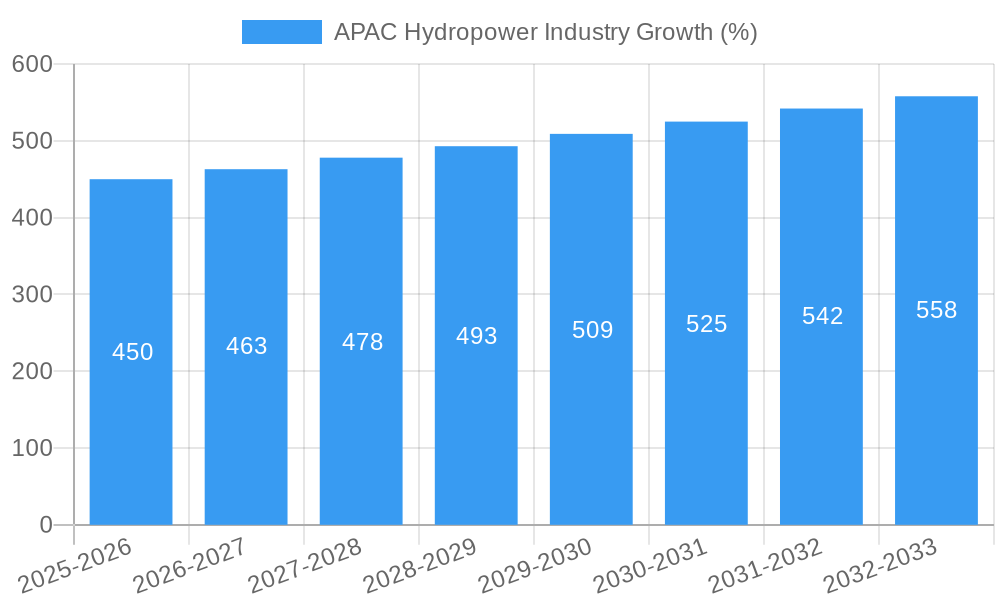
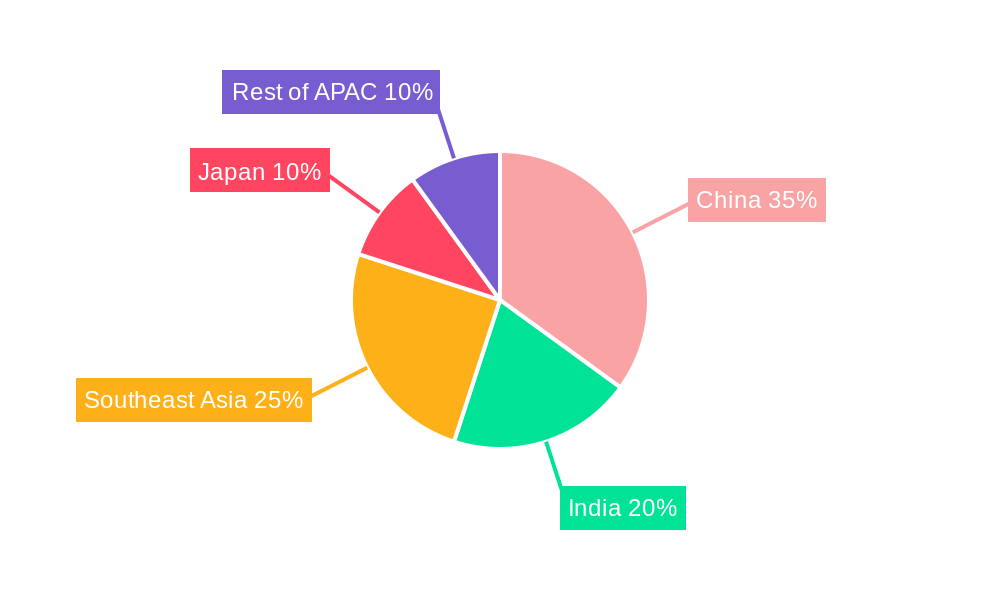
The Asia-Pacific (APAC) hydropower market exhibits robust growth, driven by increasing energy demands, government initiatives promoting renewable energy sources, and the region's abundant hydropower resources. A CAGR exceeding 3% indicates a steadily expanding market, projected to reach significant value by 2033. Large hydropower projects continue to dominate the market segment due to their substantial energy generation capacity. However, small hydropower projects are gaining traction, particularly in geographically diverse regions with limited grid access, offering decentralized energy solutions. Key players like PowerChina, PT Perusahaan Listrik Negara, and General Electric are heavily invested, fostering competition and innovation. While the market faces challenges such as high initial investment costs, environmental concerns, and potential regulatory hurdles, these are being mitigated through technological advancements (e.g., improved turbine efficiency, reduced environmental impact assessments), supportive government policies, and a growing awareness of climate change's impact. China, India, and Southeast Asia represent the largest market segments within APAC, fueled by their expanding economies and energy requirements. The forecast period of 2025-2033 will likely see a significant increase in the integration of smart grids and improved energy storage solutions to enhance the reliability and efficiency of hydropower generation.
Growth in the APAC hydropower market is further influenced by factors like sustainable development goals, increasing urbanization, and the shift away from fossil fuels. The industry is actively exploring opportunities to leverage technological advancements and improve grid infrastructure. While challenges remain, particularly related to securing financing for large-scale projects and navigating complex regulatory landscapes, the long-term prospects for the APAC hydropower market remain positive. Countries like Japan and South Korea, while possessing established hydropower infrastructure, continue to invest in upgrades and modernization to improve efficiency and sustainability. This combination of existing capacity and ongoing development ensures sustained growth throughout the forecast period, supported by continued governmental support and the region's substantial untapped hydropower potential.
APAC Hydropower Industry: Market Report 2019-2033
Unlocking the Potential of Asia-Pacific's Hydropower Market: A Comprehensive Analysis and Forecast (2019-2033)
This comprehensive report provides an in-depth analysis of the Asia-Pacific (APAC) hydropower industry, encompassing market dynamics, leading players, technological advancements, and future growth prospects. With a focus on the period 2019-2033 (Base Year: 2025), this report is an essential resource for industry stakeholders, investors, and policymakers seeking to understand and capitalize on the opportunities within this dynamic sector. The report analyzes the market size across different segments – Large Hydropower, Small Hydropower, and Other Sizes – and projects a xx Million USD market value by 2033, showcasing a significant Compound Annual Growth Rate (CAGR) of xx%.
APAC Hydropower Industry Market Dynamics & Concentration
This section analyzes the competitive landscape, regulatory environment, and market trends within the APAC hydropower industry. Market concentration is assessed through analysis of market share held by key players like PowerChina, PT Perusahaan Listrik Negara, and others. The report also examines innovation drivers, including technological advancements in turbine design and energy storage, alongside regulatory frameworks impacting project development and approvals across various APAC nations. Furthermore, the influence of product substitutes (e.g., solar, wind), end-user trends (e.g., increasing demand for renewable energy), and mergers & acquisitions (M&A) activity are thoroughly explored.
- Market Share: PowerChina holds an estimated xx% market share, followed by PT Perusahaan Listrik Negara with xx%, and other key players such as General Electric Company (GE Renewable Energy), China Yangtze Power Co Ltd, and Electricity Generating Authority of Thailand each commanding significant, though smaller, shares of the market.
- M&A Activity: The report details xx M&A deals recorded in the historical period (2019-2024), indicating a dynamic landscape of consolidation and expansion within the industry. The forecast period (2025-2033) is projected to see an increase in M&A activity, driven by xx.
APAC Hydropower Industry Industry Trends & Analysis
This section delves into the key drivers propelling the growth of the APAC hydropower market. Factors like increasing energy demand, supportive government policies promoting renewable energy, and the rising awareness of climate change are all considered. Technological disruptions, such as the development of more efficient hydropower turbines and improved grid integration technologies, are examined in detail. The report analyzes evolving consumer preferences towards sustainable energy sources, influencing investment decisions and project development. Furthermore, the competitive dynamics between established players and emerging entrants shape the market landscape, which is assessed through a detailed analysis of strategies, market penetration, and competitive advantages.
The APAC hydropower market is expected to experience robust growth, driven by a combination of factors. These include the increasing demand for electricity across rapidly developing economies within the region and government initiatives aimed at reducing carbon emissions and increasing the share of renewable energy in the energy mix. The market is expected to grow at a CAGR of xx% from 2025 to 2033, exceeding a market size of xx Million USD by the end of the forecast period.
Leading Markets & Segments in APAC Hydropower Industry
This section identifies the dominant regions, countries, and segments within the APAC hydropower industry. Analysis includes a detailed breakdown of the market share for Large Hydropower, Small Hydropower, and Other Sizes, along with the key drivers behind each segment’s performance.
- Dominant Region/Country: China is identified as the dominant market for hydropower in the APAC region.
- Key Drivers for Large Hydropower:
- Significant government investment in large-scale hydropower projects.
- Abundance of suitable geographical locations for large dam construction.
- Economies of scale, leading to cost-effective power generation.
- Key Drivers for Small Hydropower:
- Decentralized power generation capabilities, enabling access to electricity in remote areas.
- Lower environmental impact compared to large hydropower projects.
- Government incentives and support for small-scale renewable energy projects.
- Dominance Analysis: China's dominance stems from substantial investments in infrastructure and the existing large-scale projects already operational. However, other nations are witnessing a rise in small hydropower installations, driven by government support and growing environmental concerns.
APAC Hydropower Industry Product Developments
Recent advancements in hydropower technology focus on increasing efficiency and reducing environmental impact. Innovations include more efficient turbine designs, improved energy storage solutions, and advanced grid integration technologies. These developments enhance the competitiveness of hydropower by lowering costs and mitigating environmental concerns. The market is witnessing an increased focus on smaller, modular hydropower systems that are easier to deploy in diverse geographical locations.
Key Drivers of APAC Hydropower Industry Growth
Several factors contribute to the growth of the APAC hydropower industry. Government policies promoting renewable energy are critical, with many nations setting ambitious targets for renewable energy integration into their energy mix. The increasing demand for electricity, driven by rapid economic growth and population expansion across the APAC region, fuels further investment. Technological advancements, resulting in cost reductions and increased efficiency, are also significant drivers of growth.
Challenges in the APAC Hydropower Industry Market
The APAC hydropower industry faces several challenges. Environmental concerns related to dam construction and ecological impacts represent significant hurdles. Regulatory complexities and lengthy approval processes for project development can delay implementations. Furthermore, competition from other renewable energy sources, such as solar and wind power, pose a challenge for market share. Supply chain disruptions, particularly in the procurement of critical components for hydropower projects, can impact project timelines and costs. The overall impact of these challenges is a reduction in project ROI and potential delays in overall project implementation.
Emerging Opportunities in APAC Hydropower Industry
Long-term growth prospects for the APAC hydropower industry are promising. Advancements in pumped hydro storage technology enable greater grid stability and address intermittency issues. Strategic partnerships between technology providers and project developers facilitate innovation and reduce development risks. Expanding into untapped markets across the region, with a focus on smaller-scale projects, offers significant opportunities for growth.
Leading Players in the APAC Hydropower Industry Sector
- PowerChina
- PT Perusahaan Listrik Negara
- General Electric Company (GE Renewable Energy)
- China Yangtze Power Co Ltd
- Electricity Generating Authority of Thailand
- Aboitiz Power Corporation
- NTPC Limited
- NHPC Ltd
- Tenaga Nasional Berhad
- Tokyo Electric Power Company Holdings Inc
Key Milestones in APAC Hydropower Industry Industry
- July 2022: The Development Bank of the Philippines (DBP) approved USD 11.7 Million in funding for the 4.6 MW Dupinga Mini Hydropower project, supporting the country's renewable energy goals.
- March 2022: ANDRITZ and the Electricity Generating Authority of Thailand (EGAT) signed a Memorandum of Understanding (MoU) to explore hydropower project opportunities in Thailand and surrounding countries.
Strategic Outlook for APAC Hydropower Industry Market
The APAC hydropower industry is poised for sustained growth, driven by increasing energy demand, supportive government policies, and technological advancements. Strategic opportunities lie in optimizing project development processes, enhancing grid integration capabilities, and exploring innovative financing mechanisms. Focus on sustainable and environmentally friendly practices will be crucial for long-term success in this sector. The market's future potential is significant, with continuous expansion expected across various segments and geographies within the APAC region.
APAC Hydropower Industry Segmentation
-
1. Size
- 1.1. Large Hydropower
- 1.2. Small Hydropower
- 1.3. Other Sizes
-
2. Geography
- 2.1. China
- 2.2. India
- 2.3. Japan
- 2.4. Vietnam
- 2.5. Rest of Asia-Pacific
APAC Hydropower Industry Segmentation By Geography
- 1. China
- 2. India
- 3. Japan
- 4. Vietnam
- 5. Rest of Asia Pacific
APAC Hydropower Industry REPORT HIGHLIGHTS
| Aspects | Details |
|---|---|
| Study Period | 2019-2033 |
| Base Year | 2024 |
| Estimated Year | 2025 |
| Forecast Period | 2025-2033 |
| Historical Period | 2019-2024 |
| Growth Rate | CAGR of > 3.00% from 2019-2033 |
| Segmentation |
|
Table of Contents
- 1. Introduction
- 1.1. Research Scope
- 1.2. Market Segmentation
- 1.3. Research Methodology
- 1.4. Definitions and Assumptions
- 2. Executive Summary
- 2.1. Introduction
- 3. Market Dynamics
- 3.1. Introduction
- 3.2. Market Drivers
- 3.2.1. 4.; Increasing Power Generation Capacity Plans and Increasing Electricity Demand4.; Rapidly Growing Industrial and Infrastructural Development Activities
- 3.3. Market Restrains
- 3.3.1. 4.; Coal Substituted with Clean Energy Sources
- 3.4. Market Trends
- 3.4.1. Small Hydropower Segment Anticipated to Dominate the Market During the Forecast Period
- 4. Market Factor Analysis
- 4.1. Porters Five Forces
- 4.2. Supply/Value Chain
- 4.3. PESTEL analysis
- 4.4. Market Entropy
- 4.5. Patent/Trademark Analysis
- 5. Global APAC Hydropower Industry Analysis, Insights and Forecast, 2019-2031
- 5.1. Market Analysis, Insights and Forecast - by Size
- 5.1.1. Large Hydropower
- 5.1.2. Small Hydropower
- 5.1.3. Other Sizes
- 5.2. Market Analysis, Insights and Forecast - by Geography
- 5.2.1. China
- 5.2.2. India
- 5.2.3. Japan
- 5.2.4. Vietnam
- 5.2.5. Rest of Asia-Pacific
- 5.3. Market Analysis, Insights and Forecast - by Region
- 5.3.1. China
- 5.3.2. India
- 5.3.3. Japan
- 5.3.4. Vietnam
- 5.3.5. Rest of Asia Pacific
- 5.1. Market Analysis, Insights and Forecast - by Size
- 6. China APAC Hydropower Industry Analysis, Insights and Forecast, 2019-2031
- 6.1. Market Analysis, Insights and Forecast - by Size
- 6.1.1. Large Hydropower
- 6.1.2. Small Hydropower
- 6.1.3. Other Sizes
- 6.2. Market Analysis, Insights and Forecast - by Geography
- 6.2.1. China
- 6.2.2. India
- 6.2.3. Japan
- 6.2.4. Vietnam
- 6.2.5. Rest of Asia-Pacific
- 6.1. Market Analysis, Insights and Forecast - by Size
- 7. India APAC Hydropower Industry Analysis, Insights and Forecast, 2019-2031
- 7.1. Market Analysis, Insights and Forecast - by Size
- 7.1.1. Large Hydropower
- 7.1.2. Small Hydropower
- 7.1.3. Other Sizes
- 7.2. Market Analysis, Insights and Forecast - by Geography
- 7.2.1. China
- 7.2.2. India
- 7.2.3. Japan
- 7.2.4. Vietnam
- 7.2.5. Rest of Asia-Pacific
- 7.1. Market Analysis, Insights and Forecast - by Size
- 8. Japan APAC Hydropower Industry Analysis, Insights and Forecast, 2019-2031
- 8.1. Market Analysis, Insights and Forecast - by Size
- 8.1.1. Large Hydropower
- 8.1.2. Small Hydropower
- 8.1.3. Other Sizes
- 8.2. Market Analysis, Insights and Forecast - by Geography
- 8.2.1. China
- 8.2.2. India
- 8.2.3. Japan
- 8.2.4. Vietnam
- 8.2.5. Rest of Asia-Pacific
- 8.1. Market Analysis, Insights and Forecast - by Size
- 9. Vietnam APAC Hydropower Industry Analysis, Insights and Forecast, 2019-2031
- 9.1. Market Analysis, Insights and Forecast - by Size
- 9.1.1. Large Hydropower
- 9.1.2. Small Hydropower
- 9.1.3. Other Sizes
- 9.2. Market Analysis, Insights and Forecast - by Geography
- 9.2.1. China
- 9.2.2. India
- 9.2.3. Japan
- 9.2.4. Vietnam
- 9.2.5. Rest of Asia-Pacific
- 9.1. Market Analysis, Insights and Forecast - by Size
- 10. Rest of Asia Pacific APAC Hydropower Industry Analysis, Insights and Forecast, 2019-2031
- 10.1. Market Analysis, Insights and Forecast - by Size
- 10.1.1. Large Hydropower
- 10.1.2. Small Hydropower
- 10.1.3. Other Sizes
- 10.2. Market Analysis, Insights and Forecast - by Geography
- 10.2.1. China
- 10.2.2. India
- 10.2.3. Japan
- 10.2.4. Vietnam
- 10.2.5. Rest of Asia-Pacific
- 10.1. Market Analysis, Insights and Forecast - by Size
- 11. China APAC Hydropower Industry Analysis, Insights and Forecast, 2019-2031
- 12. Japan APAC Hydropower Industry Analysis, Insights and Forecast, 2019-2031
- 13. India APAC Hydropower Industry Analysis, Insights and Forecast, 2019-2031
- 14. South Korea APAC Hydropower Industry Analysis, Insights and Forecast, 2019-2031
- 15. Southeast Asia APAC Hydropower Industry Analysis, Insights and Forecast, 2019-2031
- 16. Australia APAC Hydropower Industry Analysis, Insights and Forecast, 2019-2031
- 17. Indonesia APAC Hydropower Industry Analysis, Insights and Forecast, 2019-2031
- 18. Phillipes APAC Hydropower Industry Analysis, Insights and Forecast, 2019-2031
- 19. Singapore APAC Hydropower Industry Analysis, Insights and Forecast, 2019-2031
- 20. Thailandc APAC Hydropower Industry Analysis, Insights and Forecast, 2019-2031
- 21. Rest of Asia Pacific APAC Hydropower Industry Analysis, Insights and Forecast, 2019-2031
- 22. Competitive Analysis
- 22.1. Global Market Share Analysis 2024
- 22.2. Company Profiles
- 22.2.1 PowerChina
- 22.2.1.1. Overview
- 22.2.1.2. Products
- 22.2.1.3. SWOT Analysis
- 22.2.1.4. Recent Developments
- 22.2.1.5. Financials (Based on Availability)
- 22.2.2 PT Perusahaan Listrik Negara
- 22.2.2.1. Overview
- 22.2.2.2. Products
- 22.2.2.3. SWOT Analysis
- 22.2.2.4. Recent Developments
- 22.2.2.5. Financials (Based on Availability)
- 22.2.3 General Electric Company (GE Renewable Energy)
- 22.2.3.1. Overview
- 22.2.3.2. Products
- 22.2.3.3. SWOT Analysis
- 22.2.3.4. Recent Developments
- 22.2.3.5. Financials (Based on Availability)
- 22.2.4 China Yangtze Power Co Ltd
- 22.2.4.1. Overview
- 22.2.4.2. Products
- 22.2.4.3. SWOT Analysis
- 22.2.4.4. Recent Developments
- 22.2.4.5. Financials (Based on Availability)
- 22.2.5 Electricity Generating Authority of Thailand
- 22.2.5.1. Overview
- 22.2.5.2. Products
- 22.2.5.3. SWOT Analysis
- 22.2.5.4. Recent Developments
- 22.2.5.5. Financials (Based on Availability)
- 22.2.6 Aboitiz Power Corporation
- 22.2.6.1. Overview
- 22.2.6.2. Products
- 22.2.6.3. SWOT Analysis
- 22.2.6.4. Recent Developments
- 22.2.6.5. Financials (Based on Availability)
- 22.2.7 NTPC Limited
- 22.2.7.1. Overview
- 22.2.7.2. Products
- 22.2.7.3. SWOT Analysis
- 22.2.7.4. Recent Developments
- 22.2.7.5. Financials (Based on Availability)
- 22.2.8 NHPC Ltd
- 22.2.8.1. Overview
- 22.2.8.2. Products
- 22.2.8.3. SWOT Analysis
- 22.2.8.4. Recent Developments
- 22.2.8.5. Financials (Based on Availability)
- 22.2.9 Tenaga Nasional Berhad
- 22.2.9.1. Overview
- 22.2.9.2. Products
- 22.2.9.3. SWOT Analysis
- 22.2.9.4. Recent Developments
- 22.2.9.5. Financials (Based on Availability)
- 22.2.10 Tokyo Electric Power Company Holdings Inc
- 22.2.10.1. Overview
- 22.2.10.2. Products
- 22.2.10.3. SWOT Analysis
- 22.2.10.4. Recent Developments
- 22.2.10.5. Financials (Based on Availability)
- 22.2.1 PowerChina
List of Figures
- Figure 1: Global APAC Hydropower Industry Revenue Breakdown (Million, %) by Region 2024 & 2032
- Figure 2: Global APAC Hydropower Industry Volume Breakdown (terawatt, %) by Region 2024 & 2032
- Figure 3: Asia Pacific APAC Hydropower Industry Revenue (Million), by Country 2024 & 2032
- Figure 4: Asia Pacific APAC Hydropower Industry Volume (terawatt), by Country 2024 & 2032
- Figure 5: Asia Pacific APAC Hydropower Industry Revenue Share (%), by Country 2024 & 2032
- Figure 6: Asia Pacific APAC Hydropower Industry Volume Share (%), by Country 2024 & 2032
- Figure 7: China APAC Hydropower Industry Revenue (Million), by Size 2024 & 2032
- Figure 8: China APAC Hydropower Industry Volume (terawatt), by Size 2024 & 2032
- Figure 9: China APAC Hydropower Industry Revenue Share (%), by Size 2024 & 2032
- Figure 10: China APAC Hydropower Industry Volume Share (%), by Size 2024 & 2032
- Figure 11: China APAC Hydropower Industry Revenue (Million), by Geography 2024 & 2032
- Figure 12: China APAC Hydropower Industry Volume (terawatt), by Geography 2024 & 2032
- Figure 13: China APAC Hydropower Industry Revenue Share (%), by Geography 2024 & 2032
- Figure 14: China APAC Hydropower Industry Volume Share (%), by Geography 2024 & 2032
- Figure 15: China APAC Hydropower Industry Revenue (Million), by Country 2024 & 2032
- Figure 16: China APAC Hydropower Industry Volume (terawatt), by Country 2024 & 2032
- Figure 17: China APAC Hydropower Industry Revenue Share (%), by Country 2024 & 2032
- Figure 18: China APAC Hydropower Industry Volume Share (%), by Country 2024 & 2032
- Figure 19: India APAC Hydropower Industry Revenue (Million), by Size 2024 & 2032
- Figure 20: India APAC Hydropower Industry Volume (terawatt), by Size 2024 & 2032
- Figure 21: India APAC Hydropower Industry Revenue Share (%), by Size 2024 & 2032
- Figure 22: India APAC Hydropower Industry Volume Share (%), by Size 2024 & 2032
- Figure 23: India APAC Hydropower Industry Revenue (Million), by Geography 2024 & 2032
- Figure 24: India APAC Hydropower Industry Volume (terawatt), by Geography 2024 & 2032
- Figure 25: India APAC Hydropower Industry Revenue Share (%), by Geography 2024 & 2032
- Figure 26: India APAC Hydropower Industry Volume Share (%), by Geography 2024 & 2032
- Figure 27: India APAC Hydropower Industry Revenue (Million), by Country 2024 & 2032
- Figure 28: India APAC Hydropower Industry Volume (terawatt), by Country 2024 & 2032
- Figure 29: India APAC Hydropower Industry Revenue Share (%), by Country 2024 & 2032
- Figure 30: India APAC Hydropower Industry Volume Share (%), by Country 2024 & 2032
- Figure 31: Japan APAC Hydropower Industry Revenue (Million), by Size 2024 & 2032
- Figure 32: Japan APAC Hydropower Industry Volume (terawatt), by Size 2024 & 2032
- Figure 33: Japan APAC Hydropower Industry Revenue Share (%), by Size 2024 & 2032
- Figure 34: Japan APAC Hydropower Industry Volume Share (%), by Size 2024 & 2032
- Figure 35: Japan APAC Hydropower Industry Revenue (Million), by Geography 2024 & 2032
- Figure 36: Japan APAC Hydropower Industry Volume (terawatt), by Geography 2024 & 2032
- Figure 37: Japan APAC Hydropower Industry Revenue Share (%), by Geography 2024 & 2032
- Figure 38: Japan APAC Hydropower Industry Volume Share (%), by Geography 2024 & 2032
- Figure 39: Japan APAC Hydropower Industry Revenue (Million), by Country 2024 & 2032
- Figure 40: Japan APAC Hydropower Industry Volume (terawatt), by Country 2024 & 2032
- Figure 41: Japan APAC Hydropower Industry Revenue Share (%), by Country 2024 & 2032
- Figure 42: Japan APAC Hydropower Industry Volume Share (%), by Country 2024 & 2032
- Figure 43: Vietnam APAC Hydropower Industry Revenue (Million), by Size 2024 & 2032
- Figure 44: Vietnam APAC Hydropower Industry Volume (terawatt), by Size 2024 & 2032
- Figure 45: Vietnam APAC Hydropower Industry Revenue Share (%), by Size 2024 & 2032
- Figure 46: Vietnam APAC Hydropower Industry Volume Share (%), by Size 2024 & 2032
- Figure 47: Vietnam APAC Hydropower Industry Revenue (Million), by Geography 2024 & 2032
- Figure 48: Vietnam APAC Hydropower Industry Volume (terawatt), by Geography 2024 & 2032
- Figure 49: Vietnam APAC Hydropower Industry Revenue Share (%), by Geography 2024 & 2032
- Figure 50: Vietnam APAC Hydropower Industry Volume Share (%), by Geography 2024 & 2032
- Figure 51: Vietnam APAC Hydropower Industry Revenue (Million), by Country 2024 & 2032
- Figure 52: Vietnam APAC Hydropower Industry Volume (terawatt), by Country 2024 & 2032
- Figure 53: Vietnam APAC Hydropower Industry Revenue Share (%), by Country 2024 & 2032
- Figure 54: Vietnam APAC Hydropower Industry Volume Share (%), by Country 2024 & 2032
- Figure 55: Rest of Asia Pacific APAC Hydropower Industry Revenue (Million), by Size 2024 & 2032
- Figure 56: Rest of Asia Pacific APAC Hydropower Industry Volume (terawatt), by Size 2024 & 2032
- Figure 57: Rest of Asia Pacific APAC Hydropower Industry Revenue Share (%), by Size 2024 & 2032
- Figure 58: Rest of Asia Pacific APAC Hydropower Industry Volume Share (%), by Size 2024 & 2032
- Figure 59: Rest of Asia Pacific APAC Hydropower Industry Revenue (Million), by Geography 2024 & 2032
- Figure 60: Rest of Asia Pacific APAC Hydropower Industry Volume (terawatt), by Geography 2024 & 2032
- Figure 61: Rest of Asia Pacific APAC Hydropower Industry Revenue Share (%), by Geography 2024 & 2032
- Figure 62: Rest of Asia Pacific APAC Hydropower Industry Volume Share (%), by Geography 2024 & 2032
- Figure 63: Rest of Asia Pacific APAC Hydropower Industry Revenue (Million), by Country 2024 & 2032
- Figure 64: Rest of Asia Pacific APAC Hydropower Industry Volume (terawatt), by Country 2024 & 2032
- Figure 65: Rest of Asia Pacific APAC Hydropower Industry Revenue Share (%), by Country 2024 & 2032
- Figure 66: Rest of Asia Pacific APAC Hydropower Industry Volume Share (%), by Country 2024 & 2032
List of Tables
- Table 1: Global APAC Hydropower Industry Revenue Million Forecast, by Region 2019 & 2032
- Table 2: Global APAC Hydropower Industry Volume terawatt Forecast, by Region 2019 & 2032
- Table 3: Global APAC Hydropower Industry Revenue Million Forecast, by Size 2019 & 2032
- Table 4: Global APAC Hydropower Industry Volume terawatt Forecast, by Size 2019 & 2032
- Table 5: Global APAC Hydropower Industry Revenue Million Forecast, by Geography 2019 & 2032
- Table 6: Global APAC Hydropower Industry Volume terawatt Forecast, by Geography 2019 & 2032
- Table 7: Global APAC Hydropower Industry Revenue Million Forecast, by Region 2019 & 2032
- Table 8: Global APAC Hydropower Industry Volume terawatt Forecast, by Region 2019 & 2032
- Table 9: Global APAC Hydropower Industry Revenue Million Forecast, by Country 2019 & 2032
- Table 10: Global APAC Hydropower Industry Volume terawatt Forecast, by Country 2019 & 2032
- Table 11: China APAC Hydropower Industry Revenue (Million) Forecast, by Application 2019 & 2032
- Table 12: China APAC Hydropower Industry Volume (terawatt) Forecast, by Application 2019 & 2032
- Table 13: Japan APAC Hydropower Industry Revenue (Million) Forecast, by Application 2019 & 2032
- Table 14: Japan APAC Hydropower Industry Volume (terawatt) Forecast, by Application 2019 & 2032
- Table 15: India APAC Hydropower Industry Revenue (Million) Forecast, by Application 2019 & 2032
- Table 16: India APAC Hydropower Industry Volume (terawatt) Forecast, by Application 2019 & 2032
- Table 17: South Korea APAC Hydropower Industry Revenue (Million) Forecast, by Application 2019 & 2032
- Table 18: South Korea APAC Hydropower Industry Volume (terawatt) Forecast, by Application 2019 & 2032
- Table 19: Southeast Asia APAC Hydropower Industry Revenue (Million) Forecast, by Application 2019 & 2032
- Table 20: Southeast Asia APAC Hydropower Industry Volume (terawatt) Forecast, by Application 2019 & 2032
- Table 21: Australia APAC Hydropower Industry Revenue (Million) Forecast, by Application 2019 & 2032
- Table 22: Australia APAC Hydropower Industry Volume (terawatt) Forecast, by Application 2019 & 2032
- Table 23: Indonesia APAC Hydropower Industry Revenue (Million) Forecast, by Application 2019 & 2032
- Table 24: Indonesia APAC Hydropower Industry Volume (terawatt) Forecast, by Application 2019 & 2032
- Table 25: Phillipes APAC Hydropower Industry Revenue (Million) Forecast, by Application 2019 & 2032
- Table 26: Phillipes APAC Hydropower Industry Volume (terawatt) Forecast, by Application 2019 & 2032
- Table 27: Singapore APAC Hydropower Industry Revenue (Million) Forecast, by Application 2019 & 2032
- Table 28: Singapore APAC Hydropower Industry Volume (terawatt) Forecast, by Application 2019 & 2032
- Table 29: Thailandc APAC Hydropower Industry Revenue (Million) Forecast, by Application 2019 & 2032
- Table 30: Thailandc APAC Hydropower Industry Volume (terawatt) Forecast, by Application 2019 & 2032
- Table 31: Rest of Asia Pacific APAC Hydropower Industry Revenue (Million) Forecast, by Application 2019 & 2032
- Table 32: Rest of Asia Pacific APAC Hydropower Industry Volume (terawatt) Forecast, by Application 2019 & 2032
- Table 33: Global APAC Hydropower Industry Revenue Million Forecast, by Size 2019 & 2032
- Table 34: Global APAC Hydropower Industry Volume terawatt Forecast, by Size 2019 & 2032
- Table 35: Global APAC Hydropower Industry Revenue Million Forecast, by Geography 2019 & 2032
- Table 36: Global APAC Hydropower Industry Volume terawatt Forecast, by Geography 2019 & 2032
- Table 37: Global APAC Hydropower Industry Revenue Million Forecast, by Country 2019 & 2032
- Table 38: Global APAC Hydropower Industry Volume terawatt Forecast, by Country 2019 & 2032
- Table 39: Global APAC Hydropower Industry Revenue Million Forecast, by Size 2019 & 2032
- Table 40: Global APAC Hydropower Industry Volume terawatt Forecast, by Size 2019 & 2032
- Table 41: Global APAC Hydropower Industry Revenue Million Forecast, by Geography 2019 & 2032
- Table 42: Global APAC Hydropower Industry Volume terawatt Forecast, by Geography 2019 & 2032
- Table 43: Global APAC Hydropower Industry Revenue Million Forecast, by Country 2019 & 2032
- Table 44: Global APAC Hydropower Industry Volume terawatt Forecast, by Country 2019 & 2032
- Table 45: Global APAC Hydropower Industry Revenue Million Forecast, by Size 2019 & 2032
- Table 46: Global APAC Hydropower Industry Volume terawatt Forecast, by Size 2019 & 2032
- Table 47: Global APAC Hydropower Industry Revenue Million Forecast, by Geography 2019 & 2032
- Table 48: Global APAC Hydropower Industry Volume terawatt Forecast, by Geography 2019 & 2032
- Table 49: Global APAC Hydropower Industry Revenue Million Forecast, by Country 2019 & 2032
- Table 50: Global APAC Hydropower Industry Volume terawatt Forecast, by Country 2019 & 2032
- Table 51: Global APAC Hydropower Industry Revenue Million Forecast, by Size 2019 & 2032
- Table 52: Global APAC Hydropower Industry Volume terawatt Forecast, by Size 2019 & 2032
- Table 53: Global APAC Hydropower Industry Revenue Million Forecast, by Geography 2019 & 2032
- Table 54: Global APAC Hydropower Industry Volume terawatt Forecast, by Geography 2019 & 2032
- Table 55: Global APAC Hydropower Industry Revenue Million Forecast, by Country 2019 & 2032
- Table 56: Global APAC Hydropower Industry Volume terawatt Forecast, by Country 2019 & 2032
- Table 57: Global APAC Hydropower Industry Revenue Million Forecast, by Size 2019 & 2032
- Table 58: Global APAC Hydropower Industry Volume terawatt Forecast, by Size 2019 & 2032
- Table 59: Global APAC Hydropower Industry Revenue Million Forecast, by Geography 2019 & 2032
- Table 60: Global APAC Hydropower Industry Volume terawatt Forecast, by Geography 2019 & 2032
- Table 61: Global APAC Hydropower Industry Revenue Million Forecast, by Country 2019 & 2032
- Table 62: Global APAC Hydropower Industry Volume terawatt Forecast, by Country 2019 & 2032
Frequently Asked Questions
1. What is the projected Compound Annual Growth Rate (CAGR) of the APAC Hydropower Industry?
The projected CAGR is approximately > 3.00%.
2. Which companies are prominent players in the APAC Hydropower Industry?
Key companies in the market include PowerChina, PT Perusahaan Listrik Negara, General Electric Company (GE Renewable Energy), China Yangtze Power Co Ltd, Electricity Generating Authority of Thailand, Aboitiz Power Corporation, NTPC Limited, NHPC Ltd, Tenaga Nasional Berhad, Tokyo Electric Power Company Holdings Inc.
3. What are the main segments of the APAC Hydropower Industry?
The market segments include Size, Geography.
4. Can you provide details about the market size?
The market size is estimated to be USD XX Million as of 2022.
5. What are some drivers contributing to market growth?
4.; Increasing Power Generation Capacity Plans and Increasing Electricity Demand4.; Rapidly Growing Industrial and Infrastructural Development Activities.
6. What are the notable trends driving market growth?
Small Hydropower Segment Anticipated to Dominate the Market During the Forecast Period.
7. Are there any restraints impacting market growth?
4.; Coal Substituted with Clean Energy Sources.
8. Can you provide examples of recent developments in the market?
In July 2022, the Development Bank of the Philippines (DBP) approved USD 11.7 million in funding to support the development of the 4.6 MW Dupinga Mini Hydropower project in Gabaldon, Nueva Ecija, in the Philippines. The DBP's financing of the Dupinga Project will help the government reach its 30% renewable energy goal by 2030.
9. What pricing options are available for accessing the report?
Pricing options include single-user, multi-user, and enterprise licenses priced at USD 4750, USD 5250, and USD 8750 respectively.
10. Is the market size provided in terms of value or volume?
The market size is provided in terms of value, measured in Million and volume, measured in terawatt.
11. Are there any specific market keywords associated with the report?
Yes, the market keyword associated with the report is "APAC Hydropower Industry," which aids in identifying and referencing the specific market segment covered.
12. How do I determine which pricing option suits my needs best?
The pricing options vary based on user requirements and access needs. Individual users may opt for single-user licenses, while businesses requiring broader access may choose multi-user or enterprise licenses for cost-effective access to the report.
13. Are there any additional resources or data provided in the APAC Hydropower Industry report?
While the report offers comprehensive insights, it's advisable to review the specific contents or supplementary materials provided to ascertain if additional resources or data are available.
14. How can I stay updated on further developments or reports in the APAC Hydropower Industry?
To stay informed about further developments, trends, and reports in the APAC Hydropower Industry, consider subscribing to industry newsletters, following relevant companies and organizations, or regularly checking reputable industry news sources and publications.
Methodology
Step 1 - Identification of Relevant Samples Size from Population Database


Step 2 - Approaches for Defining Global Market Size (Value, Volume* & Price*)

Note*: In applicable scenarios
Step 3 - Data Sources
Primary Research
- Web Analytics
- Survey Reports
- Research Institute
- Latest Research Reports
- Opinion Leaders
Secondary Research
- Annual Reports
- White Paper
- Latest Press Release
- Industry Association
- Paid Database
- Investor Presentations

Step 4 - Data Triangulation
Involves using different sources of information in order to increase the validity of a study
These sources are likely to be stakeholders in a program - participants, other researchers, program staff, other community members, and so on.
Then we put all data in single framework & apply various statistical tools to find out the dynamic on the market.
During the analysis stage, feedback from the stakeholder groups would be compared to determine areas of agreement as well as areas of divergence
