

Key Insights
The global vehicle active purge pump market is experiencing robust expansion, projected to reach USD 129.79 million by 2025, with an impressive Compound Annual Growth Rate (CAGR) of 33.6% anticipated throughout the forecast period of 2025-2033. This significant growth is primarily driven by the increasing stringent automotive emission regulations worldwide. Governments and environmental agencies are mandating stricter control over evaporative emissions from vehicles, necessitating the adoption of advanced technologies like active purge pumps. These pumps play a crucial role in the Evaporative Emission Control (EVAP) system by effectively managing and purging fuel vapors from the charcoal canister into the engine for combustion, thereby reducing hydrocarbon emissions into the atmosphere. The escalating demand for passenger vehicles, coupled with the growing adoption of commercial vehicles with advanced EVAP systems, further fuels market expansion. Technological advancements, including the development of more efficient, durable, and cost-effective active purge pumps, are also contributing to market dynamism. Companies are investing in research and development to enhance pump performance, reduce power consumption, and integrate smart features, aligning with the evolving needs of the automotive industry.
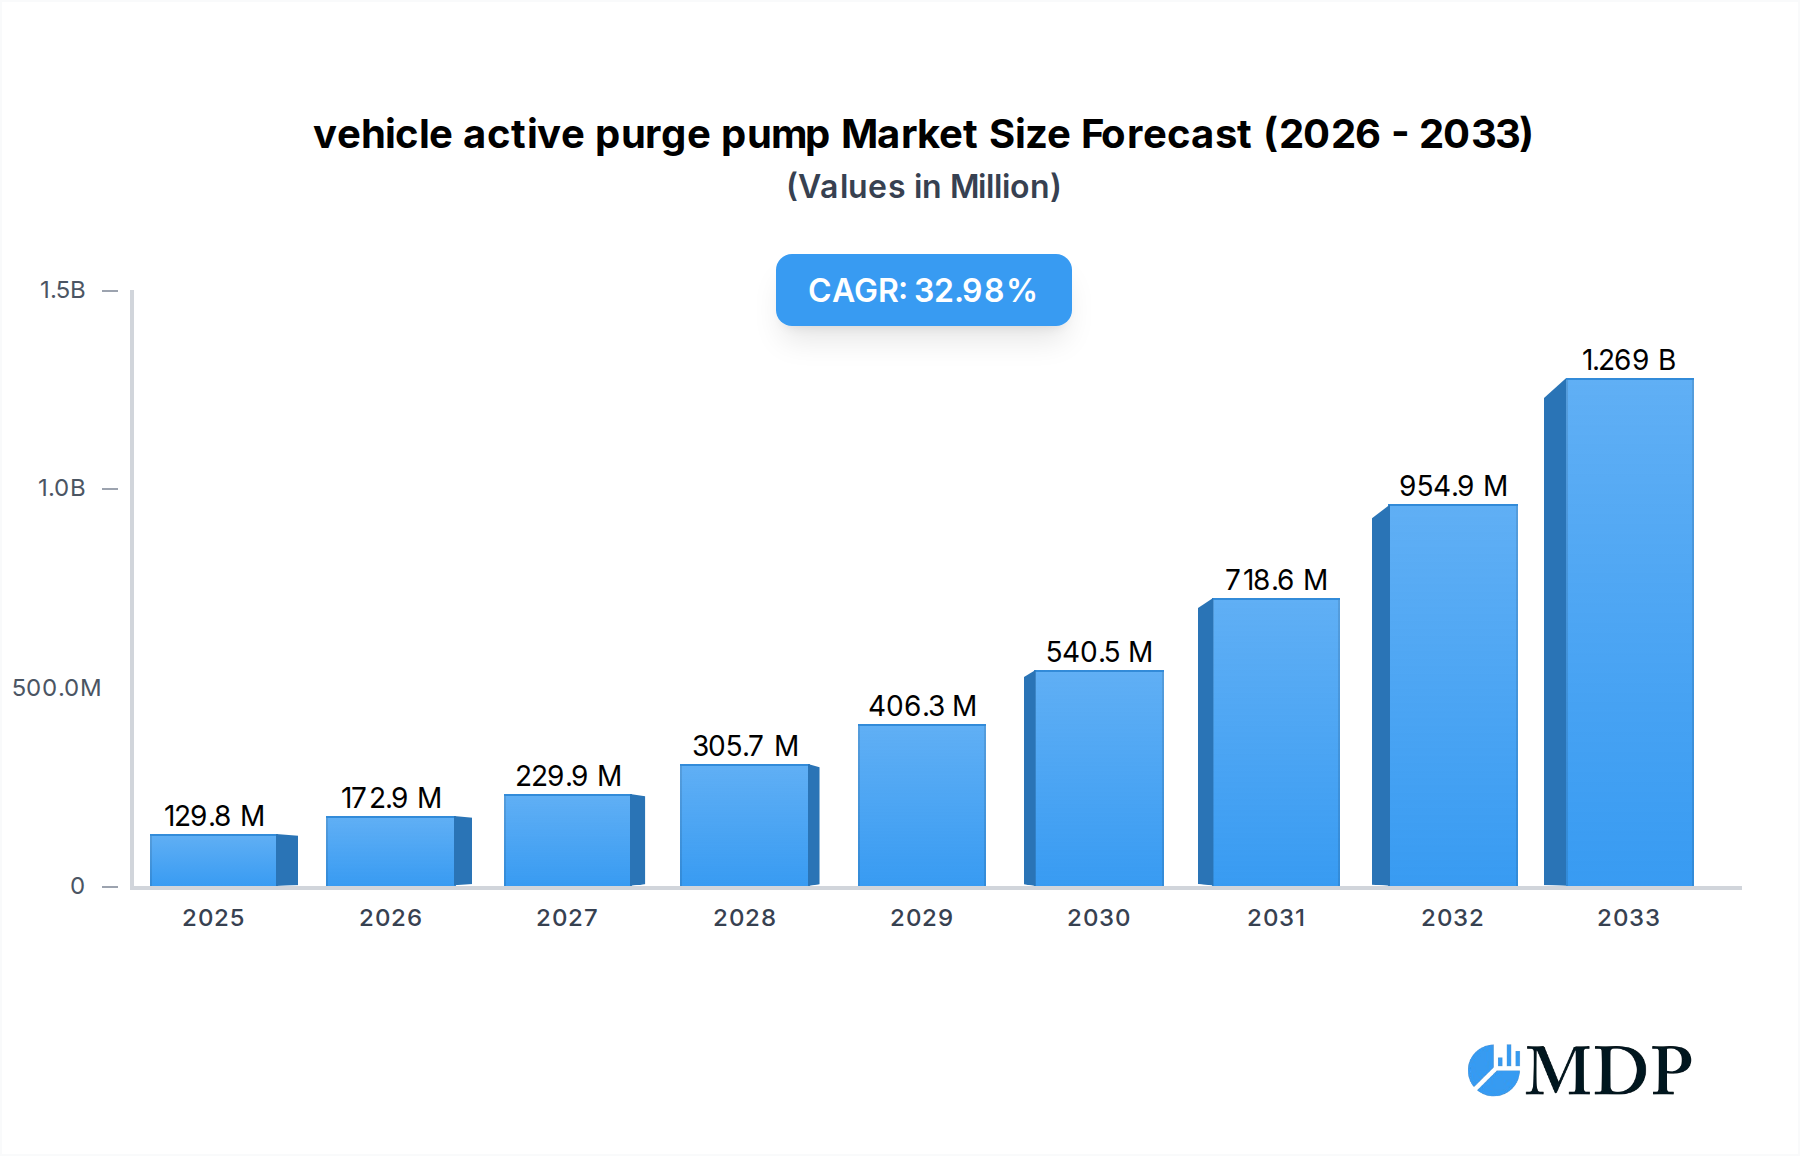
vehicle active purge pump Market Size (In Million)
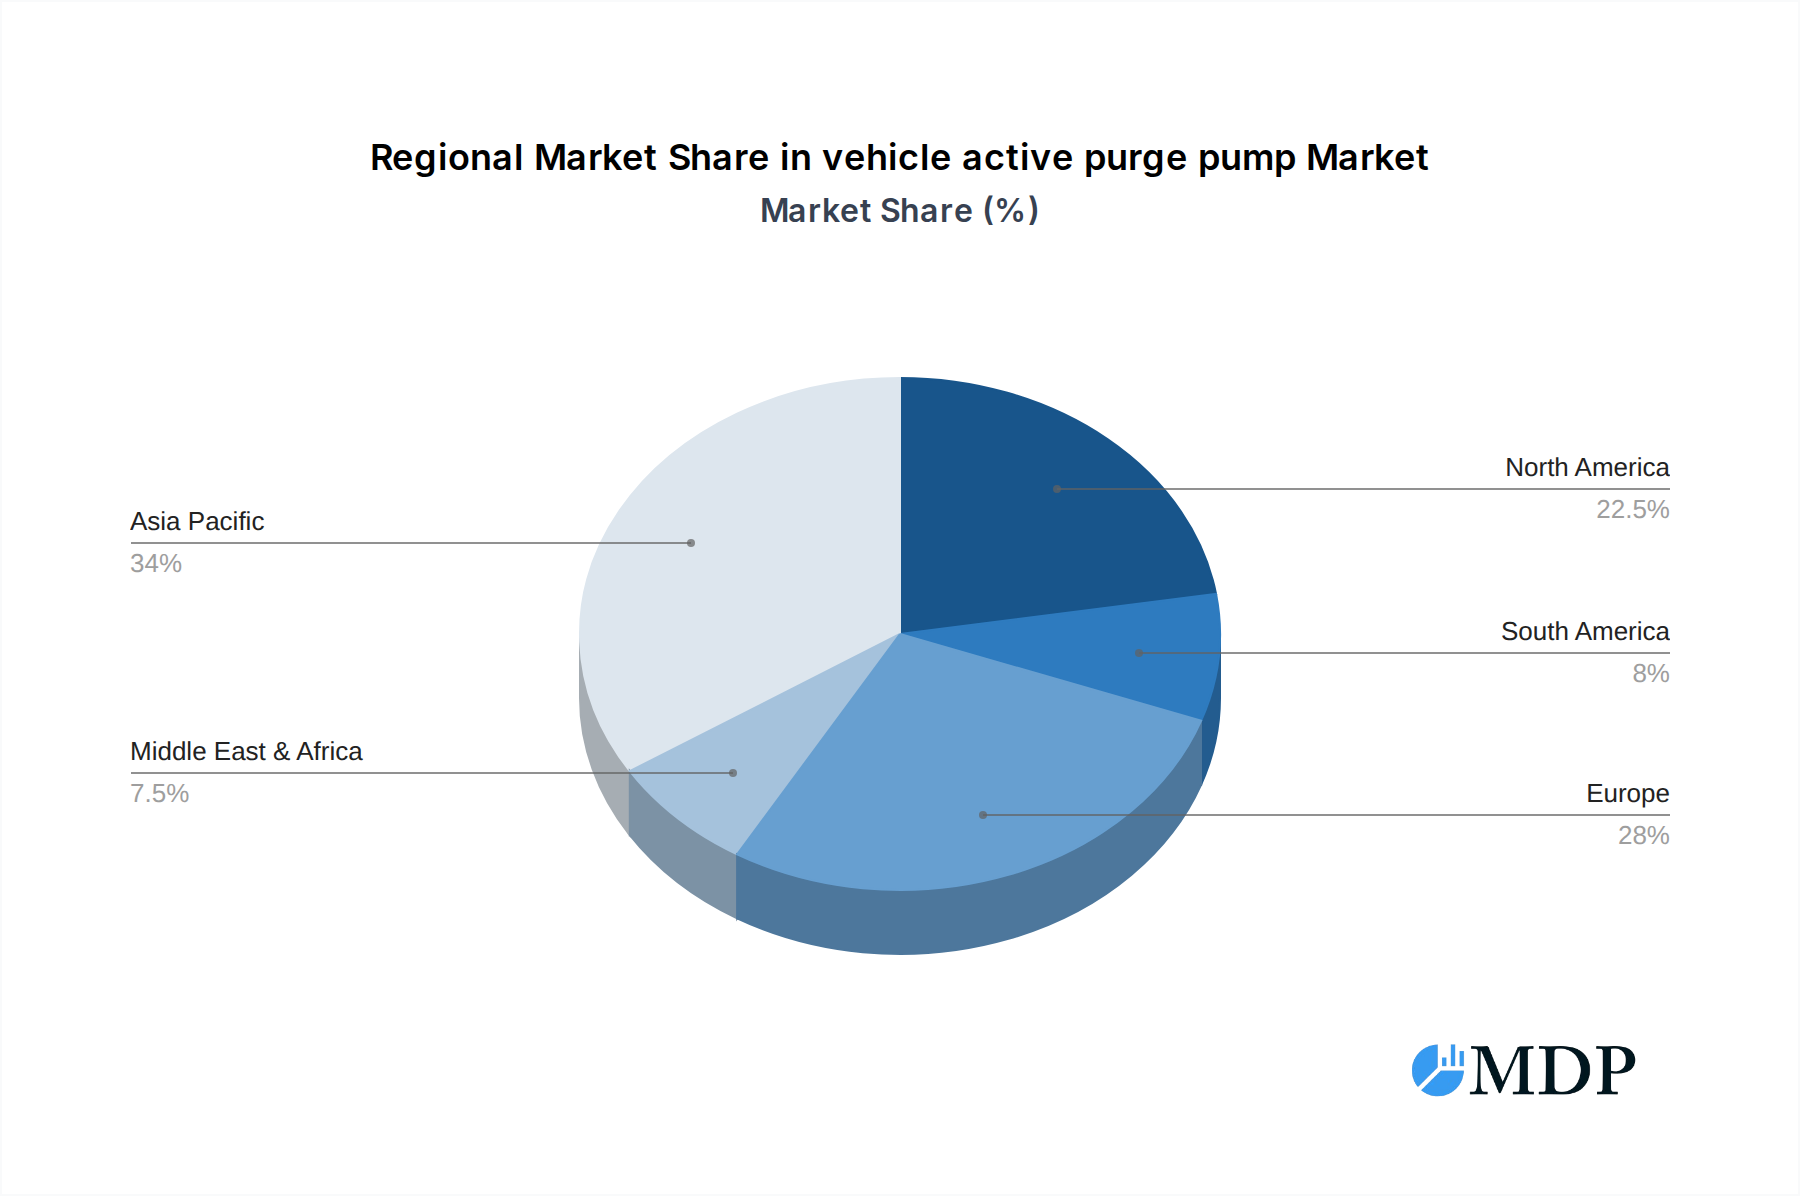
The market segmentation reveals a balanced demand across different vehicle types, with both passenger and commercial vehicles contributing significantly to the overall market size. In terms of pump technology, both metal and non-metal pumps are finding widespread application, with ongoing innovation likely to see shifts in preference based on performance, cost, and durability considerations. Geographically, Asia Pacific is emerging as a dominant region, driven by its massive automotive production and consumption, particularly in countries like China and India, which are rapidly adopting advanced emission control technologies. North America and Europe, with their well-established automotive industries and stringent environmental policies, also represent substantial markets. Key industry players such as Continental, Robert Bosch, and Denso Corporation are actively engaged in product innovation, strategic collaborations, and market expansion to capitalize on the burgeoning opportunities within this dynamic sector. The market is characterized by intense competition, necessitating continuous adaptation to technological advancements and evolving regulatory landscapes.

vehicle active purge pump Company Market Share
Global Vehicle Active Purge Pump Market Insights: Dynamics, Trends, and Future Outlook (2019-2033)
This comprehensive report offers an in-depth analysis of the global vehicle active purge pump market, examining key dynamics, emerging trends, leading segments, and strategic opportunities. With a study period spanning from 2019 to 2033, including a base year of 2025 and a forecast period of 2025-2033, this report provides actionable intelligence for industry stakeholders. We leverage high-traffic keywords such as "automotive EVAP system," "emission control pumps," "fuel vapor recovery," and "auto component market" to maximize search visibility. This report is designed for immediate use without modification.
vehicle active purge pump Market Dynamics & Concentration
The vehicle active purge pump market exhibits a moderate to high concentration, with key players like Continental, Robert Bosch, and Denso Corporation holding significant market share, estimated to be over 70% collectively. Innovation drivers are primarily fueled by increasingly stringent emission regulations worldwide, pushing for more efficient and reliable EVAP (Evaporative Emission Control) systems. Regulatory frameworks, such as Euro 7 and EPA standards, are mandating lower hydrocarbon emissions, directly impacting the demand for advanced active purge pumps. Product substitutes, while limited in their direct functionality, include passive systems that are gradually being phased out due to performance limitations. End-user trends indicate a growing preference for lightweight, durable, and energy-efficient components in both passenger and commercial vehicles. Mergers and acquisitions (M&A) activities, while not exceptionally high in volume, have been strategic, focusing on consolidating technological expertise and expanding geographical reach. For instance, recent M&A deal counts hover around 10-15 per year, with deal values often in the hundreds of million. The market is characterized by a continuous effort to improve pump performance, reduce energy consumption, and enhance system longevity.
vehicle active purge pump Industry Trends & Analysis
The vehicle active purge pump industry is experiencing robust growth driven by several interconnected trends. The primary growth driver remains the global push for reduced automotive emissions. As environmental regulations tighten, manufacturers are compelled to integrate advanced EVAP systems, with active purge pumps playing a crucial role in efficiently managing fuel vapors and preventing their release into the atmosphere. The compound annual growth rate (CAGR) for this segment is projected to be between 7% and 9% over the forecast period. Technological disruptions are a significant factor, with advancements in materials science leading to the development of more durable and lightweight non-metal pumps, offering a competitive edge over traditional metal variants. The increasing adoption of gasoline direct injection (GDI) engines also necessitates more sophisticated EVAP systems due to higher fuel evaporation rates. Consumer preferences are indirectly influenced by environmental awareness and the desire for vehicles that meet stringent emission standards, thereby indirectly boosting demand for these critical components. Competitive dynamics are intensifying, with established players investing heavily in research and development to enhance pump efficiency, reduce noise, and improve overall system integration. Market penetration of active purge pumps is already high in developed regions, with steady growth expected in emerging economies as emission standards evolve. The integration of smart technologies and advanced diagnostics within EVAP systems is also a noteworthy trend, enabling real-time monitoring and predictive maintenance. The market is valued in the billions, with current estimates for 2025 exceeding 1,500 million USD.
Leading Markets & Segments in vehicle active purge pump
The Passenger Vehicle segment represents the dominant market within the vehicle active purge pump industry, accounting for over 80% of the total market share. This dominance is driven by the sheer volume of passenger cars produced globally, coupled with increasingly stringent emission regulations specifically targeting this segment in major automotive markets like North America, Europe, and Asia-Pacific. Within this segment, Metal Pumps currently hold a substantial market share due to their proven durability and performance characteristics, though Non-Metal Pumps are rapidly gaining traction due to their lighter weight and potential cost efficiencies.
Asia-Pacific emerges as the leading geographical region for vehicle active purge pumps. Key drivers include:
- Robust Automotive Production: China, Japan, South Korea, and India are massive hubs for automotive manufacturing, producing millions of passenger and commercial vehicles annually.
- Evolving Emission Standards: Many Asian countries are progressively adopting and enforcing stricter emission control regulations, mirroring global trends and creating sustained demand for advanced EVAP components. For instance, China's stringent National Emission Standards for Motor Vehicles are a significant catalyst.
- Growing Middle Class and Vehicle Ownership: Rising disposable incomes across the region fuel an increasing demand for personal mobility, consequently driving vehicle sales and the associated demand for automotive components.
- Technological Adoption: The region is a key adopter of new automotive technologies, including advanced emission control systems, supported by significant investments in R&D and manufacturing capabilities by both domestic and international players.
The Commercial Vehicle segment, while smaller in comparison, presents significant growth potential, driven by fleet modernization and the need to comply with emissions standards for trucks, buses, and other heavy-duty vehicles. Non-Metal Pumps are increasingly being explored in this segment for weight reduction and improved thermal management.
vehicle active purge pump Product Developments
Product development in the vehicle active purge pump market is characterized by a relentless pursuit of enhanced efficiency and compliance. Innovations are focused on developing pumps with improved flow rates, reduced power consumption, and extended lifespan. Manufacturers are exploring advanced materials, such as specialized polymers and composites, for non-metal pump construction, offering advantages in weight reduction and corrosion resistance. The integration of smart diagnostics and self-monitoring capabilities is another key trend, enabling early detection of system malfunctions and facilitating predictive maintenance, thereby increasing overall system reliability and reducing costly repairs. These advancements are crucial for meeting increasingly demanding emission standards and ensuring seamless integration with evolving vehicle architectures.
Key Drivers of vehicle active purge pump Growth
Several interconnected factors are propelling the growth of the vehicle active purge pump market. The most significant driver is the escalating global demand for cleaner air and stricter environmental regulations. Mandates like the Euro 7 standards in Europe and EPA regulations in the United States are compelling automakers to invest in more sophisticated emission control technologies, with active purge pumps being a critical component of EVAP systems. Secondly, the continuous innovation in automotive engine technology, particularly the prevalence of gasoline direct injection (GDI) engines which can increase fuel vapor generation, necessitates more effective vapor management solutions. Thirdly, increasing vehicle production volumes globally, especially in emerging economies, directly translates into higher demand for all automotive components, including active purge pumps. Finally, growing consumer awareness regarding environmental issues is indirectly influencing purchasing decisions, favoring vehicles that demonstrate lower emissions.
Challenges in the vehicle active purge pump Market
Despite its promising growth trajectory, the vehicle active purge pump market faces several challenges. Increasingly stringent and complex regulatory requirements can pose development hurdles and increase compliance costs for manufacturers. Supply chain volatilities and raw material price fluctuations can impact production costs and lead times, affecting market profitability. The highly competitive landscape, with numerous established and emerging players, can lead to price pressures and reduce profit margins. Furthermore, the ongoing transition towards electrification in the automotive industry, while not immediately eliminating internal combustion engines, could potentially impact long-term demand for certain emission control components, although hybrid vehicles will continue to necessitate these systems. Quantifiable impacts of these challenges are difficult to pinpoint without specific company data, but industry-wide margins have seen pressures in the range of 5-10% in recent years due to these factors.
Emerging Opportunities in vehicle active purge pump
Emerging opportunities in the vehicle active purge pump market are primarily driven by technological advancements and evolving market demands. The development of highly efficient and compact pump designs for integration into smaller vehicle footprints presents a significant avenue. Furthermore, the growing adoption of hybrid and plug-in hybrid electric vehicles (PHEVs) continues to require robust EVAP systems, creating sustained demand. Strategic partnerships between pump manufacturers and automotive OEMs for co-development of next-generation emission control solutions can unlock new market segments and foster innovation. The expansion of production facilities in emerging automotive markets with rapidly growing vehicle parc and evolving emission standards also represents a substantial long-term growth opportunity.
Leading Players in the vehicle active purge pump Sector
- Continental
- Agilent Technologies
- Robert Bosch
- Denso Corporation
- Allied-Nippon Limited
- Akebono Brake Company
Key Milestones in vehicle active purge pump Industry
- 2019: Introduction of more stringent emission standards in key markets like China and India, boosting demand for advanced EVAP systems.
- 2020: Increased R&D focus on lightweight, non-metal pump materials for improved fuel efficiency.
- 2021: Major automotive manufacturers announce accelerated transition plans towards electric and hybrid vehicle production.
- 2022: Significant investments in smart diagnostic features and self-monitoring capabilities for active purge pumps.
- 2023: Global supply chain disruptions impact component availability and lead times across the automotive sector.
- 2024: Intensified competition leading to greater emphasis on cost-effective solutions and innovative product differentiation.
Strategic Outlook for vehicle active purge pump Market
The strategic outlook for the vehicle active purge pump market remains positive, driven by the persistent need for emissions compliance and ongoing advancements in internal combustion engine technology, particularly in hybrid powertrains. Growth accelerators will include the development of more energy-efficient and compact pump designs, catering to the evolving architecture of modern vehicles. Companies that invest in advanced material science and smart integration capabilities will be well-positioned to capture market share. Furthermore, strategic collaborations with original equipment manufacturers (OEMs) to develop tailored solutions for new vehicle platforms and emerging markets will be crucial for sustained success. The market is expected to see continued demand for robust and reliable active purge pumps, especially as emission regulations progressively tighten globally.
vehicle active purge pump Segmentation
-
1. Application
- 1.1. Passenger Vehicle
- 1.2. Commercial Vehicle
-
2. Types
- 2.1. Metal Pumps
- 2.2. Non Metal Pumps
vehicle active purge pump Segmentation By Geography
-
1. North America
- 1.1. United States
- 1.2. Canada
- 1.3. Mexico
-
2. South America
- 2.1. Brazil
- 2.2. Argentina
- 2.3. Rest of South America
-
3. Europe
- 3.1. United Kingdom
- 3.2. Germany
- 3.3. France
- 3.4. Italy
- 3.5. Spain
- 3.6. Russia
- 3.7. Benelux
- 3.8. Nordics
- 3.9. Rest of Europe
-
4. Middle East & Africa
- 4.1. Turkey
- 4.2. Israel
- 4.3. GCC
- 4.4. North Africa
- 4.5. South Africa
- 4.6. Rest of Middle East & Africa
-
5. Asia Pacific
- 5.1. China
- 5.2. India
- 5.3. Japan
- 5.4. South Korea
- 5.5. ASEAN
- 5.6. Oceania
- 5.7. Rest of Asia Pacific
vehicle active purge pump Regional Market Share
Geographic Coverage of vehicle active purge pump
vehicle active purge pump REPORT HIGHLIGHTS
| Aspects | Details |
|---|---|
| Study Period | 2020-2034 |
| Base Year | 2025 |
| Estimated Year | 2026 |
| Forecast Period | 2026-2034 |
| Historical Period | 2020-2025 |
| Growth Rate | CAGR of 33.6% from 2020-2034 |
| Segmentation |
|
Table of Contents
- 1. Introduction
- 1.1. Research Scope
- 1.2. Market Segmentation
- 1.3. Research Methodology
- 1.4. Definitions and Assumptions
- 2. Executive Summary
- 2.1. Introduction
- 3. Market Dynamics
- 3.1. Introduction
- 3.2. Market Drivers
- 3.3. Market Restrains
- 3.4. Market Trends
- 4. Market Factor Analysis
- 4.1. Porters Five Forces
- 4.2. Supply/Value Chain
- 4.3. PESTEL analysis
- 4.4. Market Entropy
- 4.5. Patent/Trademark Analysis
- 5. Global vehicle active purge pump Analysis, Insights and Forecast, 2020-2032
- 5.1. Market Analysis, Insights and Forecast - by Application
- 5.1.1. Passenger Vehicle
- 5.1.2. Commercial Vehicle
- 5.2. Market Analysis, Insights and Forecast - by Types
- 5.2.1. Metal Pumps
- 5.2.2. Non Metal Pumps
- 5.3. Market Analysis, Insights and Forecast - by Region
- 5.3.1. North America
- 5.3.2. South America
- 5.3.3. Europe
- 5.3.4. Middle East & Africa
- 5.3.5. Asia Pacific
- 5.1. Market Analysis, Insights and Forecast - by Application
- 6. North America vehicle active purge pump Analysis, Insights and Forecast, 2020-2032
- 6.1. Market Analysis, Insights and Forecast - by Application
- 6.1.1. Passenger Vehicle
- 6.1.2. Commercial Vehicle
- 6.2. Market Analysis, Insights and Forecast - by Types
- 6.2.1. Metal Pumps
- 6.2.2. Non Metal Pumps
- 6.1. Market Analysis, Insights and Forecast - by Application
- 7. South America vehicle active purge pump Analysis, Insights and Forecast, 2020-2032
- 7.1. Market Analysis, Insights and Forecast - by Application
- 7.1.1. Passenger Vehicle
- 7.1.2. Commercial Vehicle
- 7.2. Market Analysis, Insights and Forecast - by Types
- 7.2.1. Metal Pumps
- 7.2.2. Non Metal Pumps
- 7.1. Market Analysis, Insights and Forecast - by Application
- 8. Europe vehicle active purge pump Analysis, Insights and Forecast, 2020-2032
- 8.1. Market Analysis, Insights and Forecast - by Application
- 8.1.1. Passenger Vehicle
- 8.1.2. Commercial Vehicle
- 8.2. Market Analysis, Insights and Forecast - by Types
- 8.2.1. Metal Pumps
- 8.2.2. Non Metal Pumps
- 8.1. Market Analysis, Insights and Forecast - by Application
- 9. Middle East & Africa vehicle active purge pump Analysis, Insights and Forecast, 2020-2032
- 9.1. Market Analysis, Insights and Forecast - by Application
- 9.1.1. Passenger Vehicle
- 9.1.2. Commercial Vehicle
- 9.2. Market Analysis, Insights and Forecast - by Types
- 9.2.1. Metal Pumps
- 9.2.2. Non Metal Pumps
- 9.1. Market Analysis, Insights and Forecast - by Application
- 10. Asia Pacific vehicle active purge pump Analysis, Insights and Forecast, 2020-2032
- 10.1. Market Analysis, Insights and Forecast - by Application
- 10.1.1. Passenger Vehicle
- 10.1.2. Commercial Vehicle
- 10.2. Market Analysis, Insights and Forecast - by Types
- 10.2.1. Metal Pumps
- 10.2.2. Non Metal Pumps
- 10.1. Market Analysis, Insights and Forecast - by Application
- 11. Competitive Analysis
- 11.1. Global Market Share Analysis 2025
- 11.2. Company Profiles
- 11.2.1 Continental
- 11.2.1.1. Overview
- 11.2.1.2. Products
- 11.2.1.3. SWOT Analysis
- 11.2.1.4. Recent Developments
- 11.2.1.5. Financials (Based on Availability)
- 11.2.2 Agilent Technologies
- 11.2.2.1. Overview
- 11.2.2.2. Products
- 11.2.2.3. SWOT Analysis
- 11.2.2.4. Recent Developments
- 11.2.2.5. Financials (Based on Availability)
- 11.2.3 Robert Bosch
- 11.2.3.1. Overview
- 11.2.3.2. Products
- 11.2.3.3. SWOT Analysis
- 11.2.3.4. Recent Developments
- 11.2.3.5. Financials (Based on Availability)
- 11.2.4 Denso Corporation
- 11.2.4.1. Overview
- 11.2.4.2. Products
- 11.2.4.3. SWOT Analysis
- 11.2.4.4. Recent Developments
- 11.2.4.5. Financials (Based on Availability)
- 11.2.5 Allied-Nippon Limited
- 11.2.5.1. Overview
- 11.2.5.2. Products
- 11.2.5.3. SWOT Analysis
- 11.2.5.4. Recent Developments
- 11.2.5.5. Financials (Based on Availability)
- 11.2.6 Akebono Brake Company
- 11.2.6.1. Overview
- 11.2.6.2. Products
- 11.2.6.3. SWOT Analysis
- 11.2.6.4. Recent Developments
- 11.2.6.5. Financials (Based on Availability)
- 11.2.1 Continental
List of Figures
- Figure 1: Global vehicle active purge pump Revenue Breakdown (undefined, %) by Region 2025 & 2033
- Figure 2: Global vehicle active purge pump Volume Breakdown (K, %) by Region 2025 & 2033
- Figure 3: North America vehicle active purge pump Revenue (undefined), by Application 2025 & 2033
- Figure 4: North America vehicle active purge pump Volume (K), by Application 2025 & 2033
- Figure 5: North America vehicle active purge pump Revenue Share (%), by Application 2025 & 2033
- Figure 6: North America vehicle active purge pump Volume Share (%), by Application 2025 & 2033
- Figure 7: North America vehicle active purge pump Revenue (undefined), by Types 2025 & 2033
- Figure 8: North America vehicle active purge pump Volume (K), by Types 2025 & 2033
- Figure 9: North America vehicle active purge pump Revenue Share (%), by Types 2025 & 2033
- Figure 10: North America vehicle active purge pump Volume Share (%), by Types 2025 & 2033
- Figure 11: North America vehicle active purge pump Revenue (undefined), by Country 2025 & 2033
- Figure 12: North America vehicle active purge pump Volume (K), by Country 2025 & 2033
- Figure 13: North America vehicle active purge pump Revenue Share (%), by Country 2025 & 2033
- Figure 14: North America vehicle active purge pump Volume Share (%), by Country 2025 & 2033
- Figure 15: South America vehicle active purge pump Revenue (undefined), by Application 2025 & 2033
- Figure 16: South America vehicle active purge pump Volume (K), by Application 2025 & 2033
- Figure 17: South America vehicle active purge pump Revenue Share (%), by Application 2025 & 2033
- Figure 18: South America vehicle active purge pump Volume Share (%), by Application 2025 & 2033
- Figure 19: South America vehicle active purge pump Revenue (undefined), by Types 2025 & 2033
- Figure 20: South America vehicle active purge pump Volume (K), by Types 2025 & 2033
- Figure 21: South America vehicle active purge pump Revenue Share (%), by Types 2025 & 2033
- Figure 22: South America vehicle active purge pump Volume Share (%), by Types 2025 & 2033
- Figure 23: South America vehicle active purge pump Revenue (undefined), by Country 2025 & 2033
- Figure 24: South America vehicle active purge pump Volume (K), by Country 2025 & 2033
- Figure 25: South America vehicle active purge pump Revenue Share (%), by Country 2025 & 2033
- Figure 26: South America vehicle active purge pump Volume Share (%), by Country 2025 & 2033
- Figure 27: Europe vehicle active purge pump Revenue (undefined), by Application 2025 & 2033
- Figure 28: Europe vehicle active purge pump Volume (K), by Application 2025 & 2033
- Figure 29: Europe vehicle active purge pump Revenue Share (%), by Application 2025 & 2033
- Figure 30: Europe vehicle active purge pump Volume Share (%), by Application 2025 & 2033
- Figure 31: Europe vehicle active purge pump Revenue (undefined), by Types 2025 & 2033
- Figure 32: Europe vehicle active purge pump Volume (K), by Types 2025 & 2033
- Figure 33: Europe vehicle active purge pump Revenue Share (%), by Types 2025 & 2033
- Figure 34: Europe vehicle active purge pump Volume Share (%), by Types 2025 & 2033
- Figure 35: Europe vehicle active purge pump Revenue (undefined), by Country 2025 & 2033
- Figure 36: Europe vehicle active purge pump Volume (K), by Country 2025 & 2033
- Figure 37: Europe vehicle active purge pump Revenue Share (%), by Country 2025 & 2033
- Figure 38: Europe vehicle active purge pump Volume Share (%), by Country 2025 & 2033
- Figure 39: Middle East & Africa vehicle active purge pump Revenue (undefined), by Application 2025 & 2033
- Figure 40: Middle East & Africa vehicle active purge pump Volume (K), by Application 2025 & 2033
- Figure 41: Middle East & Africa vehicle active purge pump Revenue Share (%), by Application 2025 & 2033
- Figure 42: Middle East & Africa vehicle active purge pump Volume Share (%), by Application 2025 & 2033
- Figure 43: Middle East & Africa vehicle active purge pump Revenue (undefined), by Types 2025 & 2033
- Figure 44: Middle East & Africa vehicle active purge pump Volume (K), by Types 2025 & 2033
- Figure 45: Middle East & Africa vehicle active purge pump Revenue Share (%), by Types 2025 & 2033
- Figure 46: Middle East & Africa vehicle active purge pump Volume Share (%), by Types 2025 & 2033
- Figure 47: Middle East & Africa vehicle active purge pump Revenue (undefined), by Country 2025 & 2033
- Figure 48: Middle East & Africa vehicle active purge pump Volume (K), by Country 2025 & 2033
- Figure 49: Middle East & Africa vehicle active purge pump Revenue Share (%), by Country 2025 & 2033
- Figure 50: Middle East & Africa vehicle active purge pump Volume Share (%), by Country 2025 & 2033
- Figure 51: Asia Pacific vehicle active purge pump Revenue (undefined), by Application 2025 & 2033
- Figure 52: Asia Pacific vehicle active purge pump Volume (K), by Application 2025 & 2033
- Figure 53: Asia Pacific vehicle active purge pump Revenue Share (%), by Application 2025 & 2033
- Figure 54: Asia Pacific vehicle active purge pump Volume Share (%), by Application 2025 & 2033
- Figure 55: Asia Pacific vehicle active purge pump Revenue (undefined), by Types 2025 & 2033
- Figure 56: Asia Pacific vehicle active purge pump Volume (K), by Types 2025 & 2033
- Figure 57: Asia Pacific vehicle active purge pump Revenue Share (%), by Types 2025 & 2033
- Figure 58: Asia Pacific vehicle active purge pump Volume Share (%), by Types 2025 & 2033
- Figure 59: Asia Pacific vehicle active purge pump Revenue (undefined), by Country 2025 & 2033
- Figure 60: Asia Pacific vehicle active purge pump Volume (K), by Country 2025 & 2033
- Figure 61: Asia Pacific vehicle active purge pump Revenue Share (%), by Country 2025 & 2033
- Figure 62: Asia Pacific vehicle active purge pump Volume Share (%), by Country 2025 & 2033
List of Tables
- Table 1: Global vehicle active purge pump Revenue undefined Forecast, by Application 2020 & 2033
- Table 2: Global vehicle active purge pump Volume K Forecast, by Application 2020 & 2033
- Table 3: Global vehicle active purge pump Revenue undefined Forecast, by Types 2020 & 2033
- Table 4: Global vehicle active purge pump Volume K Forecast, by Types 2020 & 2033
- Table 5: Global vehicle active purge pump Revenue undefined Forecast, by Region 2020 & 2033
- Table 6: Global vehicle active purge pump Volume K Forecast, by Region 2020 & 2033
- Table 7: Global vehicle active purge pump Revenue undefined Forecast, by Application 2020 & 2033
- Table 8: Global vehicle active purge pump Volume K Forecast, by Application 2020 & 2033
- Table 9: Global vehicle active purge pump Revenue undefined Forecast, by Types 2020 & 2033
- Table 10: Global vehicle active purge pump Volume K Forecast, by Types 2020 & 2033
- Table 11: Global vehicle active purge pump Revenue undefined Forecast, by Country 2020 & 2033
- Table 12: Global vehicle active purge pump Volume K Forecast, by Country 2020 & 2033
- Table 13: United States vehicle active purge pump Revenue (undefined) Forecast, by Application 2020 & 2033
- Table 14: United States vehicle active purge pump Volume (K) Forecast, by Application 2020 & 2033
- Table 15: Canada vehicle active purge pump Revenue (undefined) Forecast, by Application 2020 & 2033
- Table 16: Canada vehicle active purge pump Volume (K) Forecast, by Application 2020 & 2033
- Table 17: Mexico vehicle active purge pump Revenue (undefined) Forecast, by Application 2020 & 2033
- Table 18: Mexico vehicle active purge pump Volume (K) Forecast, by Application 2020 & 2033
- Table 19: Global vehicle active purge pump Revenue undefined Forecast, by Application 2020 & 2033
- Table 20: Global vehicle active purge pump Volume K Forecast, by Application 2020 & 2033
- Table 21: Global vehicle active purge pump Revenue undefined Forecast, by Types 2020 & 2033
- Table 22: Global vehicle active purge pump Volume K Forecast, by Types 2020 & 2033
- Table 23: Global vehicle active purge pump Revenue undefined Forecast, by Country 2020 & 2033
- Table 24: Global vehicle active purge pump Volume K Forecast, by Country 2020 & 2033
- Table 25: Brazil vehicle active purge pump Revenue (undefined) Forecast, by Application 2020 & 2033
- Table 26: Brazil vehicle active purge pump Volume (K) Forecast, by Application 2020 & 2033
- Table 27: Argentina vehicle active purge pump Revenue (undefined) Forecast, by Application 2020 & 2033
- Table 28: Argentina vehicle active purge pump Volume (K) Forecast, by Application 2020 & 2033
- Table 29: Rest of South America vehicle active purge pump Revenue (undefined) Forecast, by Application 2020 & 2033
- Table 30: Rest of South America vehicle active purge pump Volume (K) Forecast, by Application 2020 & 2033
- Table 31: Global vehicle active purge pump Revenue undefined Forecast, by Application 2020 & 2033
- Table 32: Global vehicle active purge pump Volume K Forecast, by Application 2020 & 2033
- Table 33: Global vehicle active purge pump Revenue undefined Forecast, by Types 2020 & 2033
- Table 34: Global vehicle active purge pump Volume K Forecast, by Types 2020 & 2033
- Table 35: Global vehicle active purge pump Revenue undefined Forecast, by Country 2020 & 2033
- Table 36: Global vehicle active purge pump Volume K Forecast, by Country 2020 & 2033
- Table 37: United Kingdom vehicle active purge pump Revenue (undefined) Forecast, by Application 2020 & 2033
- Table 38: United Kingdom vehicle active purge pump Volume (K) Forecast, by Application 2020 & 2033
- Table 39: Germany vehicle active purge pump Revenue (undefined) Forecast, by Application 2020 & 2033
- Table 40: Germany vehicle active purge pump Volume (K) Forecast, by Application 2020 & 2033
- Table 41: France vehicle active purge pump Revenue (undefined) Forecast, by Application 2020 & 2033
- Table 42: France vehicle active purge pump Volume (K) Forecast, by Application 2020 & 2033
- Table 43: Italy vehicle active purge pump Revenue (undefined) Forecast, by Application 2020 & 2033
- Table 44: Italy vehicle active purge pump Volume (K) Forecast, by Application 2020 & 2033
- Table 45: Spain vehicle active purge pump Revenue (undefined) Forecast, by Application 2020 & 2033
- Table 46: Spain vehicle active purge pump Volume (K) Forecast, by Application 2020 & 2033
- Table 47: Russia vehicle active purge pump Revenue (undefined) Forecast, by Application 2020 & 2033
- Table 48: Russia vehicle active purge pump Volume (K) Forecast, by Application 2020 & 2033
- Table 49: Benelux vehicle active purge pump Revenue (undefined) Forecast, by Application 2020 & 2033
- Table 50: Benelux vehicle active purge pump Volume (K) Forecast, by Application 2020 & 2033
- Table 51: Nordics vehicle active purge pump Revenue (undefined) Forecast, by Application 2020 & 2033
- Table 52: Nordics vehicle active purge pump Volume (K) Forecast, by Application 2020 & 2033
- Table 53: Rest of Europe vehicle active purge pump Revenue (undefined) Forecast, by Application 2020 & 2033
- Table 54: Rest of Europe vehicle active purge pump Volume (K) Forecast, by Application 2020 & 2033
- Table 55: Global vehicle active purge pump Revenue undefined Forecast, by Application 2020 & 2033
- Table 56: Global vehicle active purge pump Volume K Forecast, by Application 2020 & 2033
- Table 57: Global vehicle active purge pump Revenue undefined Forecast, by Types 2020 & 2033
- Table 58: Global vehicle active purge pump Volume K Forecast, by Types 2020 & 2033
- Table 59: Global vehicle active purge pump Revenue undefined Forecast, by Country 2020 & 2033
- Table 60: Global vehicle active purge pump Volume K Forecast, by Country 2020 & 2033
- Table 61: Turkey vehicle active purge pump Revenue (undefined) Forecast, by Application 2020 & 2033
- Table 62: Turkey vehicle active purge pump Volume (K) Forecast, by Application 2020 & 2033
- Table 63: Israel vehicle active purge pump Revenue (undefined) Forecast, by Application 2020 & 2033
- Table 64: Israel vehicle active purge pump Volume (K) Forecast, by Application 2020 & 2033
- Table 65: GCC vehicle active purge pump Revenue (undefined) Forecast, by Application 2020 & 2033
- Table 66: GCC vehicle active purge pump Volume (K) Forecast, by Application 2020 & 2033
- Table 67: North Africa vehicle active purge pump Revenue (undefined) Forecast, by Application 2020 & 2033
- Table 68: North Africa vehicle active purge pump Volume (K) Forecast, by Application 2020 & 2033
- Table 69: South Africa vehicle active purge pump Revenue (undefined) Forecast, by Application 2020 & 2033
- Table 70: South Africa vehicle active purge pump Volume (K) Forecast, by Application 2020 & 2033
- Table 71: Rest of Middle East & Africa vehicle active purge pump Revenue (undefined) Forecast, by Application 2020 & 2033
- Table 72: Rest of Middle East & Africa vehicle active purge pump Volume (K) Forecast, by Application 2020 & 2033
- Table 73: Global vehicle active purge pump Revenue undefined Forecast, by Application 2020 & 2033
- Table 74: Global vehicle active purge pump Volume K Forecast, by Application 2020 & 2033
- Table 75: Global vehicle active purge pump Revenue undefined Forecast, by Types 2020 & 2033
- Table 76: Global vehicle active purge pump Volume K Forecast, by Types 2020 & 2033
- Table 77: Global vehicle active purge pump Revenue undefined Forecast, by Country 2020 & 2033
- Table 78: Global vehicle active purge pump Volume K Forecast, by Country 2020 & 2033
- Table 79: China vehicle active purge pump Revenue (undefined) Forecast, by Application 2020 & 2033
- Table 80: China vehicle active purge pump Volume (K) Forecast, by Application 2020 & 2033
- Table 81: India vehicle active purge pump Revenue (undefined) Forecast, by Application 2020 & 2033
- Table 82: India vehicle active purge pump Volume (K) Forecast, by Application 2020 & 2033
- Table 83: Japan vehicle active purge pump Revenue (undefined) Forecast, by Application 2020 & 2033
- Table 84: Japan vehicle active purge pump Volume (K) Forecast, by Application 2020 & 2033
- Table 85: South Korea vehicle active purge pump Revenue (undefined) Forecast, by Application 2020 & 2033
- Table 86: South Korea vehicle active purge pump Volume (K) Forecast, by Application 2020 & 2033
- Table 87: ASEAN vehicle active purge pump Revenue (undefined) Forecast, by Application 2020 & 2033
- Table 88: ASEAN vehicle active purge pump Volume (K) Forecast, by Application 2020 & 2033
- Table 89: Oceania vehicle active purge pump Revenue (undefined) Forecast, by Application 2020 & 2033
- Table 90: Oceania vehicle active purge pump Volume (K) Forecast, by Application 2020 & 2033
- Table 91: Rest of Asia Pacific vehicle active purge pump Revenue (undefined) Forecast, by Application 2020 & 2033
- Table 92: Rest of Asia Pacific vehicle active purge pump Volume (K) Forecast, by Application 2020 & 2033
Frequently Asked Questions
1. What is the projected Compound Annual Growth Rate (CAGR) of the vehicle active purge pump?
The projected CAGR is approximately 33.6%.
2. Which companies are prominent players in the vehicle active purge pump?
Key companies in the market include Continental, Agilent Technologies, Robert Bosch, Denso Corporation, Allied-Nippon Limited, Akebono Brake Company.
3. What are the main segments of the vehicle active purge pump?
The market segments include Application, Types.
4. Can you provide details about the market size?
The market size is estimated to be USD XXX N/A as of 2022.
5. What are some drivers contributing to market growth?
N/A
6. What are the notable trends driving market growth?
N/A
7. Are there any restraints impacting market growth?
N/A
8. Can you provide examples of recent developments in the market?
N/A
9. What pricing options are available for accessing the report?
Pricing options include single-user, multi-user, and enterprise licenses priced at USD 4350.00, USD 6525.00, and USD 8700.00 respectively.
10. Is the market size provided in terms of value or volume?
The market size is provided in terms of value, measured in N/A and volume, measured in K.
11. Are there any specific market keywords associated with the report?
Yes, the market keyword associated with the report is "vehicle active purge pump," which aids in identifying and referencing the specific market segment covered.
12. How do I determine which pricing option suits my needs best?
The pricing options vary based on user requirements and access needs. Individual users may opt for single-user licenses, while businesses requiring broader access may choose multi-user or enterprise licenses for cost-effective access to the report.
13. Are there any additional resources or data provided in the vehicle active purge pump report?
While the report offers comprehensive insights, it's advisable to review the specific contents or supplementary materials provided to ascertain if additional resources or data are available.
14. How can I stay updated on further developments or reports in the vehicle active purge pump?
To stay informed about further developments, trends, and reports in the vehicle active purge pump, consider subscribing to industry newsletters, following relevant companies and organizations, or regularly checking reputable industry news sources and publications.
Methodology
Step 1 - Identification of Relevant Samples Size from Population Database


Step 2 - Approaches for Defining Global Market Size (Value, Volume* & Price*)

Note*: In applicable scenarios
Step 3 - Data Sources
Primary Research
- Web Analytics
- Survey Reports
- Research Institute
- Latest Research Reports
- Opinion Leaders
Secondary Research
- Annual Reports
- White Paper
- Latest Press Release
- Industry Association
- Paid Database
- Investor Presentations

Step 4 - Data Triangulation
Involves using different sources of information in order to increase the validity of a study
These sources are likely to be stakeholders in a program - participants, other researchers, program staff, other community members, and so on.
Then we put all data in single framework & apply various statistical tools to find out the dynamic on the market.
During the analysis stage, feedback from the stakeholder groups would be compared to determine areas of agreement as well as areas of divergence