

Key Insights
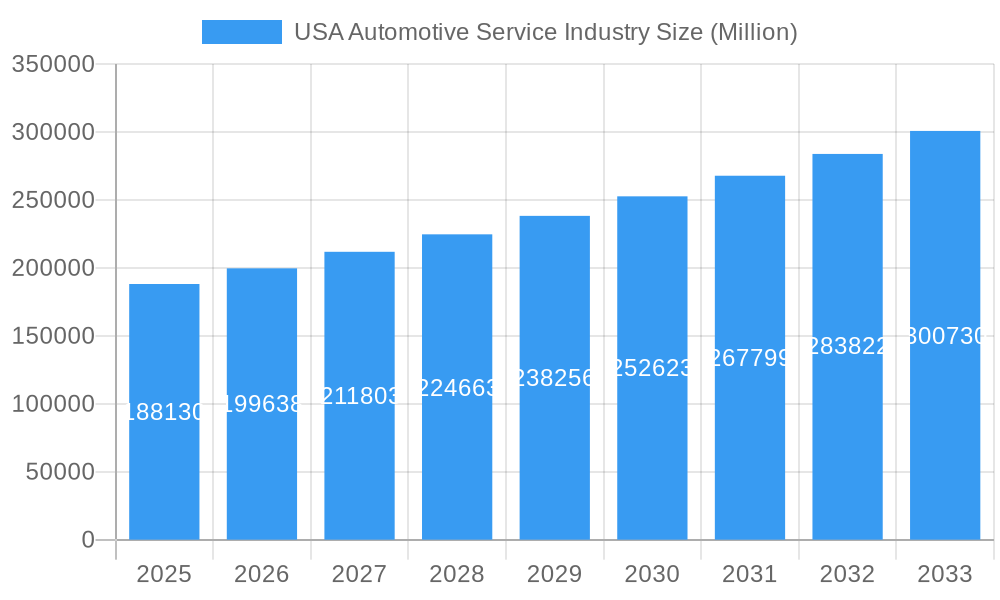
The U.S. automotive service industry, a $188.13 billion market in 2025, is projected to experience robust growth, fueled by a rising number of vehicles on the road, increasing vehicle complexity demanding specialized maintenance, and a growing preference for convenient, reliable service options. The industry's 5.98% CAGR (2025-2033) indicates a significant expansion, driven primarily by the increasing age of vehicles in operation, necessitating more frequent repairs and maintenance. Growth is further propelled by technological advancements, such as the adoption of electric vehicles (EVs) which require specialized battery service and maintenance and the incorporation of advanced driver-assistance systems (ADAS) requiring sophisticated diagnostics. The industry is segmented by service type (mechanical, exterior/structural, electrical/electronics), equipment type (tires, seats, batteries, other), and vehicle type (passenger cars, commercial vehicles). While the increasing cost of parts and labor poses a challenge, the industry's response includes the development of innovative service models and the integration of technology to improve efficiency and reduce operational costs. The competitive landscape includes national chains like Midas, Meineke, Pep Boys, and Firestone, alongside regional players and independent shops. Regional variations in market size exist across the U.S., with higher concentrations likely in densely populated areas and states with a larger number of registered vehicles.
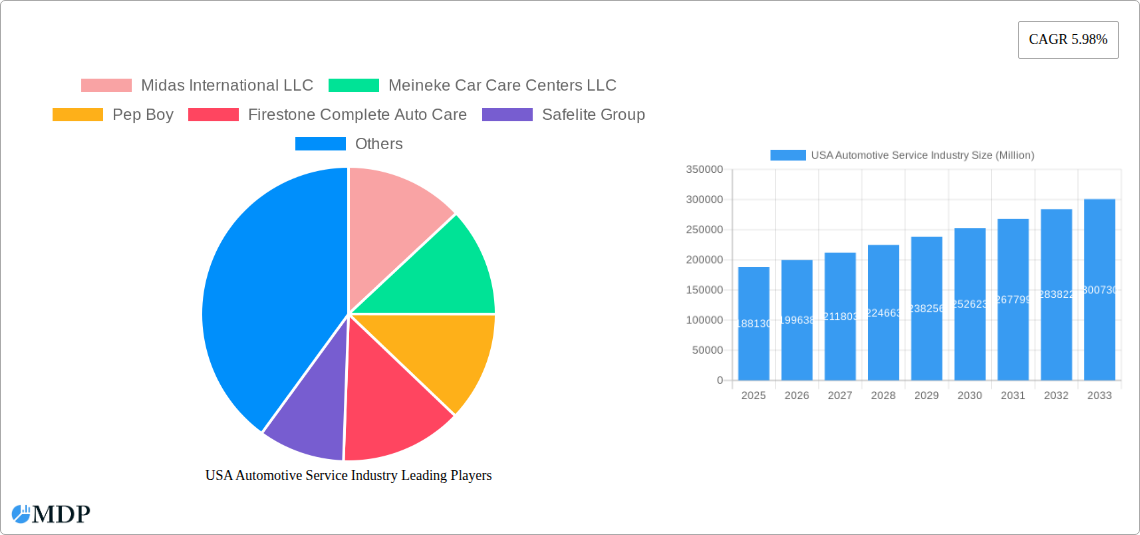
USA Automotive Service Industry Market Size (In Billion)
The forecast period (2025-2033) presents significant opportunities for industry players to capitalize on emerging trends, such as the growing demand for preventative maintenance, the expansion of mobile repair services, and the increasing adoption of telematics for vehicle diagnostics and predictive maintenance. Strategic partnerships, investments in technology, and a focus on customer experience will be critical for success in this dynamic market. The industry will also need to adapt to evolving consumer preferences, including a growing demand for transparency and environmentally friendly practices. The competitive landscape necessitates a focus on differentiation, operational excellence, and strategic alliances to secure market share and profitability. Furthermore, the industry must navigate regulatory changes and labor market dynamics to ensure sustainable growth and profitability over the forecast period.
USA Automotive Service Industry Company Market Share
USA Automotive Service Industry Market Report: 2019-2033
This comprehensive report provides a detailed analysis of the USA automotive service industry, offering invaluable insights for stakeholders, investors, and industry professionals. The report covers market size, segmentation, leading players, industry trends, and future growth projections, utilizing data from the historical period (2019-2024), base year (2025), and forecast period (2025-2033). The market is valued at $XX Million in 2025 and is projected to reach $XX Million by 2033, exhibiting a CAGR of XX%.
USA Automotive Service Industry Market Dynamics & Concentration
The USA automotive service industry is a highly fragmented market, with a large number of small and medium-sized enterprises (SMEs) alongside larger national chains. Market concentration is moderate, with the top five players holding an estimated XX% market share in 2025. Innovation is driven by advancements in vehicle technology, increasing demand for specialized services, and the adoption of data-driven diagnostics. Regulatory frameworks, such as emissions standards and safety regulations, significantly impact industry operations. Product substitutes, like extended warranties and vehicle leasing, pose competitive challenges. End-user trends, including increasing vehicle ownership and a growing preference for convenience and transparency, shape service demand. Mergers and acquisitions (M&A) activity has been robust, with XX major deals recorded between 2019 and 2024, indicating a trend toward consolidation.
- Market Share: Top 5 players: XX% (2025)
- M&A Deal Count (2019-2024): XX
- Key Innovation Drivers: Advanced diagnostics, specialized repair services, mobile repair solutions.
- Regulatory Impacts: Emission standards, safety regulations, labor laws.
USA Automotive Service Industry Industry Trends & Analysis
The USA automotive service industry is experiencing robust growth fueled by several key factors. The increasing age of the vehicle fleet necessitates regular maintenance and repairs, while technological advancements in vehicles are creating demand for specialized services. Consumer preferences are shifting toward convenience, transparency, and digitalized services. The rise of online booking platforms and mobile repair services is disrupting traditional business models. Competitive dynamics are characterized by price competition, service differentiation, and the ongoing consolidation of the market through M&A activities. The market growth is expected to be driven by the increasing demand for maintenance and repair services from the aging vehicle fleet and the rising adoption of connected car technology. The market penetration of advanced driver-assistance systems (ADAS) is also expected to drive the demand for specialized services.
Leading Markets & Segments in USA Automotive Service Industry
The passenger car segment dominates the market, accounting for approximately XX% of the total revenue in 2025. Within service types, mechanical services represent the largest segment, driven by the regular maintenance needs of vehicles. Geographically, the largest markets are concentrated in densely populated states with high vehicle ownership rates. Key drivers for market dominance vary by segment:
By Service Type:
- Mechanical: High frequency of routine maintenance.
- Exterior & Structural: Increasing demand for collision repair and cosmetic services.
- Electrical & Electronics: Growth driven by advanced vehicle technology.
By Equipment Type:
- Tires: High replacement frequency and diverse product offerings.
- Batteries: Growing demand due to hybrid and electric vehicle adoption.
- Other Equipment Types: Includes brake systems, suspension, and other components.
By Vehicle Type:
- Passenger Cars: Largest segment due to high vehicle ownership rates.
- Commercial Vehicles: Steady growth driven by fleet maintenance requirements.
Key Drivers: High vehicle ownership, aging vehicle fleet, rising disposable incomes, technological advancements.
USA Automotive Service Industry Product Developments
Recent product innovations focus on improving efficiency, enhancing diagnostic capabilities, and providing more convenient service options. These include advanced diagnostic tools, mobile repair services, and online booking platforms. Competitive advantages are gained through specialized expertise, superior customer service, and the adoption of innovative technologies. The market is witnessing the integration of AI and machine learning for improved diagnostics and predictive maintenance.
Key Drivers of USA Automotive Service Industry Growth
Growth in the USA automotive service industry is driven by several key factors: the increasing age of the vehicle fleet requiring more frequent maintenance, rising consumer disposable incomes leading to higher spending on vehicle upkeep, and technological advancements in vehicle systems creating demand for specialized services. Government regulations promoting vehicle safety and emission standards also contribute to demand for specific services.
Challenges in the USA Automotive Service Industry Market
The industry faces challenges such as intense price competition, supply chain disruptions impacting parts availability, and the increasing complexity of modern vehicles requiring specialized skills and equipment. Furthermore, regulatory compliance costs and attracting and retaining skilled technicians remain key hurdles. These factors can impact profitability and service quality.
Emerging Opportunities in USA Automotive Service Industry
Emerging opportunities lie in expanding into specialized service areas, leveraging technology for enhanced customer experience and operational efficiency, and strategic partnerships to expand service offerings. The adoption of telematics and data analytics for predictive maintenance opens new revenue streams. Expanding into mobile repair services and offering subscription-based maintenance plans are also promising avenues for growth.
Leading Players in the USA Automotive Service Industry Sector
Key Milestones in USA Automotive Service Industry Industry
- March 2022: Monro Inc. acquires Mountain View Tire & Service Inc., expanding its presence and sales.
- May 2022: American Tire Distributors acquires Monro Inc.'s wholesale tire distribution assets.
- December 2022: AutoNation Inc. acquires RepairSmith, expanding its mobile repair capabilities.
Strategic Outlook for USA Automotive Service Industry Market
The future of the USA automotive service industry looks promising, with continued growth fueled by the aging vehicle fleet, technological advancements, and evolving consumer preferences. Strategic opportunities exist in expanding service offerings, leveraging technology for efficiency gains, and forming strategic partnerships to enhance market reach and service capabilities. The focus on digitalization and data-driven services will be crucial for sustained success.
USA Automotive Service Industry Segmentation
-
1. Vehicle Type
- 1.1. Passenger Cars
- 1.2. Commercial Vehicles
-
2. Service Type
- 2.1. Mechanical
- 2.2. Exterior and Structural
- 2.3. Electrical and Electronics
-
3. Equipment Type
- 3.1. Tires
- 3.2. Seats
- 3.3. Batteries
- 3.4. Other Equipment Types
USA Automotive Service Industry Segmentation By Geography
-
1. North America
- 1.1. United States
- 1.2. Canada
- 1.3. Mexico
-
2. South America
- 2.1. Brazil
- 2.2. Argentina
- 2.3. Rest of South America
-
3. Europe
- 3.1. United Kingdom
- 3.2. Germany
- 3.3. France
- 3.4. Italy
- 3.5. Spain
- 3.6. Russia
- 3.7. Benelux
- 3.8. Nordics
- 3.9. Rest of Europe
-
4. Middle East & Africa
- 4.1. Turkey
- 4.2. Israel
- 4.3. GCC
- 4.4. North Africa
- 4.5. South Africa
- 4.6. Rest of Middle East & Africa
-
5. Asia Pacific
- 5.1. China
- 5.2. India
- 5.3. Japan
- 5.4. South Korea
- 5.5. ASEAN
- 5.6. Oceania
- 5.7. Rest of Asia Pacific
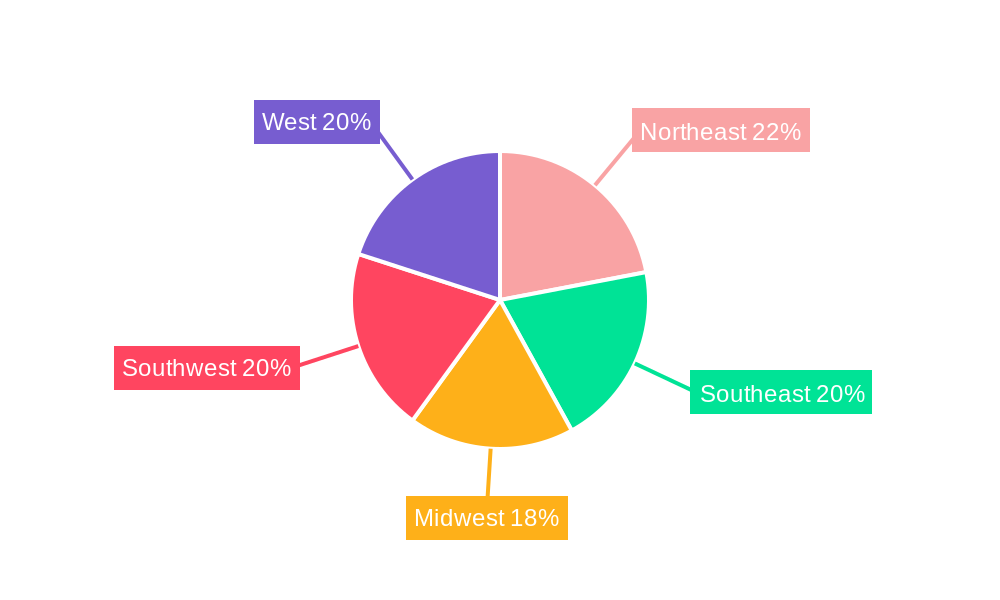
USA Automotive Service Industry Regional Market Share
Geographic Coverage of USA Automotive Service Industry
USA Automotive Service Industry REPORT HIGHLIGHTS
| Aspects | Details |
|---|---|
| Study Period | 2020-2034 |
| Base Year | 2025 |
| Estimated Year | 2026 |
| Forecast Period | 2026-2034 |
| Historical Period | 2020-2025 |
| Growth Rate | CAGR of 5.98% from 2020-2034 |
| Segmentation |
|
Table of Contents
- 1. Introduction
- 1.1. Research Scope
- 1.2. Market Segmentation
- 1.3. Research Objective
- 1.4. Definitions and Assumptions
- 2. Executive Summary
- 2.1. Market Snapshot
- 3. Market Dynamics
- 3.1. Market Drivers
- 3.2. Market Restrains
- 3.3. Market Trends
- 3.4. Market Opportunities
- 4. Market Factor Analysis
- 4.1. Porters Five Forces
- 4.1.1. Bargaining Power of Suppliers
- 4.1.2. Bargaining Power of Buyers
- 4.1.3. Threat of New Entrants
- 4.1.4. Threat of Substitutes
- 4.1.5. Competitive Rivalry
- 4.2. PESTEL analysis
- 4.3. BCG Analysis
- 4.3.1. Stars (High Growth, High Market Share)
- 4.3.2. Cash Cows (Low Growth, High Market Share)
- 4.3.3. Question Mark (High Growth, Low Market Share)
- 4.3.4. Dogs (Low Growth, Low Market Share)
- 4.4. Ansoff Matrix Analysis
- 4.5. Supply Chain Analysis
- 4.6. Regulatory Landscape
- 4.7. Current Market Potential and Opportunity Assessment (TAM–SAM–SOM Framework)
- 4.8. MDP Analyst Note
- 4.1. Porters Five Forces
- 5. Market Analysis, Insights and Forecast 2021-2033
- 5.1. Market Analysis, Insights and Forecast - by Vehicle Type
- 5.1.1. Passenger Cars
- 5.1.2. Commercial Vehicles
- 5.2. Market Analysis, Insights and Forecast - by Service Type
- 5.2.1. Mechanical
- 5.2.2. Exterior and Structural
- 5.2.3. Electrical and Electronics
- 5.3. Market Analysis, Insights and Forecast - by Equipment Type
- 5.3.1. Tires
- 5.3.2. Seats
- 5.3.3. Batteries
- 5.3.4. Other Equipment Types
- 5.4. Market Analysis, Insights and Forecast - by Region
- 5.4.1. North America
- 5.4.2. South America
- 5.4.3. Europe
- 5.4.4. Middle East & Africa
- 5.4.5. Asia Pacific
- 5.1. Market Analysis, Insights and Forecast - by Vehicle Type
- 6. Global USA Automotive Service Industry Analysis, Insights and Forecast, 2021-2033
- 6.1. Market Analysis, Insights and Forecast - by Vehicle Type
- 6.1.1. Passenger Cars
- 6.1.2. Commercial Vehicles
- 6.2. Market Analysis, Insights and Forecast - by Service Type
- 6.2.1. Mechanical
- 6.2.2. Exterior and Structural
- 6.2.3. Electrical and Electronics
- 6.3. Market Analysis, Insights and Forecast - by Equipment Type
- 6.3.1. Tires
- 6.3.2. Seats
- 6.3.3. Batteries
- 6.3.4. Other Equipment Types
- 6.1. Market Analysis, Insights and Forecast - by Vehicle Type
- 7. North America USA Automotive Service Industry Analysis, Insights and Forecast, 2020-2032
- 7.1. Market Analysis, Insights and Forecast - by Vehicle Type
- 7.1.1. Passenger Cars
- 7.1.2. Commercial Vehicles
- 7.2. Market Analysis, Insights and Forecast - by Service Type
- 7.2.1. Mechanical
- 7.2.2. Exterior and Structural
- 7.2.3. Electrical and Electronics
- 7.3. Market Analysis, Insights and Forecast - by Equipment Type
- 7.3.1. Tires
- 7.3.2. Seats
- 7.3.3. Batteries
- 7.3.4. Other Equipment Types
- 7.1. Market Analysis, Insights and Forecast - by Vehicle Type
- 8. South America USA Automotive Service Industry Analysis, Insights and Forecast, 2020-2032
- 8.1. Market Analysis, Insights and Forecast - by Vehicle Type
- 8.1.1. Passenger Cars
- 8.1.2. Commercial Vehicles
- 8.2. Market Analysis, Insights and Forecast - by Service Type
- 8.2.1. Mechanical
- 8.2.2. Exterior and Structural
- 8.2.3. Electrical and Electronics
- 8.3. Market Analysis, Insights and Forecast - by Equipment Type
- 8.3.1. Tires
- 8.3.2. Seats
- 8.3.3. Batteries
- 8.3.4. Other Equipment Types
- 8.1. Market Analysis, Insights and Forecast - by Vehicle Type
- 9. Europe USA Automotive Service Industry Analysis, Insights and Forecast, 2020-2032
- 9.1. Market Analysis, Insights and Forecast - by Vehicle Type
- 9.1.1. Passenger Cars
- 9.1.2. Commercial Vehicles
- 9.2. Market Analysis, Insights and Forecast - by Service Type
- 9.2.1. Mechanical
- 9.2.2. Exterior and Structural
- 9.2.3. Electrical and Electronics
- 9.3. Market Analysis, Insights and Forecast - by Equipment Type
- 9.3.1. Tires
- 9.3.2. Seats
- 9.3.3. Batteries
- 9.3.4. Other Equipment Types
- 9.1. Market Analysis, Insights and Forecast - by Vehicle Type
- 10. Middle East & Africa USA Automotive Service Industry Analysis, Insights and Forecast, 2020-2032
- 10.1. Market Analysis, Insights and Forecast - by Vehicle Type
- 10.1.1. Passenger Cars
- 10.1.2. Commercial Vehicles
- 10.2. Market Analysis, Insights and Forecast - by Service Type
- 10.2.1. Mechanical
- 10.2.2. Exterior and Structural
- 10.2.3. Electrical and Electronics
- 10.3. Market Analysis, Insights and Forecast - by Equipment Type
- 10.3.1. Tires
- 10.3.2. Seats
- 10.3.3. Batteries
- 10.3.4. Other Equipment Types
- 10.1. Market Analysis, Insights and Forecast - by Vehicle Type
- 11. Asia Pacific USA Automotive Service Industry Analysis, Insights and Forecast, 2020-2032
- 11.1. Market Analysis, Insights and Forecast - by Vehicle Type
- 11.1.1. Passenger Cars
- 11.1.2. Commercial Vehicles
- 11.2. Market Analysis, Insights and Forecast - by Service Type
- 11.2.1. Mechanical
- 11.2.2. Exterior and Structural
- 11.2.3. Electrical and Electronics
- 11.3. Market Analysis, Insights and Forecast - by Equipment Type
- 11.3.1. Tires
- 11.3.2. Seats
- 11.3.3. Batteries
- 11.3.4. Other Equipment Types
- 11.1. Market Analysis, Insights and Forecast - by Vehicle Type
- 12. Competitive Analysis
- 12.1. Company Profiles
- 12.1.1 Midas International LLC
- 12.1.1.1. Company Overview
- 12.1.1.2. Products
- 12.1.1.3. Company Financials
- 12.1.1.4. SWOT Analysis
- 12.1.2 Meineke Car Care Centers LLC
- 12.1.2.1. Company Overview
- 12.1.2.2. Products
- 12.1.2.3. Company Financials
- 12.1.2.4. SWOT Analysis
- 12.1.3 Pep Boy
- 12.1.3.1. Company Overview
- 12.1.3.2. Products
- 12.1.3.3. Company Financials
- 12.1.3.4. SWOT Analysis
- 12.1.4 Firestone Complete Auto Care
- 12.1.4.1. Company Overview
- 12.1.4.2. Products
- 12.1.4.3. Company Financials
- 12.1.4.4. SWOT Analysis
- 12.1.5 Safelite Group
- 12.1.5.1. Company Overview
- 12.1.5.2. Products
- 12.1.5.3. Company Financials
- 12.1.5.4. SWOT Analysis
- 12.1.6 Monro Inc
- 12.1.6.1. Company Overview
- 12.1.6.2. Products
- 12.1.6.3. Company Financials
- 12.1.6.4. SWOT Analysis
- 12.1.7 Jiffy Lube International Inc
- 12.1.7.1. Company Overview
- 12.1.7.2. Products
- 12.1.7.3. Company Financials
- 12.1.7.4. SWOT Analysis
- 12.1.8 Walmart Inc
- 12.1.8.1. Company Overview
- 12.1.8.2. Products
- 12.1.8.3. Company Financials
- 12.1.8.4. SWOT Analysis
- 12.1.1 Midas International LLC
- 12.2. Market Entropy
- 12.2.1 Company's Key Areas Served
- 12.2.2 Recent Developments
- 12.3. Company Market Share Analysis 2025
- 12.3.1 Top 5 Companies Market Share Analysis
- 12.3.2 Top 3 Companies Market Share Analysis
- 12.4. List of Potential Customers
- 13. Research Methodology
List of Figures
- Figure 1: Global USA Automotive Service Industry Revenue Breakdown (Million, %) by Region 2025 & 2033
- Figure 2: North America USA Automotive Service Industry Revenue (Million), by Vehicle Type 2025 & 2033
- Figure 3: North America USA Automotive Service Industry Revenue Share (%), by Vehicle Type 2025 & 2033
- Figure 4: North America USA Automotive Service Industry Revenue (Million), by Service Type 2025 & 2033
- Figure 5: North America USA Automotive Service Industry Revenue Share (%), by Service Type 2025 & 2033
- Figure 6: North America USA Automotive Service Industry Revenue (Million), by Equipment Type 2025 & 2033
- Figure 7: North America USA Automotive Service Industry Revenue Share (%), by Equipment Type 2025 & 2033
- Figure 8: North America USA Automotive Service Industry Revenue (Million), by Country 2025 & 2033
- Figure 9: North America USA Automotive Service Industry Revenue Share (%), by Country 2025 & 2033
- Figure 10: South America USA Automotive Service Industry Revenue (Million), by Vehicle Type 2025 & 2033
- Figure 11: South America USA Automotive Service Industry Revenue Share (%), by Vehicle Type 2025 & 2033
- Figure 12: South America USA Automotive Service Industry Revenue (Million), by Service Type 2025 & 2033
- Figure 13: South America USA Automotive Service Industry Revenue Share (%), by Service Type 2025 & 2033
- Figure 14: South America USA Automotive Service Industry Revenue (Million), by Equipment Type 2025 & 2033
- Figure 15: South America USA Automotive Service Industry Revenue Share (%), by Equipment Type 2025 & 2033
- Figure 16: South America USA Automotive Service Industry Revenue (Million), by Country 2025 & 2033
- Figure 17: South America USA Automotive Service Industry Revenue Share (%), by Country 2025 & 2033
- Figure 18: Europe USA Automotive Service Industry Revenue (Million), by Vehicle Type 2025 & 2033
- Figure 19: Europe USA Automotive Service Industry Revenue Share (%), by Vehicle Type 2025 & 2033
- Figure 20: Europe USA Automotive Service Industry Revenue (Million), by Service Type 2025 & 2033
- Figure 21: Europe USA Automotive Service Industry Revenue Share (%), by Service Type 2025 & 2033
- Figure 22: Europe USA Automotive Service Industry Revenue (Million), by Equipment Type 2025 & 2033
- Figure 23: Europe USA Automotive Service Industry Revenue Share (%), by Equipment Type 2025 & 2033
- Figure 24: Europe USA Automotive Service Industry Revenue (Million), by Country 2025 & 2033
- Figure 25: Europe USA Automotive Service Industry Revenue Share (%), by Country 2025 & 2033
- Figure 26: Middle East & Africa USA Automotive Service Industry Revenue (Million), by Vehicle Type 2025 & 2033
- Figure 27: Middle East & Africa USA Automotive Service Industry Revenue Share (%), by Vehicle Type 2025 & 2033
- Figure 28: Middle East & Africa USA Automotive Service Industry Revenue (Million), by Service Type 2025 & 2033
- Figure 29: Middle East & Africa USA Automotive Service Industry Revenue Share (%), by Service Type 2025 & 2033
- Figure 30: Middle East & Africa USA Automotive Service Industry Revenue (Million), by Equipment Type 2025 & 2033
- Figure 31: Middle East & Africa USA Automotive Service Industry Revenue Share (%), by Equipment Type 2025 & 2033
- Figure 32: Middle East & Africa USA Automotive Service Industry Revenue (Million), by Country 2025 & 2033
- Figure 33: Middle East & Africa USA Automotive Service Industry Revenue Share (%), by Country 2025 & 2033
- Figure 34: Asia Pacific USA Automotive Service Industry Revenue (Million), by Vehicle Type 2025 & 2033
- Figure 35: Asia Pacific USA Automotive Service Industry Revenue Share (%), by Vehicle Type 2025 & 2033
- Figure 36: Asia Pacific USA Automotive Service Industry Revenue (Million), by Service Type 2025 & 2033
- Figure 37: Asia Pacific USA Automotive Service Industry Revenue Share (%), by Service Type 2025 & 2033
- Figure 38: Asia Pacific USA Automotive Service Industry Revenue (Million), by Equipment Type 2025 & 2033
- Figure 39: Asia Pacific USA Automotive Service Industry Revenue Share (%), by Equipment Type 2025 & 2033
- Figure 40: Asia Pacific USA Automotive Service Industry Revenue (Million), by Country 2025 & 2033
- Figure 41: Asia Pacific USA Automotive Service Industry Revenue Share (%), by Country 2025 & 2033
List of Tables
- Table 1: Global USA Automotive Service Industry Revenue Million Forecast, by Vehicle Type 2020 & 2033
- Table 2: Global USA Automotive Service Industry Revenue Million Forecast, by Service Type 2020 & 2033
- Table 3: Global USA Automotive Service Industry Revenue Million Forecast, by Equipment Type 2020 & 2033
- Table 4: Global USA Automotive Service Industry Revenue Million Forecast, by Region 2020 & 2033
- Table 5: Global USA Automotive Service Industry Revenue Million Forecast, by Vehicle Type 2020 & 2033
- Table 6: Global USA Automotive Service Industry Revenue Million Forecast, by Service Type 2020 & 2033
- Table 7: Global USA Automotive Service Industry Revenue Million Forecast, by Equipment Type 2020 & 2033
- Table 8: Global USA Automotive Service Industry Revenue Million Forecast, by Country 2020 & 2033
- Table 9: United States USA Automotive Service Industry Revenue (Million) Forecast, by Application 2020 & 2033
- Table 10: Canada USA Automotive Service Industry Revenue (Million) Forecast, by Application 2020 & 2033
- Table 11: Mexico USA Automotive Service Industry Revenue (Million) Forecast, by Application 2020 & 2033
- Table 12: Global USA Automotive Service Industry Revenue Million Forecast, by Vehicle Type 2020 & 2033
- Table 13: Global USA Automotive Service Industry Revenue Million Forecast, by Service Type 2020 & 2033
- Table 14: Global USA Automotive Service Industry Revenue Million Forecast, by Equipment Type 2020 & 2033
- Table 15: Global USA Automotive Service Industry Revenue Million Forecast, by Country 2020 & 2033
- Table 16: Brazil USA Automotive Service Industry Revenue (Million) Forecast, by Application 2020 & 2033
- Table 17: Argentina USA Automotive Service Industry Revenue (Million) Forecast, by Application 2020 & 2033
- Table 18: Rest of South America USA Automotive Service Industry Revenue (Million) Forecast, by Application 2020 & 2033
- Table 19: Global USA Automotive Service Industry Revenue Million Forecast, by Vehicle Type 2020 & 2033
- Table 20: Global USA Automotive Service Industry Revenue Million Forecast, by Service Type 2020 & 2033
- Table 21: Global USA Automotive Service Industry Revenue Million Forecast, by Equipment Type 2020 & 2033
- Table 22: Global USA Automotive Service Industry Revenue Million Forecast, by Country 2020 & 2033
- Table 23: United Kingdom USA Automotive Service Industry Revenue (Million) Forecast, by Application 2020 & 2033
- Table 24: Germany USA Automotive Service Industry Revenue (Million) Forecast, by Application 2020 & 2033
- Table 25: France USA Automotive Service Industry Revenue (Million) Forecast, by Application 2020 & 2033
- Table 26: Italy USA Automotive Service Industry Revenue (Million) Forecast, by Application 2020 & 2033
- Table 27: Spain USA Automotive Service Industry Revenue (Million) Forecast, by Application 2020 & 2033
- Table 28: Russia USA Automotive Service Industry Revenue (Million) Forecast, by Application 2020 & 2033
- Table 29: Benelux USA Automotive Service Industry Revenue (Million) Forecast, by Application 2020 & 2033
- Table 30: Nordics USA Automotive Service Industry Revenue (Million) Forecast, by Application 2020 & 2033
- Table 31: Rest of Europe USA Automotive Service Industry Revenue (Million) Forecast, by Application 2020 & 2033
- Table 32: Global USA Automotive Service Industry Revenue Million Forecast, by Vehicle Type 2020 & 2033
- Table 33: Global USA Automotive Service Industry Revenue Million Forecast, by Service Type 2020 & 2033
- Table 34: Global USA Automotive Service Industry Revenue Million Forecast, by Equipment Type 2020 & 2033
- Table 35: Global USA Automotive Service Industry Revenue Million Forecast, by Country 2020 & 2033
- Table 36: Turkey USA Automotive Service Industry Revenue (Million) Forecast, by Application 2020 & 2033
- Table 37: Israel USA Automotive Service Industry Revenue (Million) Forecast, by Application 2020 & 2033
- Table 38: GCC USA Automotive Service Industry Revenue (Million) Forecast, by Application 2020 & 2033
- Table 39: North Africa USA Automotive Service Industry Revenue (Million) Forecast, by Application 2020 & 2033
- Table 40: South Africa USA Automotive Service Industry Revenue (Million) Forecast, by Application 2020 & 2033
- Table 41: Rest of Middle East & Africa USA Automotive Service Industry Revenue (Million) Forecast, by Application 2020 & 2033
- Table 42: Global USA Automotive Service Industry Revenue Million Forecast, by Vehicle Type 2020 & 2033
- Table 43: Global USA Automotive Service Industry Revenue Million Forecast, by Service Type 2020 & 2033
- Table 44: Global USA Automotive Service Industry Revenue Million Forecast, by Equipment Type 2020 & 2033
- Table 45: Global USA Automotive Service Industry Revenue Million Forecast, by Country 2020 & 2033
- Table 46: China USA Automotive Service Industry Revenue (Million) Forecast, by Application 2020 & 2033
- Table 47: India USA Automotive Service Industry Revenue (Million) Forecast, by Application 2020 & 2033
- Table 48: Japan USA Automotive Service Industry Revenue (Million) Forecast, by Application 2020 & 2033
- Table 49: South Korea USA Automotive Service Industry Revenue (Million) Forecast, by Application 2020 & 2033
- Table 50: ASEAN USA Automotive Service Industry Revenue (Million) Forecast, by Application 2020 & 2033
- Table 51: Oceania USA Automotive Service Industry Revenue (Million) Forecast, by Application 2020 & 2033
- Table 52: Rest of Asia Pacific USA Automotive Service Industry Revenue (Million) Forecast, by Application 2020 & 2033
Frequently Asked Questions
1. What is the projected Compound Annual Growth Rate (CAGR) of the USA Automotive Service Industry?
The projected CAGR is approximately 5.98%.
2. Which companies are prominent players in the USA Automotive Service Industry?
Key companies in the market include Midas International LLC, Meineke Car Care Centers LLC, Pep Boy, Firestone Complete Auto Care, Safelite Group, Monro Inc, Jiffy Lube International Inc, Walmart Inc.
3. What are the main segments of the USA Automotive Service Industry?
The market segments include Vehicle Type, Service Type, Equipment Type.
4. Can you provide details about the market size?
The market size is estimated to be USD 188.13 Million as of 2022.
5. What are some drivers contributing to market growth?
Increasing Sales of Electric Vehicles are Expected to Drive the Market.
6. What are the notable trends driving market growth?
Growing Demand for Commercial Vehicles Likely to Drive the Market.
7. Are there any restraints impacting market growth?
Lack of Infrastructure May Hamper the growth of the Market.
8. Can you provide examples of recent developments in the market?
In December 2022, AutoNation Inc., one of America's largest automotive retailers, announced the acquisition of RepairSmith, a full-service mobile solution for automotive repair and maintenance headquartered in Los Angeles, CA, with a significant operational footprint in the southern and western United States.
9. What pricing options are available for accessing the report?
Pricing options include single-user, multi-user, and enterprise licenses priced at USD 3800, USD 4500, and USD 5800 respectively.
10. Is the market size provided in terms of value or volume?
The market size is provided in terms of value, measured in Million.
11. Are there any specific market keywords associated with the report?
Yes, the market keyword associated with the report is "USA Automotive Service Industry," which aids in identifying and referencing the specific market segment covered.
12. How do I determine which pricing option suits my needs best?
The pricing options vary based on user requirements and access needs. Individual users may opt for single-user licenses, while businesses requiring broader access may choose multi-user or enterprise licenses for cost-effective access to the report.
13. Are there any additional resources or data provided in the USA Automotive Service Industry report?
While the report offers comprehensive insights, it's advisable to review the specific contents or supplementary materials provided to ascertain if additional resources or data are available.
14. How can I stay updated on further developments or reports in the USA Automotive Service Industry?
To stay informed about further developments, trends, and reports in the USA Automotive Service Industry, consider subscribing to industry newsletters, following relevant companies and organizations, or regularly checking reputable industry news sources and publications.
Methodology
Step 1 - Identification of Relevant Samples Size from Population Database


Step 2 - Approaches for Defining Global Market Size (Value, Volume* & Price*)

Note*: In applicable scenarios
Step 3 - Data Sources
Primary Research
- Web Analytics
- Survey Reports
- Research Institute
- Latest Research Reports
- Opinion Leaders
Secondary Research
- Annual Reports
- White Paper
- Latest Press Release
- Industry Association
- Paid Database
- Investor Presentations

Step 4 - Data Triangulation
Involves using different sources of information in order to increase the validity of a study
These sources are likely to be stakeholders in a program - participants, other researchers, program staff, other community members, and so on.
Then we put all data in single framework & apply various statistical tools to find out the dynamic on the market.
During the analysis stage, feedback from the stakeholder groups would be compared to determine areas of agreement as well as areas of divergence