

Key Insights
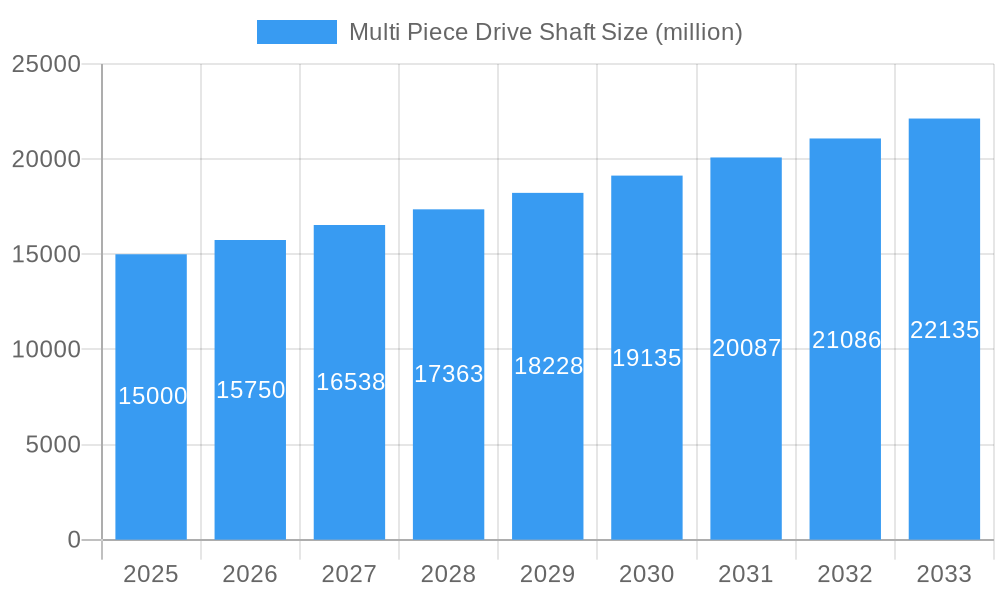
The global multi-piece driveshaft market is poised for substantial expansion, projected to reach 80.46 billion by 2033 from a base year of 2025, with a Compound Annual Growth Rate (CAGR) of 6.3%. This growth is propelled by escalating global demand for passenger and commercial vehicles. Key drivers include the increasing integration of Advanced Driver-Assistance Systems (ADAS), necessitating advanced drivetrain components, a growing preference for fuel-efficient vehicles leading to lighter driveshaft designs, and the robust expansion of the automotive sector in emerging economies such as China and India. Market segmentation highlights significant opportunities within both passenger and commercial vehicle applications. While rigid shafts currently dominate, hollow shafts are gaining traction due to their inherent lightweight properties and enhanced fuel efficiency. Leading industry players, including GKN, Dana, and Neapco, are making strategic R&D investments to elevate product performance and address evolving automotive industry demands, fostering innovation in durability, efficiency, and cost-effectiveness. The burgeoning shift towards electric and hybrid vehicles introduces both challenges and opportunities, prompting manufacturers to adapt designs and materials for these novel powertrains. The Asia-Pacific region is expected to maintain its leadership position, fueled by rapid automotive industry growth in China and India.
Multi Piece Drive Shaft Market Size (In Billion)
Market growth faces headwinds from fluctuating raw material prices, particularly steel, impacting production costs and profitability. Stringent global emission regulations also mandate the development of environmentally friendly materials and manufacturing processes. Furthermore, the increasing complexity of modern vehicle and driveshaft systems demands significant R&D investment for sustained competitiveness. Despite these challenges, the overall market outlook remains optimistic, with continued growth anticipated from long-term vehicle production trends and technological advancements in driveshaft technology. While North America and Europe represent concentrated developed markets, the Asia-Pacific region is projected to exhibit the fastest growth.
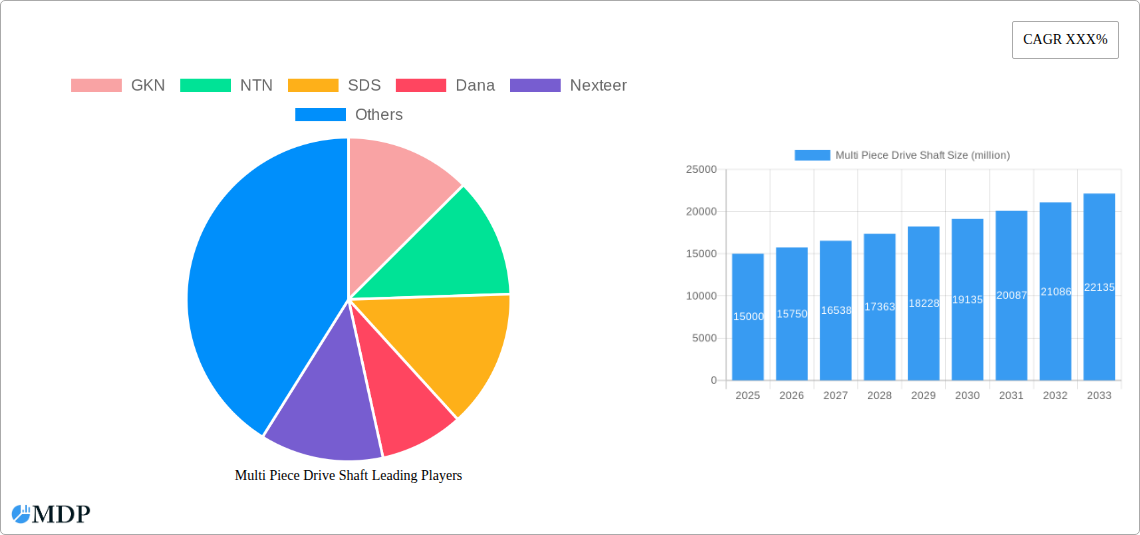
Multi Piece Drive Shaft Company Market Share
Dominating the Drive: A Comprehensive Report on the Multi-Piece Drive Shaft Market (2019-2033)
This in-depth report provides a comprehensive analysis of the global multi-piece drive shaft market, projecting a value exceeding $XX million by 2033. It offers invaluable insights for industry stakeholders, investors, and manufacturers seeking to navigate this dynamic sector. The report covers market dynamics, leading players, technological advancements, and future growth opportunities, utilizing a robust data set spanning the period from 2019 to 2033.
Multi Piece Drive Shaft Market Dynamics & Concentration
The global multi-piece drive shaft market exhibits a moderately consolidated structure, with key players such as GKN, Dana, and Neapco holding significant market share. The market share of the top 5 players is estimated at approximately 45% in 2025. This concentration is expected to remain relatively stable through 2033, although smaller players continue to innovate and compete aggressively. Market concentration is influenced by factors including substantial capital investment in manufacturing, stringent quality control, and long-term supply agreements with OEMs.
- Innovation Drivers: Lightweight materials, advanced manufacturing techniques (e.g., 3D printing for prototyping), and improved durability are driving innovation.
- Regulatory Frameworks: Emission regulations and fuel efficiency standards globally influence design choices and material selection.
- Product Substitutes: While limited, alternative drivetrain technologies (e.g., electric motors) pose a long-term competitive threat.
- End-User Trends: Growing demand for fuel-efficient and lightweight vehicles fuels market growth, particularly in passenger vehicles and commercial vehicles.
- M&A Activities: A total of xx M&A deals were recorded in the multi-piece drive shaft sector between 2019 and 2024, indicating a moderate level of consolidation.
Multi Piece Drive Shaft Industry Trends & Analysis
The global multi-piece drive shaft market is witnessing robust growth, projected to achieve a CAGR of XX% during the forecast period (2025-2033). This growth is primarily driven by the escalating demand for passenger and commercial vehicles globally, coupled with technological advancements leading to enhanced performance and fuel efficiency. The market penetration of multi-piece drive shafts in electric vehicles (EVs) is still relatively low but is expected to grow significantly in the coming years. This growth is influenced by several factors:
- Market Growth Drivers: Rising vehicle production, increasing urbanization, and expanding middle-class populations are contributing to growth.
- Technological Disruptions: The integration of advanced materials like carbon fiber and lightweight alloys is transforming drive shaft design, improving efficiency and reducing weight.
- Consumer Preferences: Demand for fuel-efficient and environmentally friendly vehicles is driving the adoption of lightweight and optimized drive shaft designs.
- Competitive Dynamics: Intense competition amongst major players is prompting continuous innovation and cost optimization.
Leading Markets & Segments in Multi Piece Drive Shaft
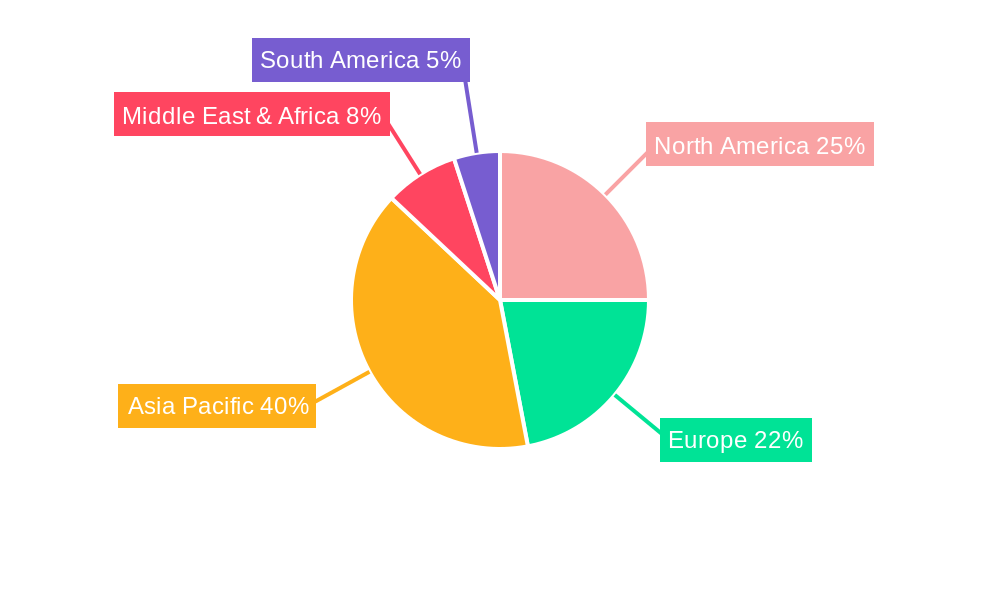
The Asia-Pacific region currently dominates the multi-piece drive shaft market, driven primarily by the booming automotive industry in China and India. The passenger vehicle segment represents the largest market share, with a substantial contribution from the commercial vehicle sector. Within shaft types, rigid shafts currently hold a larger share than hollow shafts, although this is predicted to change in the coming years.
Key Drivers in Asia-Pacific:
- Rapid economic growth and rising disposable incomes.
- Government support for automotive industry development.
- Significant investments in infrastructure projects.
Dominance Analysis: The dominance of the Asia-Pacific region stems from the large-scale vehicle production, coupled with significant investments in manufacturing facilities by leading global players. The passenger vehicle segment’s dominance reflects the massive increase in personal vehicle ownership globally. Rigid shafts currently dominate due to established manufacturing techniques and cost-effectiveness. However, the increasing adoption of hollow shafts is anticipated, driven by their weight reduction capabilities.
Multi Piece Drive Shaft Product Developments
Recent product innovations focus on lighter weight, enhanced durability, and improved NVH (Noise, Vibration, and Harshness) characteristics. The integration of advanced materials, such as high-strength steel alloys and carbon fiber composites, is a key trend. These advancements aim to improve fuel efficiency, extend lifespan, and enhance overall vehicle performance, aligning with the growing demand for better driving experiences and stringent emission regulations.
Key Drivers of Multi Piece Drive Shaft Growth
The growth of the multi-piece drive shaft market is fueled by several key factors:
- Technological Advancements: Lightweight materials and enhanced manufacturing processes improve performance and fuel efficiency.
- Economic Growth: Rising disposable incomes in developing economies stimulate vehicle sales.
- Stringent Emission Regulations: Global regulations promote the adoption of fuel-efficient drive shaft designs.
Challenges in the Multi Piece Drive Shaft Market
Several challenges hamper the growth of the multi-piece drive shaft market:
- Fluctuating Raw Material Prices: Price volatility of steel and other key raw materials impacts production costs.
- Supply Chain Disruptions: Global supply chain disruptions can affect production and delivery timelines.
- Intense Competition: Competition among major manufacturers necessitates continuous innovation and cost optimization strategies.
Emerging Opportunities in Multi Piece Drive Shaft
Significant opportunities exist for growth in the multi-piece drive shaft market, including:
- Technological Breakthroughs: The development of lighter and more efficient materials continues to offer substantial opportunities.
- Strategic Partnerships: Collaboration between drive shaft manufacturers and automotive OEMs strengthens supply chains and accelerates innovation.
- Market Expansion: The expansion into emerging markets with growing automotive industries unlocks considerable growth potential.
Key Milestones in Multi Piece Drive Shaft Industry
- 2020: Introduction of a new lightweight drive shaft design by GKN, incorporating advanced materials.
- 2022: Merger between two smaller drive shaft manufacturers, consolidating market share.
- 2023: Launch of a new manufacturing facility by Dana in a key emerging market.
- 2024: Significant investment in R&D by Neapco focused on electric vehicle drive shaft technology.
Strategic Outlook for Multi Piece Drive Shaft Market
The multi-piece drive shaft market holds immense potential for future growth, driven by technological innovation, expanding global vehicle production, and increasing demand for fuel-efficient vehicles. Strategic opportunities lie in investing in research and development of lightweight materials, exploring strategic partnerships, and capitalizing on the growth potential of emerging markets. The market's future trajectory is positive, particularly with the ongoing advancements in electric vehicle technology, creating opportunities for manufacturers to develop specialized drive shafts for this evolving segment.
Multi Piece Drive Shaft Segmentation
-
1. Application
- 1.1. Passenger Vehicle
- 1.2. Commercial Vehicle
-
2. Type
- 2.1. Rigid Shaft
- 2.2. Hollow Shaft
Multi Piece Drive Shaft Segmentation By Geography
-
1. North America
- 1.1. United States
- 1.2. Canada
- 1.3. Mexico
-
2. South America
- 2.1. Brazil
- 2.2. Argentina
- 2.3. Rest of South America
-
3. Europe
- 3.1. United Kingdom
- 3.2. Germany
- 3.3. France
- 3.4. Italy
- 3.5. Spain
- 3.6. Russia
- 3.7. Benelux
- 3.8. Nordics
- 3.9. Rest of Europe
-
4. Middle East & Africa
- 4.1. Turkey
- 4.2. Israel
- 4.3. GCC
- 4.4. North Africa
- 4.5. South Africa
- 4.6. Rest of Middle East & Africa
-
5. Asia Pacific
- 5.1. China
- 5.2. India
- 5.3. Japan
- 5.4. South Korea
- 5.5. ASEAN
- 5.6. Oceania
- 5.7. Rest of Asia Pacific
Multi Piece Drive Shaft Regional Market Share
Geographic Coverage of Multi Piece Drive Shaft
Multi Piece Drive Shaft REPORT HIGHLIGHTS
| Aspects | Details |
|---|---|
| Study Period | 2020-2034 |
| Base Year | 2025 |
| Estimated Year | 2026 |
| Forecast Period | 2026-2034 |
| Historical Period | 2020-2025 |
| Growth Rate | CAGR of 6.3% from 2020-2034 |
| Segmentation |
|
Table of Contents
- 1. Introduction
- 1.1. Research Scope
- 1.2. Market Segmentation
- 1.3. Research Methodology
- 1.4. Definitions and Assumptions
- 2. Executive Summary
- 2.1. Introduction
- 3. Market Dynamics
- 3.1. Introduction
- 3.2. Market Drivers
- 3.3. Market Restrains
- 3.4. Market Trends
- 4. Market Factor Analysis
- 4.1. Porters Five Forces
- 4.2. Supply/Value Chain
- 4.3. PESTEL analysis
- 4.4. Market Entropy
- 4.5. Patent/Trademark Analysis
- 5. Global Multi Piece Drive Shaft Analysis, Insights and Forecast, 2020-2032
- 5.1. Market Analysis, Insights and Forecast - by Application
- 5.1.1. Passenger Vehicle
- 5.1.2. Commercial Vehicle
- 5.2. Market Analysis, Insights and Forecast - by Type
- 5.2.1. Rigid Shaft
- 5.2.2. Hollow Shaft
- 5.3. Market Analysis, Insights and Forecast - by Region
- 5.3.1. North America
- 5.3.2. South America
- 5.3.3. Europe
- 5.3.4. Middle East & Africa
- 5.3.5. Asia Pacific
- 5.1. Market Analysis, Insights and Forecast - by Application
- 6. North America Multi Piece Drive Shaft Analysis, Insights and Forecast, 2020-2032
- 6.1. Market Analysis, Insights and Forecast - by Application
- 6.1.1. Passenger Vehicle
- 6.1.2. Commercial Vehicle
- 6.2. Market Analysis, Insights and Forecast - by Type
- 6.2.1. Rigid Shaft
- 6.2.2. Hollow Shaft
- 6.1. Market Analysis, Insights and Forecast - by Application
- 7. South America Multi Piece Drive Shaft Analysis, Insights and Forecast, 2020-2032
- 7.1. Market Analysis, Insights and Forecast - by Application
- 7.1.1. Passenger Vehicle
- 7.1.2. Commercial Vehicle
- 7.2. Market Analysis, Insights and Forecast - by Type
- 7.2.1. Rigid Shaft
- 7.2.2. Hollow Shaft
- 7.1. Market Analysis, Insights and Forecast - by Application
- 8. Europe Multi Piece Drive Shaft Analysis, Insights and Forecast, 2020-2032
- 8.1. Market Analysis, Insights and Forecast - by Application
- 8.1.1. Passenger Vehicle
- 8.1.2. Commercial Vehicle
- 8.2. Market Analysis, Insights and Forecast - by Type
- 8.2.1. Rigid Shaft
- 8.2.2. Hollow Shaft
- 8.1. Market Analysis, Insights and Forecast - by Application
- 9. Middle East & Africa Multi Piece Drive Shaft Analysis, Insights and Forecast, 2020-2032
- 9.1. Market Analysis, Insights and Forecast - by Application
- 9.1.1. Passenger Vehicle
- 9.1.2. Commercial Vehicle
- 9.2. Market Analysis, Insights and Forecast - by Type
- 9.2.1. Rigid Shaft
- 9.2.2. Hollow Shaft
- 9.1. Market Analysis, Insights and Forecast - by Application
- 10. Asia Pacific Multi Piece Drive Shaft Analysis, Insights and Forecast, 2020-2032
- 10.1. Market Analysis, Insights and Forecast - by Application
- 10.1.1. Passenger Vehicle
- 10.1.2. Commercial Vehicle
- 10.2. Market Analysis, Insights and Forecast - by Type
- 10.2.1. Rigid Shaft
- 10.2.2. Hollow Shaft
- 10.1. Market Analysis, Insights and Forecast - by Application
- 11. Competitive Analysis
- 11.1. Global Market Share Analysis 2025
- 11.2. Company Profiles
- 11.2.1 GKN
- 11.2.1.1. Overview
- 11.2.1.2. Products
- 11.2.1.3. SWOT Analysis
- 11.2.1.4. Recent Developments
- 11.2.1.5. Financials (Based on Availability)
- 11.2.2 NTN
- 11.2.2.1. Overview
- 11.2.2.2. Products
- 11.2.2.3. SWOT Analysis
- 11.2.2.4. Recent Developments
- 11.2.2.5. Financials (Based on Availability)
- 11.2.3 SDS
- 11.2.3.1. Overview
- 11.2.3.2. Products
- 11.2.3.3. SWOT Analysis
- 11.2.3.4. Recent Developments
- 11.2.3.5. Financials (Based on Availability)
- 11.2.4 Dana
- 11.2.4.1. Overview
- 11.2.4.2. Products
- 11.2.4.3. SWOT Analysis
- 11.2.4.4. Recent Developments
- 11.2.4.5. Financials (Based on Availability)
- 11.2.5 Nexteer
- 11.2.5.1. Overview
- 11.2.5.2. Products
- 11.2.5.3. SWOT Analysis
- 11.2.5.4. Recent Developments
- 11.2.5.5. Financials (Based on Availability)
- 11.2.6 Hyundai-Wia
- 11.2.6.1. Overview
- 11.2.6.2. Products
- 11.2.6.3. SWOT Analysis
- 11.2.6.4. Recent Developments
- 11.2.6.5. Financials (Based on Availability)
- 11.2.7 IFA Rotorion
- 11.2.7.1. Overview
- 11.2.7.2. Products
- 11.2.7.3. SWOT Analysis
- 11.2.7.4. Recent Developments
- 11.2.7.5. Financials (Based on Availability)
- 11.2.8 Meritor
- 11.2.8.1. Overview
- 11.2.8.2. Products
- 11.2.8.3. SWOT Analysis
- 11.2.8.4. Recent Developments
- 11.2.8.5. Financials (Based on Availability)
- 11.2.9 AAM
- 11.2.9.1. Overview
- 11.2.9.2. Products
- 11.2.9.3. SWOT Analysis
- 11.2.9.4. Recent Developments
- 11.2.9.5. Financials (Based on Availability)
- 11.2.10 Neapco
- 11.2.10.1. Overview
- 11.2.10.2. Products
- 11.2.10.3. SWOT Analysis
- 11.2.10.4. Recent Developments
- 11.2.10.5. Financials (Based on Availability)
- 11.2.11 JTEKT
- 11.2.11.1. Overview
- 11.2.11.2. Products
- 11.2.11.3. SWOT Analysis
- 11.2.11.4. Recent Developments
- 11.2.11.5. Financials (Based on Availability)
- 11.2.12 Yuandong
- 11.2.12.1. Overview
- 11.2.12.2. Products
- 11.2.12.3. SWOT Analysis
- 11.2.12.4. Recent Developments
- 11.2.12.5. Financials (Based on Availability)
- 11.2.13 Wanxiang
- 11.2.13.1. Overview
- 11.2.13.2. Products
- 11.2.13.3. SWOT Analysis
- 11.2.13.4. Recent Developments
- 11.2.13.5. Financials (Based on Availability)
- 11.2.14 Showa
- 11.2.14.1. Overview
- 11.2.14.2. Products
- 11.2.14.3. SWOT Analysis
- 11.2.14.4. Recent Developments
- 11.2.14.5. Financials (Based on Availability)
- 11.2.15 Lingyun
- 11.2.15.1. Overview
- 11.2.15.2. Products
- 11.2.15.3. SWOT Analysis
- 11.2.15.4. Recent Developments
- 11.2.15.5. Financials (Based on Availability)
- 11.2.16 Guansheng
- 11.2.16.1. Overview
- 11.2.16.2. Products
- 11.2.16.3. SWOT Analysis
- 11.2.16.4. Recent Developments
- 11.2.16.5. Financials (Based on Availability)
- 11.2.17 GNA Enterprises
- 11.2.17.1. Overview
- 11.2.17.2. Products
- 11.2.17.3. SWOT Analysis
- 11.2.17.4. Recent Developments
- 11.2.17.5. Financials (Based on Availability)
- 11.2.18 Fawer
- 11.2.18.1. Overview
- 11.2.18.2. Products
- 11.2.18.3. SWOT Analysis
- 11.2.18.4. Recent Developments
- 11.2.18.5. Financials (Based on Availability)
- 11.2.19 Hengli
- 11.2.19.1. Overview
- 11.2.19.2. Products
- 11.2.19.3. SWOT Analysis
- 11.2.19.4. Recent Developments
- 11.2.19.5. Financials (Based on Availability)
- 11.2.20 Danchuan
- 11.2.20.1. Overview
- 11.2.20.2. Products
- 11.2.20.3. SWOT Analysis
- 11.2.20.4. Recent Developments
- 11.2.20.5. Financials (Based on Availability)
- 11.2.1 GKN
List of Figures
- Figure 1: Global Multi Piece Drive Shaft Revenue Breakdown (billion, %) by Region 2025 & 2033
- Figure 2: Global Multi Piece Drive Shaft Volume Breakdown (K, %) by Region 2025 & 2033
- Figure 3: North America Multi Piece Drive Shaft Revenue (billion), by Application 2025 & 2033
- Figure 4: North America Multi Piece Drive Shaft Volume (K), by Application 2025 & 2033
- Figure 5: North America Multi Piece Drive Shaft Revenue Share (%), by Application 2025 & 2033
- Figure 6: North America Multi Piece Drive Shaft Volume Share (%), by Application 2025 & 2033
- Figure 7: North America Multi Piece Drive Shaft Revenue (billion), by Type 2025 & 2033
- Figure 8: North America Multi Piece Drive Shaft Volume (K), by Type 2025 & 2033
- Figure 9: North America Multi Piece Drive Shaft Revenue Share (%), by Type 2025 & 2033
- Figure 10: North America Multi Piece Drive Shaft Volume Share (%), by Type 2025 & 2033
- Figure 11: North America Multi Piece Drive Shaft Revenue (billion), by Country 2025 & 2033
- Figure 12: North America Multi Piece Drive Shaft Volume (K), by Country 2025 & 2033
- Figure 13: North America Multi Piece Drive Shaft Revenue Share (%), by Country 2025 & 2033
- Figure 14: North America Multi Piece Drive Shaft Volume Share (%), by Country 2025 & 2033
- Figure 15: South America Multi Piece Drive Shaft Revenue (billion), by Application 2025 & 2033
- Figure 16: South America Multi Piece Drive Shaft Volume (K), by Application 2025 & 2033
- Figure 17: South America Multi Piece Drive Shaft Revenue Share (%), by Application 2025 & 2033
- Figure 18: South America Multi Piece Drive Shaft Volume Share (%), by Application 2025 & 2033
- Figure 19: South America Multi Piece Drive Shaft Revenue (billion), by Type 2025 & 2033
- Figure 20: South America Multi Piece Drive Shaft Volume (K), by Type 2025 & 2033
- Figure 21: South America Multi Piece Drive Shaft Revenue Share (%), by Type 2025 & 2033
- Figure 22: South America Multi Piece Drive Shaft Volume Share (%), by Type 2025 & 2033
- Figure 23: South America Multi Piece Drive Shaft Revenue (billion), by Country 2025 & 2033
- Figure 24: South America Multi Piece Drive Shaft Volume (K), by Country 2025 & 2033
- Figure 25: South America Multi Piece Drive Shaft Revenue Share (%), by Country 2025 & 2033
- Figure 26: South America Multi Piece Drive Shaft Volume Share (%), by Country 2025 & 2033
- Figure 27: Europe Multi Piece Drive Shaft Revenue (billion), by Application 2025 & 2033
- Figure 28: Europe Multi Piece Drive Shaft Volume (K), by Application 2025 & 2033
- Figure 29: Europe Multi Piece Drive Shaft Revenue Share (%), by Application 2025 & 2033
- Figure 30: Europe Multi Piece Drive Shaft Volume Share (%), by Application 2025 & 2033
- Figure 31: Europe Multi Piece Drive Shaft Revenue (billion), by Type 2025 & 2033
- Figure 32: Europe Multi Piece Drive Shaft Volume (K), by Type 2025 & 2033
- Figure 33: Europe Multi Piece Drive Shaft Revenue Share (%), by Type 2025 & 2033
- Figure 34: Europe Multi Piece Drive Shaft Volume Share (%), by Type 2025 & 2033
- Figure 35: Europe Multi Piece Drive Shaft Revenue (billion), by Country 2025 & 2033
- Figure 36: Europe Multi Piece Drive Shaft Volume (K), by Country 2025 & 2033
- Figure 37: Europe Multi Piece Drive Shaft Revenue Share (%), by Country 2025 & 2033
- Figure 38: Europe Multi Piece Drive Shaft Volume Share (%), by Country 2025 & 2033
- Figure 39: Middle East & Africa Multi Piece Drive Shaft Revenue (billion), by Application 2025 & 2033
- Figure 40: Middle East & Africa Multi Piece Drive Shaft Volume (K), by Application 2025 & 2033
- Figure 41: Middle East & Africa Multi Piece Drive Shaft Revenue Share (%), by Application 2025 & 2033
- Figure 42: Middle East & Africa Multi Piece Drive Shaft Volume Share (%), by Application 2025 & 2033
- Figure 43: Middle East & Africa Multi Piece Drive Shaft Revenue (billion), by Type 2025 & 2033
- Figure 44: Middle East & Africa Multi Piece Drive Shaft Volume (K), by Type 2025 & 2033
- Figure 45: Middle East & Africa Multi Piece Drive Shaft Revenue Share (%), by Type 2025 & 2033
- Figure 46: Middle East & Africa Multi Piece Drive Shaft Volume Share (%), by Type 2025 & 2033
- Figure 47: Middle East & Africa Multi Piece Drive Shaft Revenue (billion), by Country 2025 & 2033
- Figure 48: Middle East & Africa Multi Piece Drive Shaft Volume (K), by Country 2025 & 2033
- Figure 49: Middle East & Africa Multi Piece Drive Shaft Revenue Share (%), by Country 2025 & 2033
- Figure 50: Middle East & Africa Multi Piece Drive Shaft Volume Share (%), by Country 2025 & 2033
- Figure 51: Asia Pacific Multi Piece Drive Shaft Revenue (billion), by Application 2025 & 2033
- Figure 52: Asia Pacific Multi Piece Drive Shaft Volume (K), by Application 2025 & 2033
- Figure 53: Asia Pacific Multi Piece Drive Shaft Revenue Share (%), by Application 2025 & 2033
- Figure 54: Asia Pacific Multi Piece Drive Shaft Volume Share (%), by Application 2025 & 2033
- Figure 55: Asia Pacific Multi Piece Drive Shaft Revenue (billion), by Type 2025 & 2033
- Figure 56: Asia Pacific Multi Piece Drive Shaft Volume (K), by Type 2025 & 2033
- Figure 57: Asia Pacific Multi Piece Drive Shaft Revenue Share (%), by Type 2025 & 2033
- Figure 58: Asia Pacific Multi Piece Drive Shaft Volume Share (%), by Type 2025 & 2033
- Figure 59: Asia Pacific Multi Piece Drive Shaft Revenue (billion), by Country 2025 & 2033
- Figure 60: Asia Pacific Multi Piece Drive Shaft Volume (K), by Country 2025 & 2033
- Figure 61: Asia Pacific Multi Piece Drive Shaft Revenue Share (%), by Country 2025 & 2033
- Figure 62: Asia Pacific Multi Piece Drive Shaft Volume Share (%), by Country 2025 & 2033
List of Tables
- Table 1: Global Multi Piece Drive Shaft Revenue billion Forecast, by Application 2020 & 2033
- Table 2: Global Multi Piece Drive Shaft Volume K Forecast, by Application 2020 & 2033
- Table 3: Global Multi Piece Drive Shaft Revenue billion Forecast, by Type 2020 & 2033
- Table 4: Global Multi Piece Drive Shaft Volume K Forecast, by Type 2020 & 2033
- Table 5: Global Multi Piece Drive Shaft Revenue billion Forecast, by Region 2020 & 2033
- Table 6: Global Multi Piece Drive Shaft Volume K Forecast, by Region 2020 & 2033
- Table 7: Global Multi Piece Drive Shaft Revenue billion Forecast, by Application 2020 & 2033
- Table 8: Global Multi Piece Drive Shaft Volume K Forecast, by Application 2020 & 2033
- Table 9: Global Multi Piece Drive Shaft Revenue billion Forecast, by Type 2020 & 2033
- Table 10: Global Multi Piece Drive Shaft Volume K Forecast, by Type 2020 & 2033
- Table 11: Global Multi Piece Drive Shaft Revenue billion Forecast, by Country 2020 & 2033
- Table 12: Global Multi Piece Drive Shaft Volume K Forecast, by Country 2020 & 2033
- Table 13: United States Multi Piece Drive Shaft Revenue (billion) Forecast, by Application 2020 & 2033
- Table 14: United States Multi Piece Drive Shaft Volume (K) Forecast, by Application 2020 & 2033
- Table 15: Canada Multi Piece Drive Shaft Revenue (billion) Forecast, by Application 2020 & 2033
- Table 16: Canada Multi Piece Drive Shaft Volume (K) Forecast, by Application 2020 & 2033
- Table 17: Mexico Multi Piece Drive Shaft Revenue (billion) Forecast, by Application 2020 & 2033
- Table 18: Mexico Multi Piece Drive Shaft Volume (K) Forecast, by Application 2020 & 2033
- Table 19: Global Multi Piece Drive Shaft Revenue billion Forecast, by Application 2020 & 2033
- Table 20: Global Multi Piece Drive Shaft Volume K Forecast, by Application 2020 & 2033
- Table 21: Global Multi Piece Drive Shaft Revenue billion Forecast, by Type 2020 & 2033
- Table 22: Global Multi Piece Drive Shaft Volume K Forecast, by Type 2020 & 2033
- Table 23: Global Multi Piece Drive Shaft Revenue billion Forecast, by Country 2020 & 2033
- Table 24: Global Multi Piece Drive Shaft Volume K Forecast, by Country 2020 & 2033
- Table 25: Brazil Multi Piece Drive Shaft Revenue (billion) Forecast, by Application 2020 & 2033
- Table 26: Brazil Multi Piece Drive Shaft Volume (K) Forecast, by Application 2020 & 2033
- Table 27: Argentina Multi Piece Drive Shaft Revenue (billion) Forecast, by Application 2020 & 2033
- Table 28: Argentina Multi Piece Drive Shaft Volume (K) Forecast, by Application 2020 & 2033
- Table 29: Rest of South America Multi Piece Drive Shaft Revenue (billion) Forecast, by Application 2020 & 2033
- Table 30: Rest of South America Multi Piece Drive Shaft Volume (K) Forecast, by Application 2020 & 2033
- Table 31: Global Multi Piece Drive Shaft Revenue billion Forecast, by Application 2020 & 2033
- Table 32: Global Multi Piece Drive Shaft Volume K Forecast, by Application 2020 & 2033
- Table 33: Global Multi Piece Drive Shaft Revenue billion Forecast, by Type 2020 & 2033
- Table 34: Global Multi Piece Drive Shaft Volume K Forecast, by Type 2020 & 2033
- Table 35: Global Multi Piece Drive Shaft Revenue billion Forecast, by Country 2020 & 2033
- Table 36: Global Multi Piece Drive Shaft Volume K Forecast, by Country 2020 & 2033
- Table 37: United Kingdom Multi Piece Drive Shaft Revenue (billion) Forecast, by Application 2020 & 2033
- Table 38: United Kingdom Multi Piece Drive Shaft Volume (K) Forecast, by Application 2020 & 2033
- Table 39: Germany Multi Piece Drive Shaft Revenue (billion) Forecast, by Application 2020 & 2033
- Table 40: Germany Multi Piece Drive Shaft Volume (K) Forecast, by Application 2020 & 2033
- Table 41: France Multi Piece Drive Shaft Revenue (billion) Forecast, by Application 2020 & 2033
- Table 42: France Multi Piece Drive Shaft Volume (K) Forecast, by Application 2020 & 2033
- Table 43: Italy Multi Piece Drive Shaft Revenue (billion) Forecast, by Application 2020 & 2033
- Table 44: Italy Multi Piece Drive Shaft Volume (K) Forecast, by Application 2020 & 2033
- Table 45: Spain Multi Piece Drive Shaft Revenue (billion) Forecast, by Application 2020 & 2033
- Table 46: Spain Multi Piece Drive Shaft Volume (K) Forecast, by Application 2020 & 2033
- Table 47: Russia Multi Piece Drive Shaft Revenue (billion) Forecast, by Application 2020 & 2033
- Table 48: Russia Multi Piece Drive Shaft Volume (K) Forecast, by Application 2020 & 2033
- Table 49: Benelux Multi Piece Drive Shaft Revenue (billion) Forecast, by Application 2020 & 2033
- Table 50: Benelux Multi Piece Drive Shaft Volume (K) Forecast, by Application 2020 & 2033
- Table 51: Nordics Multi Piece Drive Shaft Revenue (billion) Forecast, by Application 2020 & 2033
- Table 52: Nordics Multi Piece Drive Shaft Volume (K) Forecast, by Application 2020 & 2033
- Table 53: Rest of Europe Multi Piece Drive Shaft Revenue (billion) Forecast, by Application 2020 & 2033
- Table 54: Rest of Europe Multi Piece Drive Shaft Volume (K) Forecast, by Application 2020 & 2033
- Table 55: Global Multi Piece Drive Shaft Revenue billion Forecast, by Application 2020 & 2033
- Table 56: Global Multi Piece Drive Shaft Volume K Forecast, by Application 2020 & 2033
- Table 57: Global Multi Piece Drive Shaft Revenue billion Forecast, by Type 2020 & 2033
- Table 58: Global Multi Piece Drive Shaft Volume K Forecast, by Type 2020 & 2033
- Table 59: Global Multi Piece Drive Shaft Revenue billion Forecast, by Country 2020 & 2033
- Table 60: Global Multi Piece Drive Shaft Volume K Forecast, by Country 2020 & 2033
- Table 61: Turkey Multi Piece Drive Shaft Revenue (billion) Forecast, by Application 2020 & 2033
- Table 62: Turkey Multi Piece Drive Shaft Volume (K) Forecast, by Application 2020 & 2033
- Table 63: Israel Multi Piece Drive Shaft Revenue (billion) Forecast, by Application 2020 & 2033
- Table 64: Israel Multi Piece Drive Shaft Volume (K) Forecast, by Application 2020 & 2033
- Table 65: GCC Multi Piece Drive Shaft Revenue (billion) Forecast, by Application 2020 & 2033
- Table 66: GCC Multi Piece Drive Shaft Volume (K) Forecast, by Application 2020 & 2033
- Table 67: North Africa Multi Piece Drive Shaft Revenue (billion) Forecast, by Application 2020 & 2033
- Table 68: North Africa Multi Piece Drive Shaft Volume (K) Forecast, by Application 2020 & 2033
- Table 69: South Africa Multi Piece Drive Shaft Revenue (billion) Forecast, by Application 2020 & 2033
- Table 70: South Africa Multi Piece Drive Shaft Volume (K) Forecast, by Application 2020 & 2033
- Table 71: Rest of Middle East & Africa Multi Piece Drive Shaft Revenue (billion) Forecast, by Application 2020 & 2033
- Table 72: Rest of Middle East & Africa Multi Piece Drive Shaft Volume (K) Forecast, by Application 2020 & 2033
- Table 73: Global Multi Piece Drive Shaft Revenue billion Forecast, by Application 2020 & 2033
- Table 74: Global Multi Piece Drive Shaft Volume K Forecast, by Application 2020 & 2033
- Table 75: Global Multi Piece Drive Shaft Revenue billion Forecast, by Type 2020 & 2033
- Table 76: Global Multi Piece Drive Shaft Volume K Forecast, by Type 2020 & 2033
- Table 77: Global Multi Piece Drive Shaft Revenue billion Forecast, by Country 2020 & 2033
- Table 78: Global Multi Piece Drive Shaft Volume K Forecast, by Country 2020 & 2033
- Table 79: China Multi Piece Drive Shaft Revenue (billion) Forecast, by Application 2020 & 2033
- Table 80: China Multi Piece Drive Shaft Volume (K) Forecast, by Application 2020 & 2033
- Table 81: India Multi Piece Drive Shaft Revenue (billion) Forecast, by Application 2020 & 2033
- Table 82: India Multi Piece Drive Shaft Volume (K) Forecast, by Application 2020 & 2033
- Table 83: Japan Multi Piece Drive Shaft Revenue (billion) Forecast, by Application 2020 & 2033
- Table 84: Japan Multi Piece Drive Shaft Volume (K) Forecast, by Application 2020 & 2033
- Table 85: South Korea Multi Piece Drive Shaft Revenue (billion) Forecast, by Application 2020 & 2033
- Table 86: South Korea Multi Piece Drive Shaft Volume (K) Forecast, by Application 2020 & 2033
- Table 87: ASEAN Multi Piece Drive Shaft Revenue (billion) Forecast, by Application 2020 & 2033
- Table 88: ASEAN Multi Piece Drive Shaft Volume (K) Forecast, by Application 2020 & 2033
- Table 89: Oceania Multi Piece Drive Shaft Revenue (billion) Forecast, by Application 2020 & 2033
- Table 90: Oceania Multi Piece Drive Shaft Volume (K) Forecast, by Application 2020 & 2033
- Table 91: Rest of Asia Pacific Multi Piece Drive Shaft Revenue (billion) Forecast, by Application 2020 & 2033
- Table 92: Rest of Asia Pacific Multi Piece Drive Shaft Volume (K) Forecast, by Application 2020 & 2033
Frequently Asked Questions
1. What is the projected Compound Annual Growth Rate (CAGR) of the Multi Piece Drive Shaft?
The projected CAGR is approximately 6.3%.
2. Which companies are prominent players in the Multi Piece Drive Shaft?
Key companies in the market include GKN, NTN, SDS, Dana, Nexteer, Hyundai-Wia, IFA Rotorion, Meritor, AAM, Neapco, JTEKT, Yuandong, Wanxiang, Showa, Lingyun, Guansheng, GNA Enterprises, Fawer, Hengli, Danchuan.
3. What are the main segments of the Multi Piece Drive Shaft?
The market segments include Application, Type.
4. Can you provide details about the market size?
The market size is estimated to be USD 80.46 billion as of 2022.
5. What are some drivers contributing to market growth?
N/A
6. What are the notable trends driving market growth?
N/A
7. Are there any restraints impacting market growth?
N/A
8. Can you provide examples of recent developments in the market?
N/A
9. What pricing options are available for accessing the report?
Pricing options include single-user, multi-user, and enterprise licenses priced at USD 3950.00, USD 5925.00, and USD 7900.00 respectively.
10. Is the market size provided in terms of value or volume?
The market size is provided in terms of value, measured in billion and volume, measured in K.
11. Are there any specific market keywords associated with the report?
Yes, the market keyword associated with the report is "Multi Piece Drive Shaft," which aids in identifying and referencing the specific market segment covered.
12. How do I determine which pricing option suits my needs best?
The pricing options vary based on user requirements and access needs. Individual users may opt for single-user licenses, while businesses requiring broader access may choose multi-user or enterprise licenses for cost-effective access to the report.
13. Are there any additional resources or data provided in the Multi Piece Drive Shaft report?
While the report offers comprehensive insights, it's advisable to review the specific contents or supplementary materials provided to ascertain if additional resources or data are available.
14. How can I stay updated on further developments or reports in the Multi Piece Drive Shaft?
To stay informed about further developments, trends, and reports in the Multi Piece Drive Shaft, consider subscribing to industry newsletters, following relevant companies and organizations, or regularly checking reputable industry news sources and publications.
Methodology
Step 1 - Identification of Relevant Samples Size from Population Database


Step 2 - Approaches for Defining Global Market Size (Value, Volume* & Price*)

Note*: In applicable scenarios
Step 3 - Data Sources
Primary Research
- Web Analytics
- Survey Reports
- Research Institute
- Latest Research Reports
- Opinion Leaders
Secondary Research
- Annual Reports
- White Paper
- Latest Press Release
- Industry Association
- Paid Database
- Investor Presentations

Step 4 - Data Triangulation
Involves using different sources of information in order to increase the validity of a study
These sources are likely to be stakeholders in a program - participants, other researchers, program staff, other community members, and so on.
Then we put all data in single framework & apply various statistical tools to find out the dynamic on the market.
During the analysis stage, feedback from the stakeholder groups would be compared to determine areas of agreement as well as areas of divergence