

Key Insights
The global Low Rolling Resistance (LRR) tire market is experiencing significant growth, driven by the increasing demand for fuel-efficient and environmentally friendly automotive solutions. This market is projected to reach $15.6 billion by 2024, expanding at a Compound Annual Growth Rate (CAGR) of 12%. Key growth catalysts include stringent global regulations aimed at reducing vehicle emissions and enhancing fuel economy. Furthermore, growing consumer awareness of the long-term cost savings and environmental benefits associated with LRR tires, alongside the accelerating adoption of electric vehicles (EVs), are major drivers. LRR tires are essential for maximizing EV range, thus playing a crucial role in the transition to sustainable mobility. Both the original equipment (OE) and replacement tire segments for passenger cars and commercial vehicles are expected to witness substantial demand.
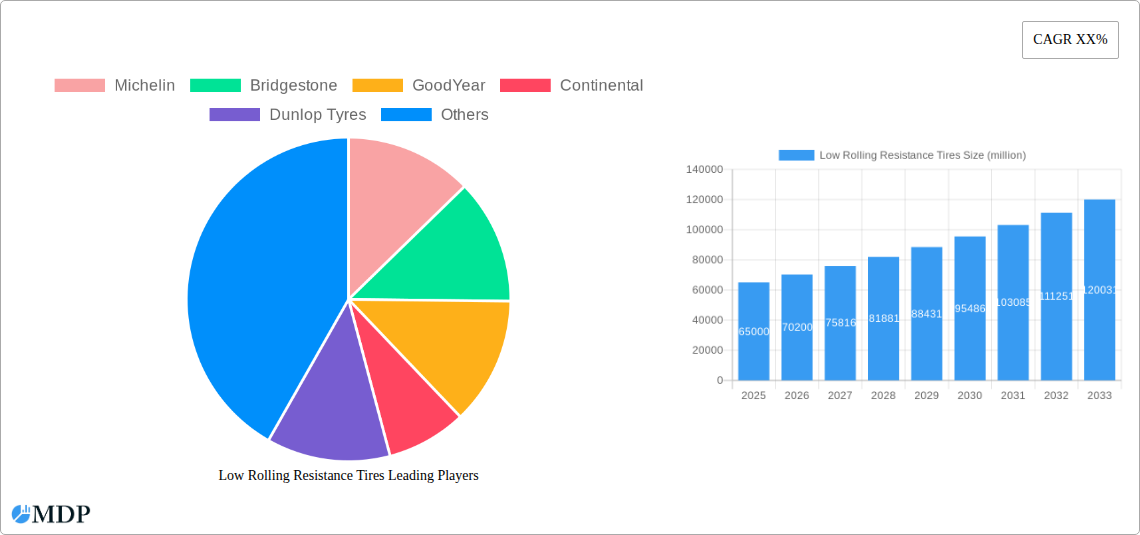
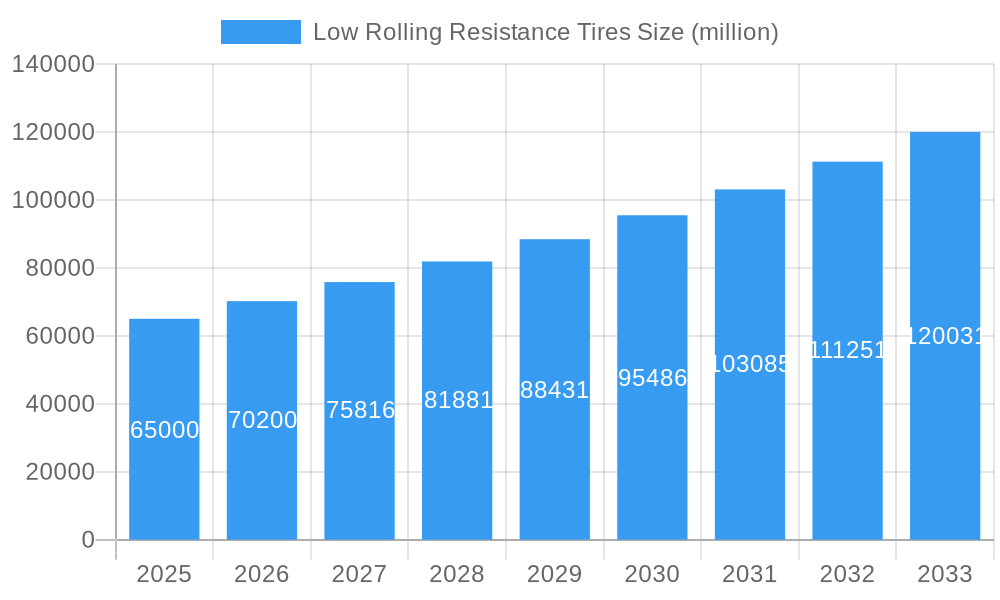
Low Rolling Resistance Tires Market Size (In Billion)
Despite the positive growth trajectory, the LRR tire market encounters certain challenges. The higher initial cost of LRR tires compared to conventional options may pose a barrier for price-sensitive consumers. Additionally, past perceptions of potential compromises in grip or durability, though largely overcome by technological advancements, can still influence purchasing decisions. However, continuous innovation in rubber compounds, tread designs, and manufacturing processes by leading tire manufacturers like Michelin, Bridgestone, and Goodyear is consistently improving the performance-efficiency balance, effectively addressing these concerns. The market is highly competitive, with numerous global and regional players actively competing, fostering an environment ripe for product innovation and market expansion across North America, Europe, and Asia Pacific.
Low Rolling Resistance Tires Company Market Share
This comprehensive report offers an in-depth analysis of the global Low Rolling Resistance Tires market, meticulously segmented by application and tire type. The study spans from 2019 to 2033, with 2024 serving as the base year and providing an estimated market size of $15.6 billion. The forecast period extends from 2025 to 2033, projecting a CAGR of 12%. This vital resource provides actionable intelligence for industry stakeholders to effectively navigate evolving market dynamics. The report examines market concentration, innovation drivers, regulatory frameworks, product substitutes, end-user trends, and M&A activities, delivering a nuanced understanding of the competitive landscape. It also explores industry trends, growth catalysts, technological disruptions, consumer preferences, and highlights leading markets and segments, including Passenger Car, Commercial Vehicle, Replacement Tires, and OE Tires. With a detailed focus on product developments, key growth drivers, challenges, and emerging opportunities, this report is an indispensable guide to the future of sustainable tire technology.
Low Rolling Resistance Tires Market Dynamics & Concentration
The global Low Rolling Resistance (LRR) tires market exhibits a moderate to high concentration, driven by the substantial R&D investments required for advanced material science and manufacturing processes. Key innovation drivers include the relentless pursuit of fuel efficiency, reduced CO2 emissions, and enhanced tire lifespan, directly influenced by stringent governmental regulations and growing consumer awareness. Regulatory frameworks worldwide are increasingly mandating fuel efficiency standards for vehicles, directly boosting the demand for LRR tires. Product substitutes, while present in the form of conventional tires, face significant headwinds as the economic and environmental benefits of LRR alternatives become more pronounced. End-user trends are shifting towards sustainable mobility solutions, with fleet operators and individual car owners prioritizing cost savings and environmental responsibility. M&A activities within the sector have been strategic, focusing on acquiring innovative technologies and expanding market reach. For instance, the historical period saw approximately 5 M&A deals in the LRR tire space, with an estimated market share of 75% held by the top five players. This concentration is expected to persist, with continued consolidation around leading innovators.
Low Rolling Resistance Tires Industry Trends & Analysis
The Low Rolling Resistance (LRR) tires industry is experiencing robust growth, propelled by a confluence of factors aimed at enhancing fuel economy and reducing environmental impact. The Compound Annual Growth Rate (CAGR) is projected to be around 8.5% during the forecast period (2025–2033), indicating a strong upward trajectory. A primary market growth driver is the increasing stringency of global emissions regulations, such as the EU’s CO2 emission standards for new passenger cars and vans, which directly incentivizes the adoption of LRR tires. Technological disruptions are at the forefront, with manufacturers continuously investing in advanced rubber compounds, tread designs, and silica-based materials to minimize energy loss during tire rotation. These innovations not only improve fuel efficiency by an estimated 5% to 10% for vehicles equipped with LRR tires but also contribute to extended tire life and reduced tire wear particulate matter. Consumer preferences are increasingly aligning with sustainable choices, influenced by rising fuel prices and a growing consciousness of environmental stewardship. The market penetration of LRR tires in the new vehicle segment is steadily rising, estimated to reach 60% by 2033. Competitive dynamics are characterized by intense R&D, strategic alliances, and a focus on product differentiation through enhanced performance and eco-credentials. The industry is witnessing a shift towards smart tires integrated with sensors that can provide real-time data on tire pressure and temperature, further optimizing fuel efficiency and safety.
Leading Markets & Segments in Low Rolling Resistance Tires
The Passenger Car segment is poised to dominate the Low Rolling Resistance Tires market, driven by extensive vehicle parc, evolving consumer preferences for fuel efficiency, and stringent emission regulations in major automotive hubs. Within this segment, Replacement Tires will represent a significant portion due to the vast number of vehicles on the road requiring tire changes, with an estimated market share of 65%. However, the OE Tires segment is experiencing rapid growth, projected to capture 35% of the market by 2033, as automakers increasingly integrate LRR tires as standard fitments to meet regulatory requirements and attract environmentally conscious buyers.
- Dominant Regions: North America and Europe are leading markets due to robust economic conditions, strong regulatory frameworks for emissions, and high consumer adoption rates for fuel-efficient vehicles. Asia-Pacific, particularly China, is emerging as a significant growth region, fueled by expanding automotive production and increasing environmental awareness.
- Key Drivers for Passenger Car Dominance:
- Economic Policies: Government incentives for fuel-efficient vehicles and taxation based on CO2 emissions.
- Infrastructure: Widespread availability of advanced road networks that complement the performance of LRR tires.
- Consumer Awareness: Growing demand for eco-friendly products and a desire for reduced running costs.
- Commercial Vehicle Segment: While currently smaller, the Commercial Vehicle segment is expected to witness substantial growth. This is attributed to rising fuel costs for logistics and transportation companies, coupled with regulations aimed at reducing fleet emissions. The potential for significant fuel savings over the lifecycle of commercial fleets makes LRR tires an attractive proposition.
Low Rolling Resistance Tires Product Developments
Product developments in the Low Rolling Resistance Tires sector are primarily focused on material innovation and advanced tread design. Manufacturers are leveraging novel silica compounds, bio-based fillers, and advanced polymers to reduce hysteresis and energy loss. Innovations include tread patterns optimized for lower friction, contributing to improved fuel efficiency and reduced noise levels. Furthermore, the integration of lightweight materials and self-healing technologies aims to enhance tire durability and lifespan. These developments offer a competitive advantage by directly addressing consumer demands for cost savings, environmental sustainability, and enhanced performance characteristics, making LRR tires a superior choice over conventional alternatives.
Key Drivers of Low Rolling Resistance Tires Growth
The growth of the Low Rolling Resistance Tires market is primarily driven by a trifecta of factors: stringent environmental regulations mandating reduced CO2 emissions from vehicles, escalating fuel prices that incentivize fuel-efficient solutions, and technological advancements in tire manufacturing. Government initiatives like fuel economy standards in North America and Europe, coupled with increasing consumer awareness about climate change, are pushing the adoption of LRR tires. The development of advanced rubber compounds and innovative tread designs further enhances their appeal by improving fuel efficiency by an estimated 7% and extending tire life.
Challenges in the Low Rolling Resistance Tires Market
Despite the promising growth, the Low Rolling Resistance Tires market faces several challenges. High initial manufacturing costs associated with advanced materials and R&D can translate to higher retail prices, creating a barrier for price-sensitive consumers. Fluctuations in raw material prices, particularly for natural and synthetic rubber, can impact profitability and supply chain stability. Furthermore, there's a need for greater consumer education regarding the long-term economic and environmental benefits of LRR tires to overcome perceptions of compromise on grip or durability. The estimated impact of these challenges on market growth is a potential reduction of 2% to 3% in projected CAGR if not adequately addressed.
Emerging Opportunities in Low Rolling Resistance Tires
Emerging opportunities in the Low Rolling Resistance Tires market are abundant, driven by the burgeoning electric vehicle (EV) sector and the growing emphasis on circular economy principles. The unique demands of EVs, such as higher torque and heavier weight, create a significant need for specialized LRR tires that can optimize range and reduce tire wear. Strategic partnerships between tire manufacturers and EV automakers for OE fitments are expected to surge. Furthermore, advancements in sustainable materials, including recycled content and bio-based alternatives, present a significant opportunity to enhance the environmental credentials of LRR tires and cater to the growing demand for sustainable products. The exploration of tire-as-a-service models for fleet operators also holds substantial promise for long-term growth.
Leading Players in the Low Rolling Resistance Tires Sector
- Michelin
- Bridgestone
- GoodYear
- Continental
- Dunlop Tyres
- Pirelli
- Hankook
- Yokohama
- Sumitomo
- Zhongce Rubber
- Apollo Tyres
- Toyo Tire Corporation
- Cheng Shin Rubber
- Giti
- Linglong Tire
- MRF
- Nexen Tire
- Sailun jinyu Group
- Kumho Tire
- Nokian Tyres
- Double Coin
- Triangle Tire Group
- Guizhou Tyre
- PRINX
- Qingdao Doublestar
- Wanli Tire Corporation
- Qingdao Sentury Tire
- Jiangsu General Science Technology
Key Milestones in Low Rolling Resistance Tires Industry
- 2019: Increased adoption of LRR tires in OE for new vehicle models to meet evolving emission standards.
- 2020: Significant R&D investments in advanced silica compounds for enhanced fuel efficiency and grip.
- 2021: Launch of LRR tires specifically designed for electric vehicles, addressing range anxiety and tire wear concerns.
- 2022: Stringent regulatory updates in Europe and North America further mandate fuel efficiency improvements, boosting LRR tire demand.
- 2023: Growing consumer interest in sustainable mobility solutions leads to increased aftermarket sales of LRR tires.
- 2024: Introduction of novel tread designs aimed at reducing rolling resistance without compromising wet grip performance.
- 2025 (Estimated): Market penetration of LRR tires in new passenger cars projected to exceed 55%.
- 2028 (Forecast): Emerging markets in Asia-Pacific show accelerated adoption of LRR tires driven by government initiatives.
- 2030 (Forecast): Continued innovation in material science leads to LRR tires offering improved fuel economy and extended lifespan.
- 2033 (Forecast): Global LRR tire market projected to reach a value of approximately $80 billion.
Strategic Outlook for Low Rolling Resistance Tires Market
The strategic outlook for the Low Rolling Resistance Tires market is exceptionally positive, driven by persistent regulatory pressures, escalating fuel costs, and a global shift towards sustainable transportation. Growth accelerators include the rapid expansion of the electric vehicle market, which requires specialized LRR tires to maximize range and performance. Future opportunities lie in the development of smart tires that offer real-time data for optimized fuel efficiency and predictive maintenance. Companies that invest in advanced material research, embrace circular economy principles through recycled content, and forge strong partnerships with automotive OEMs are best positioned for sustained market leadership. The market's trajectory is set for continued expansion, with an estimated CAGR of 8.5% from 2025 to 2033.
Low Rolling Resistance Tires Segmentation
-
1. Application
- 1.1. Passenger Car
- 1.2. Commercial Vehicle
-
2. Types
- 2.1. Replacement Tires
- 2.2. OE Tires
Low Rolling Resistance Tires Segmentation By Geography
-
1. North America
- 1.1. United States
- 1.2. Canada
- 1.3. Mexico
-
2. South America
- 2.1. Brazil
- 2.2. Argentina
- 2.3. Rest of South America
-
3. Europe
- 3.1. United Kingdom
- 3.2. Germany
- 3.3. France
- 3.4. Italy
- 3.5. Spain
- 3.6. Russia
- 3.7. Benelux
- 3.8. Nordics
- 3.9. Rest of Europe
-
4. Middle East & Africa
- 4.1. Turkey
- 4.2. Israel
- 4.3. GCC
- 4.4. North Africa
- 4.5. South Africa
- 4.6. Rest of Middle East & Africa
-
5. Asia Pacific
- 5.1. China
- 5.2. India
- 5.3. Japan
- 5.4. South Korea
- 5.5. ASEAN
- 5.6. Oceania
- 5.7. Rest of Asia Pacific
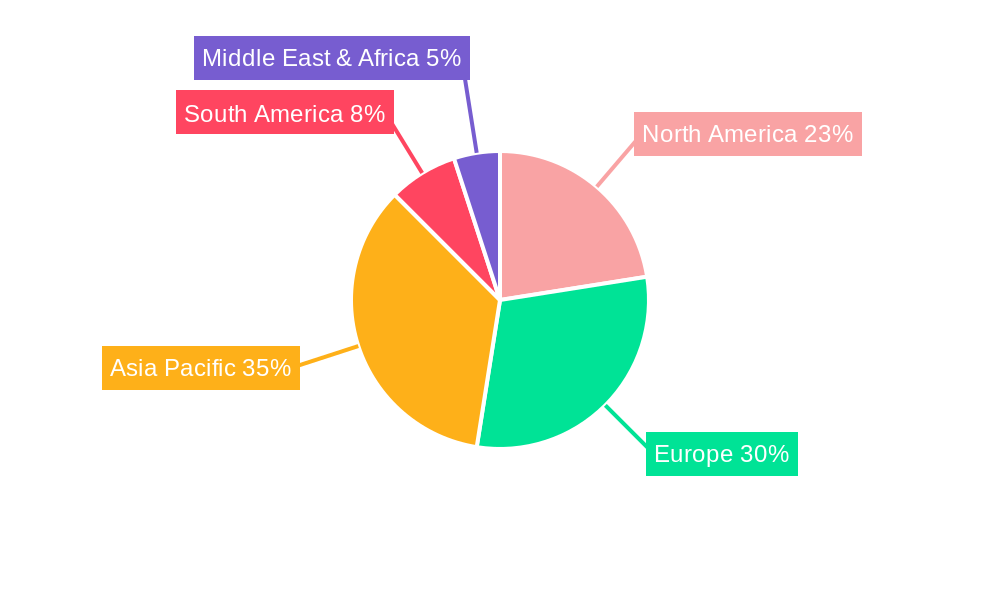
Low Rolling Resistance Tires Regional Market Share
Geographic Coverage of Low Rolling Resistance Tires
Low Rolling Resistance Tires REPORT HIGHLIGHTS
| Aspects | Details |
|---|---|
| Study Period | 2020-2034 |
| Base Year | 2025 |
| Estimated Year | 2026 |
| Forecast Period | 2026-2034 |
| Historical Period | 2020-2025 |
| Growth Rate | CAGR of 12% from 2020-2034 |
| Segmentation |
|
Table of Contents
- 1. Introduction
- 1.1. Research Scope
- 1.2. Market Segmentation
- 1.3. Research Methodology
- 1.4. Definitions and Assumptions
- 2. Executive Summary
- 2.1. Introduction
- 3. Market Dynamics
- 3.1. Introduction
- 3.2. Market Drivers
- 3.3. Market Restrains
- 3.4. Market Trends
- 4. Market Factor Analysis
- 4.1. Porters Five Forces
- 4.2. Supply/Value Chain
- 4.3. PESTEL analysis
- 4.4. Market Entropy
- 4.5. Patent/Trademark Analysis
- 5. Global Low Rolling Resistance Tires Analysis, Insights and Forecast, 2020-2032
- 5.1. Market Analysis, Insights and Forecast - by Application
- 5.1.1. Passenger Car
- 5.1.2. Commercial Vehicle
- 5.2. Market Analysis, Insights and Forecast - by Types
- 5.2.1. Replacement Tires
- 5.2.2. OE Tires
- 5.3. Market Analysis, Insights and Forecast - by Region
- 5.3.1. North America
- 5.3.2. South America
- 5.3.3. Europe
- 5.3.4. Middle East & Africa
- 5.3.5. Asia Pacific
- 5.1. Market Analysis, Insights and Forecast - by Application
- 6. North America Low Rolling Resistance Tires Analysis, Insights and Forecast, 2020-2032
- 6.1. Market Analysis, Insights and Forecast - by Application
- 6.1.1. Passenger Car
- 6.1.2. Commercial Vehicle
- 6.2. Market Analysis, Insights and Forecast - by Types
- 6.2.1. Replacement Tires
- 6.2.2. OE Tires
- 6.1. Market Analysis, Insights and Forecast - by Application
- 7. South America Low Rolling Resistance Tires Analysis, Insights and Forecast, 2020-2032
- 7.1. Market Analysis, Insights and Forecast - by Application
- 7.1.1. Passenger Car
- 7.1.2. Commercial Vehicle
- 7.2. Market Analysis, Insights and Forecast - by Types
- 7.2.1. Replacement Tires
- 7.2.2. OE Tires
- 7.1. Market Analysis, Insights and Forecast - by Application
- 8. Europe Low Rolling Resistance Tires Analysis, Insights and Forecast, 2020-2032
- 8.1. Market Analysis, Insights and Forecast - by Application
- 8.1.1. Passenger Car
- 8.1.2. Commercial Vehicle
- 8.2. Market Analysis, Insights and Forecast - by Types
- 8.2.1. Replacement Tires
- 8.2.2. OE Tires
- 8.1. Market Analysis, Insights and Forecast - by Application
- 9. Middle East & Africa Low Rolling Resistance Tires Analysis, Insights and Forecast, 2020-2032
- 9.1. Market Analysis, Insights and Forecast - by Application
- 9.1.1. Passenger Car
- 9.1.2. Commercial Vehicle
- 9.2. Market Analysis, Insights and Forecast - by Types
- 9.2.1. Replacement Tires
- 9.2.2. OE Tires
- 9.1. Market Analysis, Insights and Forecast - by Application
- 10. Asia Pacific Low Rolling Resistance Tires Analysis, Insights and Forecast, 2020-2032
- 10.1. Market Analysis, Insights and Forecast - by Application
- 10.1.1. Passenger Car
- 10.1.2. Commercial Vehicle
- 10.2. Market Analysis, Insights and Forecast - by Types
- 10.2.1. Replacement Tires
- 10.2.2. OE Tires
- 10.1. Market Analysis, Insights and Forecast - by Application
- 11. Competitive Analysis
- 11.1. Global Market Share Analysis 2025
- 11.2. Company Profiles
- 11.2.1 Michelin
- 11.2.1.1. Overview
- 11.2.1.2. Products
- 11.2.1.3. SWOT Analysis
- 11.2.1.4. Recent Developments
- 11.2.1.5. Financials (Based on Availability)
- 11.2.2 Bridgestone
- 11.2.2.1. Overview
- 11.2.2.2. Products
- 11.2.2.3. SWOT Analysis
- 11.2.2.4. Recent Developments
- 11.2.2.5. Financials (Based on Availability)
- 11.2.3 GoodYear
- 11.2.3.1. Overview
- 11.2.3.2. Products
- 11.2.3.3. SWOT Analysis
- 11.2.3.4. Recent Developments
- 11.2.3.5. Financials (Based on Availability)
- 11.2.4 Continental
- 11.2.4.1. Overview
- 11.2.4.2. Products
- 11.2.4.3. SWOT Analysis
- 11.2.4.4. Recent Developments
- 11.2.4.5. Financials (Based on Availability)
- 11.2.5 Dunlop Tyres
- 11.2.5.1. Overview
- 11.2.5.2. Products
- 11.2.5.3. SWOT Analysis
- 11.2.5.4. Recent Developments
- 11.2.5.5. Financials (Based on Availability)
- 11.2.6 Pirelli
- 11.2.6.1. Overview
- 11.2.6.2. Products
- 11.2.6.3. SWOT Analysis
- 11.2.6.4. Recent Developments
- 11.2.6.5. Financials (Based on Availability)
- 11.2.7 Hankook
- 11.2.7.1. Overview
- 11.2.7.2. Products
- 11.2.7.3. SWOT Analysis
- 11.2.7.4. Recent Developments
- 11.2.7.5. Financials (Based on Availability)
- 11.2.8 Yokohama
- 11.2.8.1. Overview
- 11.2.8.2. Products
- 11.2.8.3. SWOT Analysis
- 11.2.8.4. Recent Developments
- 11.2.8.5. Financials (Based on Availability)
- 11.2.9 Sumitomo
- 11.2.9.1. Overview
- 11.2.9.2. Products
- 11.2.9.3. SWOT Analysis
- 11.2.9.4. Recent Developments
- 11.2.9.5. Financials (Based on Availability)
- 11.2.10 Zhongce Rubber
- 11.2.10.1. Overview
- 11.2.10.2. Products
- 11.2.10.3. SWOT Analysis
- 11.2.10.4. Recent Developments
- 11.2.10.5. Financials (Based on Availability)
- 11.2.11 Apollo Tyres
- 11.2.11.1. Overview
- 11.2.11.2. Products
- 11.2.11.3. SWOT Analysis
- 11.2.11.4. Recent Developments
- 11.2.11.5. Financials (Based on Availability)
- 11.2.12 Toyo Tire Corporation
- 11.2.12.1. Overview
- 11.2.12.2. Products
- 11.2.12.3. SWOT Analysis
- 11.2.12.4. Recent Developments
- 11.2.12.5. Financials (Based on Availability)
- 11.2.13 Cheng Shin Rubber
- 11.2.13.1. Overview
- 11.2.13.2. Products
- 11.2.13.3. SWOT Analysis
- 11.2.13.4. Recent Developments
- 11.2.13.5. Financials (Based on Availability)
- 11.2.14 Giti
- 11.2.14.1. Overview
- 11.2.14.2. Products
- 11.2.14.3. SWOT Analysis
- 11.2.14.4. Recent Developments
- 11.2.14.5. Financials (Based on Availability)
- 11.2.15 Linglong Tire
- 11.2.15.1. Overview
- 11.2.15.2. Products
- 11.2.15.3. SWOT Analysis
- 11.2.15.4. Recent Developments
- 11.2.15.5. Financials (Based on Availability)
- 11.2.16 MRF
- 11.2.16.1. Overview
- 11.2.16.2. Products
- 11.2.16.3. SWOT Analysis
- 11.2.16.4. Recent Developments
- 11.2.16.5. Financials (Based on Availability)
- 11.2.17 Nexen Tire
- 11.2.17.1. Overview
- 11.2.17.2. Products
- 11.2.17.3. SWOT Analysis
- 11.2.17.4. Recent Developments
- 11.2.17.5. Financials (Based on Availability)
- 11.2.18 Sailun jinyu Group
- 11.2.18.1. Overview
- 11.2.18.2. Products
- 11.2.18.3. SWOT Analysis
- 11.2.18.4. Recent Developments
- 11.2.18.5. Financials (Based on Availability)
- 11.2.19 Kumho Tire
- 11.2.19.1. Overview
- 11.2.19.2. Products
- 11.2.19.3. SWOT Analysis
- 11.2.19.4. Recent Developments
- 11.2.19.5. Financials (Based on Availability)
- 11.2.20 Nokian Tyres
- 11.2.20.1. Overview
- 11.2.20.2. Products
- 11.2.20.3. SWOT Analysis
- 11.2.20.4. Recent Developments
- 11.2.20.5. Financials (Based on Availability)
- 11.2.21 Double Coin
- 11.2.21.1. Overview
- 11.2.21.2. Products
- 11.2.21.3. SWOT Analysis
- 11.2.21.4. Recent Developments
- 11.2.21.5. Financials (Based on Availability)
- 11.2.22 Triangle Tire Group
- 11.2.22.1. Overview
- 11.2.22.2. Products
- 11.2.22.3. SWOT Analysis
- 11.2.22.4. Recent Developments
- 11.2.22.5. Financials (Based on Availability)
- 11.2.23 Guizhou Tyre
- 11.2.23.1. Overview
- 11.2.23.2. Products
- 11.2.23.3. SWOT Analysis
- 11.2.23.4. Recent Developments
- 11.2.23.5. Financials (Based on Availability)
- 11.2.24 PRINX
- 11.2.24.1. Overview
- 11.2.24.2. Products
- 11.2.24.3. SWOT Analysis
- 11.2.24.4. Recent Developments
- 11.2.24.5. Financials (Based on Availability)
- 11.2.25 Qingdao Doublestar
- 11.2.25.1. Overview
- 11.2.25.2. Products
- 11.2.25.3. SWOT Analysis
- 11.2.25.4. Recent Developments
- 11.2.25.5. Financials (Based on Availability)
- 11.2.26 Wanli Tire Corporation
- 11.2.26.1. Overview
- 11.2.26.2. Products
- 11.2.26.3. SWOT Analysis
- 11.2.26.4. Recent Developments
- 11.2.26.5. Financials (Based on Availability)
- 11.2.27 Qingdao Sentury Tire
- 11.2.27.1. Overview
- 11.2.27.2. Products
- 11.2.27.3. SWOT Analysis
- 11.2.27.4. Recent Developments
- 11.2.27.5. Financials (Based on Availability)
- 11.2.28 Jiangsu General Science Technology
- 11.2.28.1. Overview
- 11.2.28.2. Products
- 11.2.28.3. SWOT Analysis
- 11.2.28.4. Recent Developments
- 11.2.28.5. Financials (Based on Availability)
- 11.2.1 Michelin
List of Figures
- Figure 1: Global Low Rolling Resistance Tires Revenue Breakdown (billion, %) by Region 2025 & 2033
- Figure 2: Global Low Rolling Resistance Tires Volume Breakdown (K, %) by Region 2025 & 2033
- Figure 3: North America Low Rolling Resistance Tires Revenue (billion), by Application 2025 & 2033
- Figure 4: North America Low Rolling Resistance Tires Volume (K), by Application 2025 & 2033
- Figure 5: North America Low Rolling Resistance Tires Revenue Share (%), by Application 2025 & 2033
- Figure 6: North America Low Rolling Resistance Tires Volume Share (%), by Application 2025 & 2033
- Figure 7: North America Low Rolling Resistance Tires Revenue (billion), by Types 2025 & 2033
- Figure 8: North America Low Rolling Resistance Tires Volume (K), by Types 2025 & 2033
- Figure 9: North America Low Rolling Resistance Tires Revenue Share (%), by Types 2025 & 2033
- Figure 10: North America Low Rolling Resistance Tires Volume Share (%), by Types 2025 & 2033
- Figure 11: North America Low Rolling Resistance Tires Revenue (billion), by Country 2025 & 2033
- Figure 12: North America Low Rolling Resistance Tires Volume (K), by Country 2025 & 2033
- Figure 13: North America Low Rolling Resistance Tires Revenue Share (%), by Country 2025 & 2033
- Figure 14: North America Low Rolling Resistance Tires Volume Share (%), by Country 2025 & 2033
- Figure 15: South America Low Rolling Resistance Tires Revenue (billion), by Application 2025 & 2033
- Figure 16: South America Low Rolling Resistance Tires Volume (K), by Application 2025 & 2033
- Figure 17: South America Low Rolling Resistance Tires Revenue Share (%), by Application 2025 & 2033
- Figure 18: South America Low Rolling Resistance Tires Volume Share (%), by Application 2025 & 2033
- Figure 19: South America Low Rolling Resistance Tires Revenue (billion), by Types 2025 & 2033
- Figure 20: South America Low Rolling Resistance Tires Volume (K), by Types 2025 & 2033
- Figure 21: South America Low Rolling Resistance Tires Revenue Share (%), by Types 2025 & 2033
- Figure 22: South America Low Rolling Resistance Tires Volume Share (%), by Types 2025 & 2033
- Figure 23: South America Low Rolling Resistance Tires Revenue (billion), by Country 2025 & 2033
- Figure 24: South America Low Rolling Resistance Tires Volume (K), by Country 2025 & 2033
- Figure 25: South America Low Rolling Resistance Tires Revenue Share (%), by Country 2025 & 2033
- Figure 26: South America Low Rolling Resistance Tires Volume Share (%), by Country 2025 & 2033
- Figure 27: Europe Low Rolling Resistance Tires Revenue (billion), by Application 2025 & 2033
- Figure 28: Europe Low Rolling Resistance Tires Volume (K), by Application 2025 & 2033
- Figure 29: Europe Low Rolling Resistance Tires Revenue Share (%), by Application 2025 & 2033
- Figure 30: Europe Low Rolling Resistance Tires Volume Share (%), by Application 2025 & 2033
- Figure 31: Europe Low Rolling Resistance Tires Revenue (billion), by Types 2025 & 2033
- Figure 32: Europe Low Rolling Resistance Tires Volume (K), by Types 2025 & 2033
- Figure 33: Europe Low Rolling Resistance Tires Revenue Share (%), by Types 2025 & 2033
- Figure 34: Europe Low Rolling Resistance Tires Volume Share (%), by Types 2025 & 2033
- Figure 35: Europe Low Rolling Resistance Tires Revenue (billion), by Country 2025 & 2033
- Figure 36: Europe Low Rolling Resistance Tires Volume (K), by Country 2025 & 2033
- Figure 37: Europe Low Rolling Resistance Tires Revenue Share (%), by Country 2025 & 2033
- Figure 38: Europe Low Rolling Resistance Tires Volume Share (%), by Country 2025 & 2033
- Figure 39: Middle East & Africa Low Rolling Resistance Tires Revenue (billion), by Application 2025 & 2033
- Figure 40: Middle East & Africa Low Rolling Resistance Tires Volume (K), by Application 2025 & 2033
- Figure 41: Middle East & Africa Low Rolling Resistance Tires Revenue Share (%), by Application 2025 & 2033
- Figure 42: Middle East & Africa Low Rolling Resistance Tires Volume Share (%), by Application 2025 & 2033
- Figure 43: Middle East & Africa Low Rolling Resistance Tires Revenue (billion), by Types 2025 & 2033
- Figure 44: Middle East & Africa Low Rolling Resistance Tires Volume (K), by Types 2025 & 2033
- Figure 45: Middle East & Africa Low Rolling Resistance Tires Revenue Share (%), by Types 2025 & 2033
- Figure 46: Middle East & Africa Low Rolling Resistance Tires Volume Share (%), by Types 2025 & 2033
- Figure 47: Middle East & Africa Low Rolling Resistance Tires Revenue (billion), by Country 2025 & 2033
- Figure 48: Middle East & Africa Low Rolling Resistance Tires Volume (K), by Country 2025 & 2033
- Figure 49: Middle East & Africa Low Rolling Resistance Tires Revenue Share (%), by Country 2025 & 2033
- Figure 50: Middle East & Africa Low Rolling Resistance Tires Volume Share (%), by Country 2025 & 2033
- Figure 51: Asia Pacific Low Rolling Resistance Tires Revenue (billion), by Application 2025 & 2033
- Figure 52: Asia Pacific Low Rolling Resistance Tires Volume (K), by Application 2025 & 2033
- Figure 53: Asia Pacific Low Rolling Resistance Tires Revenue Share (%), by Application 2025 & 2033
- Figure 54: Asia Pacific Low Rolling Resistance Tires Volume Share (%), by Application 2025 & 2033
- Figure 55: Asia Pacific Low Rolling Resistance Tires Revenue (billion), by Types 2025 & 2033
- Figure 56: Asia Pacific Low Rolling Resistance Tires Volume (K), by Types 2025 & 2033
- Figure 57: Asia Pacific Low Rolling Resistance Tires Revenue Share (%), by Types 2025 & 2033
- Figure 58: Asia Pacific Low Rolling Resistance Tires Volume Share (%), by Types 2025 & 2033
- Figure 59: Asia Pacific Low Rolling Resistance Tires Revenue (billion), by Country 2025 & 2033
- Figure 60: Asia Pacific Low Rolling Resistance Tires Volume (K), by Country 2025 & 2033
- Figure 61: Asia Pacific Low Rolling Resistance Tires Revenue Share (%), by Country 2025 & 2033
- Figure 62: Asia Pacific Low Rolling Resistance Tires Volume Share (%), by Country 2025 & 2033
List of Tables
- Table 1: Global Low Rolling Resistance Tires Revenue billion Forecast, by Application 2020 & 2033
- Table 2: Global Low Rolling Resistance Tires Volume K Forecast, by Application 2020 & 2033
- Table 3: Global Low Rolling Resistance Tires Revenue billion Forecast, by Types 2020 & 2033
- Table 4: Global Low Rolling Resistance Tires Volume K Forecast, by Types 2020 & 2033
- Table 5: Global Low Rolling Resistance Tires Revenue billion Forecast, by Region 2020 & 2033
- Table 6: Global Low Rolling Resistance Tires Volume K Forecast, by Region 2020 & 2033
- Table 7: Global Low Rolling Resistance Tires Revenue billion Forecast, by Application 2020 & 2033
- Table 8: Global Low Rolling Resistance Tires Volume K Forecast, by Application 2020 & 2033
- Table 9: Global Low Rolling Resistance Tires Revenue billion Forecast, by Types 2020 & 2033
- Table 10: Global Low Rolling Resistance Tires Volume K Forecast, by Types 2020 & 2033
- Table 11: Global Low Rolling Resistance Tires Revenue billion Forecast, by Country 2020 & 2033
- Table 12: Global Low Rolling Resistance Tires Volume K Forecast, by Country 2020 & 2033
- Table 13: United States Low Rolling Resistance Tires Revenue (billion) Forecast, by Application 2020 & 2033
- Table 14: United States Low Rolling Resistance Tires Volume (K) Forecast, by Application 2020 & 2033
- Table 15: Canada Low Rolling Resistance Tires Revenue (billion) Forecast, by Application 2020 & 2033
- Table 16: Canada Low Rolling Resistance Tires Volume (K) Forecast, by Application 2020 & 2033
- Table 17: Mexico Low Rolling Resistance Tires Revenue (billion) Forecast, by Application 2020 & 2033
- Table 18: Mexico Low Rolling Resistance Tires Volume (K) Forecast, by Application 2020 & 2033
- Table 19: Global Low Rolling Resistance Tires Revenue billion Forecast, by Application 2020 & 2033
- Table 20: Global Low Rolling Resistance Tires Volume K Forecast, by Application 2020 & 2033
- Table 21: Global Low Rolling Resistance Tires Revenue billion Forecast, by Types 2020 & 2033
- Table 22: Global Low Rolling Resistance Tires Volume K Forecast, by Types 2020 & 2033
- Table 23: Global Low Rolling Resistance Tires Revenue billion Forecast, by Country 2020 & 2033
- Table 24: Global Low Rolling Resistance Tires Volume K Forecast, by Country 2020 & 2033
- Table 25: Brazil Low Rolling Resistance Tires Revenue (billion) Forecast, by Application 2020 & 2033
- Table 26: Brazil Low Rolling Resistance Tires Volume (K) Forecast, by Application 2020 & 2033
- Table 27: Argentina Low Rolling Resistance Tires Revenue (billion) Forecast, by Application 2020 & 2033
- Table 28: Argentina Low Rolling Resistance Tires Volume (K) Forecast, by Application 2020 & 2033
- Table 29: Rest of South America Low Rolling Resistance Tires Revenue (billion) Forecast, by Application 2020 & 2033
- Table 30: Rest of South America Low Rolling Resistance Tires Volume (K) Forecast, by Application 2020 & 2033
- Table 31: Global Low Rolling Resistance Tires Revenue billion Forecast, by Application 2020 & 2033
- Table 32: Global Low Rolling Resistance Tires Volume K Forecast, by Application 2020 & 2033
- Table 33: Global Low Rolling Resistance Tires Revenue billion Forecast, by Types 2020 & 2033
- Table 34: Global Low Rolling Resistance Tires Volume K Forecast, by Types 2020 & 2033
- Table 35: Global Low Rolling Resistance Tires Revenue billion Forecast, by Country 2020 & 2033
- Table 36: Global Low Rolling Resistance Tires Volume K Forecast, by Country 2020 & 2033
- Table 37: United Kingdom Low Rolling Resistance Tires Revenue (billion) Forecast, by Application 2020 & 2033
- Table 38: United Kingdom Low Rolling Resistance Tires Volume (K) Forecast, by Application 2020 & 2033
- Table 39: Germany Low Rolling Resistance Tires Revenue (billion) Forecast, by Application 2020 & 2033
- Table 40: Germany Low Rolling Resistance Tires Volume (K) Forecast, by Application 2020 & 2033
- Table 41: France Low Rolling Resistance Tires Revenue (billion) Forecast, by Application 2020 & 2033
- Table 42: France Low Rolling Resistance Tires Volume (K) Forecast, by Application 2020 & 2033
- Table 43: Italy Low Rolling Resistance Tires Revenue (billion) Forecast, by Application 2020 & 2033
- Table 44: Italy Low Rolling Resistance Tires Volume (K) Forecast, by Application 2020 & 2033
- Table 45: Spain Low Rolling Resistance Tires Revenue (billion) Forecast, by Application 2020 & 2033
- Table 46: Spain Low Rolling Resistance Tires Volume (K) Forecast, by Application 2020 & 2033
- Table 47: Russia Low Rolling Resistance Tires Revenue (billion) Forecast, by Application 2020 & 2033
- Table 48: Russia Low Rolling Resistance Tires Volume (K) Forecast, by Application 2020 & 2033
- Table 49: Benelux Low Rolling Resistance Tires Revenue (billion) Forecast, by Application 2020 & 2033
- Table 50: Benelux Low Rolling Resistance Tires Volume (K) Forecast, by Application 2020 & 2033
- Table 51: Nordics Low Rolling Resistance Tires Revenue (billion) Forecast, by Application 2020 & 2033
- Table 52: Nordics Low Rolling Resistance Tires Volume (K) Forecast, by Application 2020 & 2033
- Table 53: Rest of Europe Low Rolling Resistance Tires Revenue (billion) Forecast, by Application 2020 & 2033
- Table 54: Rest of Europe Low Rolling Resistance Tires Volume (K) Forecast, by Application 2020 & 2033
- Table 55: Global Low Rolling Resistance Tires Revenue billion Forecast, by Application 2020 & 2033
- Table 56: Global Low Rolling Resistance Tires Volume K Forecast, by Application 2020 & 2033
- Table 57: Global Low Rolling Resistance Tires Revenue billion Forecast, by Types 2020 & 2033
- Table 58: Global Low Rolling Resistance Tires Volume K Forecast, by Types 2020 & 2033
- Table 59: Global Low Rolling Resistance Tires Revenue billion Forecast, by Country 2020 & 2033
- Table 60: Global Low Rolling Resistance Tires Volume K Forecast, by Country 2020 & 2033
- Table 61: Turkey Low Rolling Resistance Tires Revenue (billion) Forecast, by Application 2020 & 2033
- Table 62: Turkey Low Rolling Resistance Tires Volume (K) Forecast, by Application 2020 & 2033
- Table 63: Israel Low Rolling Resistance Tires Revenue (billion) Forecast, by Application 2020 & 2033
- Table 64: Israel Low Rolling Resistance Tires Volume (K) Forecast, by Application 2020 & 2033
- Table 65: GCC Low Rolling Resistance Tires Revenue (billion) Forecast, by Application 2020 & 2033
- Table 66: GCC Low Rolling Resistance Tires Volume (K) Forecast, by Application 2020 & 2033
- Table 67: North Africa Low Rolling Resistance Tires Revenue (billion) Forecast, by Application 2020 & 2033
- Table 68: North Africa Low Rolling Resistance Tires Volume (K) Forecast, by Application 2020 & 2033
- Table 69: South Africa Low Rolling Resistance Tires Revenue (billion) Forecast, by Application 2020 & 2033
- Table 70: South Africa Low Rolling Resistance Tires Volume (K) Forecast, by Application 2020 & 2033
- Table 71: Rest of Middle East & Africa Low Rolling Resistance Tires Revenue (billion) Forecast, by Application 2020 & 2033
- Table 72: Rest of Middle East & Africa Low Rolling Resistance Tires Volume (K) Forecast, by Application 2020 & 2033
- Table 73: Global Low Rolling Resistance Tires Revenue billion Forecast, by Application 2020 & 2033
- Table 74: Global Low Rolling Resistance Tires Volume K Forecast, by Application 2020 & 2033
- Table 75: Global Low Rolling Resistance Tires Revenue billion Forecast, by Types 2020 & 2033
- Table 76: Global Low Rolling Resistance Tires Volume K Forecast, by Types 2020 & 2033
- Table 77: Global Low Rolling Resistance Tires Revenue billion Forecast, by Country 2020 & 2033
- Table 78: Global Low Rolling Resistance Tires Volume K Forecast, by Country 2020 & 2033
- Table 79: China Low Rolling Resistance Tires Revenue (billion) Forecast, by Application 2020 & 2033
- Table 80: China Low Rolling Resistance Tires Volume (K) Forecast, by Application 2020 & 2033
- Table 81: India Low Rolling Resistance Tires Revenue (billion) Forecast, by Application 2020 & 2033
- Table 82: India Low Rolling Resistance Tires Volume (K) Forecast, by Application 2020 & 2033
- Table 83: Japan Low Rolling Resistance Tires Revenue (billion) Forecast, by Application 2020 & 2033
- Table 84: Japan Low Rolling Resistance Tires Volume (K) Forecast, by Application 2020 & 2033
- Table 85: South Korea Low Rolling Resistance Tires Revenue (billion) Forecast, by Application 2020 & 2033
- Table 86: South Korea Low Rolling Resistance Tires Volume (K) Forecast, by Application 2020 & 2033
- Table 87: ASEAN Low Rolling Resistance Tires Revenue (billion) Forecast, by Application 2020 & 2033
- Table 88: ASEAN Low Rolling Resistance Tires Volume (K) Forecast, by Application 2020 & 2033
- Table 89: Oceania Low Rolling Resistance Tires Revenue (billion) Forecast, by Application 2020 & 2033
- Table 90: Oceania Low Rolling Resistance Tires Volume (K) Forecast, by Application 2020 & 2033
- Table 91: Rest of Asia Pacific Low Rolling Resistance Tires Revenue (billion) Forecast, by Application 2020 & 2033
- Table 92: Rest of Asia Pacific Low Rolling Resistance Tires Volume (K) Forecast, by Application 2020 & 2033
Frequently Asked Questions
1. What is the projected Compound Annual Growth Rate (CAGR) of the Low Rolling Resistance Tires?
The projected CAGR is approximately 12%.
2. Which companies are prominent players in the Low Rolling Resistance Tires?
Key companies in the market include Michelin, Bridgestone, GoodYear, Continental, Dunlop Tyres, Pirelli, Hankook, Yokohama, Sumitomo, Zhongce Rubber, Apollo Tyres, Toyo Tire Corporation, Cheng Shin Rubber, Giti, Linglong Tire, MRF, Nexen Tire, Sailun jinyu Group, Kumho Tire, Nokian Tyres, Double Coin, Triangle Tire Group, Guizhou Tyre, PRINX, Qingdao Doublestar, Wanli Tire Corporation, Qingdao Sentury Tire, Jiangsu General Science Technology.
3. What are the main segments of the Low Rolling Resistance Tires?
The market segments include Application, Types.
4. Can you provide details about the market size?
The market size is estimated to be USD 15.6 billion as of 2022.
5. What are some drivers contributing to market growth?
N/A
6. What are the notable trends driving market growth?
N/A
7. Are there any restraints impacting market growth?
N/A
8. Can you provide examples of recent developments in the market?
N/A
9. What pricing options are available for accessing the report?
Pricing options include single-user, multi-user, and enterprise licenses priced at USD 4350.00, USD 6525.00, and USD 8700.00 respectively.
10. Is the market size provided in terms of value or volume?
The market size is provided in terms of value, measured in billion and volume, measured in K.
11. Are there any specific market keywords associated with the report?
Yes, the market keyword associated with the report is "Low Rolling Resistance Tires," which aids in identifying and referencing the specific market segment covered.
12. How do I determine which pricing option suits my needs best?
The pricing options vary based on user requirements and access needs. Individual users may opt for single-user licenses, while businesses requiring broader access may choose multi-user or enterprise licenses for cost-effective access to the report.
13. Are there any additional resources or data provided in the Low Rolling Resistance Tires report?
While the report offers comprehensive insights, it's advisable to review the specific contents or supplementary materials provided to ascertain if additional resources or data are available.
14. How can I stay updated on further developments or reports in the Low Rolling Resistance Tires?
To stay informed about further developments, trends, and reports in the Low Rolling Resistance Tires, consider subscribing to industry newsletters, following relevant companies and organizations, or regularly checking reputable industry news sources and publications.
Methodology
Step 1 - Identification of Relevant Samples Size from Population Database


Step 2 - Approaches for Defining Global Market Size (Value, Volume* & Price*)

Note*: In applicable scenarios
Step 3 - Data Sources
Primary Research
- Web Analytics
- Survey Reports
- Research Institute
- Latest Research Reports
- Opinion Leaders
Secondary Research
- Annual Reports
- White Paper
- Latest Press Release
- Industry Association
- Paid Database
- Investor Presentations

Step 4 - Data Triangulation
Involves using different sources of information in order to increase the validity of a study
These sources are likely to be stakeholders in a program - participants, other researchers, program staff, other community members, and so on.
Then we put all data in single framework & apply various statistical tools to find out the dynamic on the market.
During the analysis stage, feedback from the stakeholder groups would be compared to determine areas of agreement as well as areas of divergence