

Key Insights
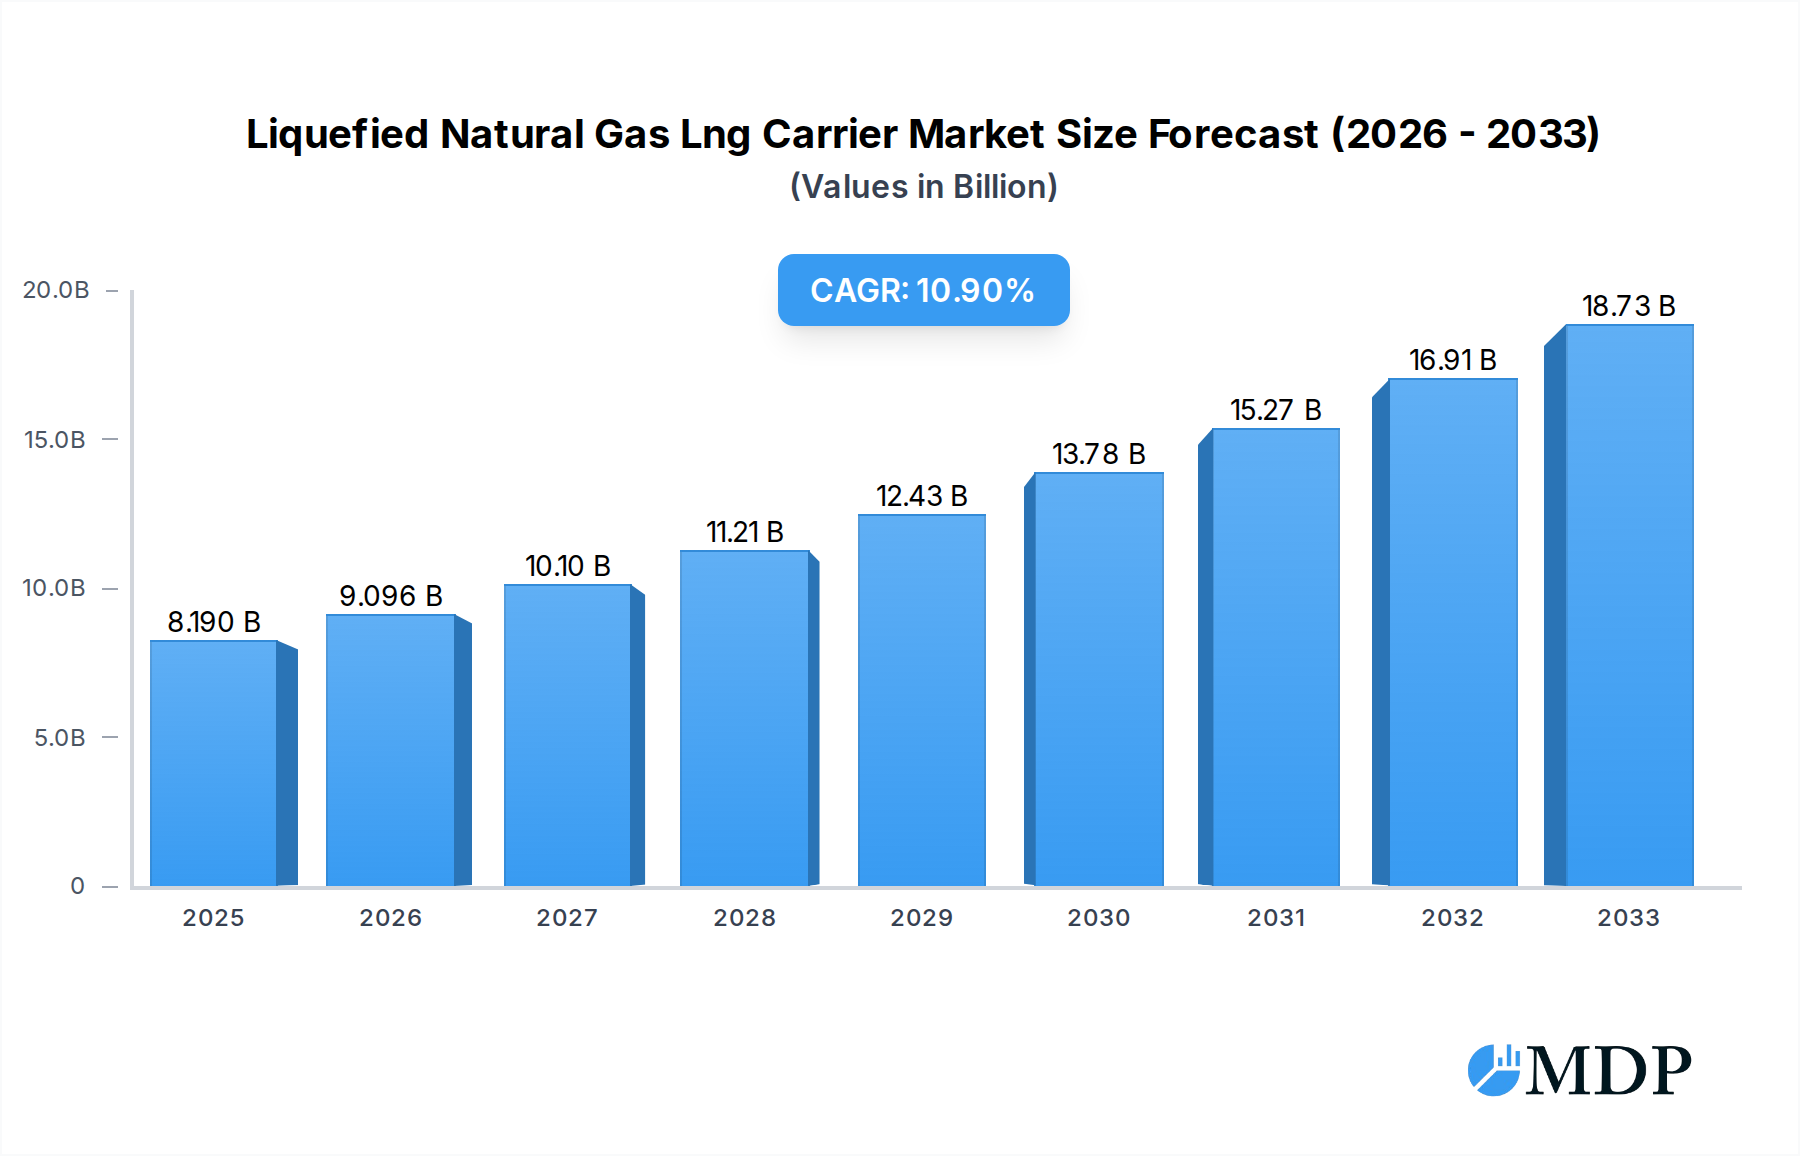
The global Liquefied Natural Gas (LNG) Carrier market is poised for substantial expansion, driven by the escalating demand for cleaner energy sources and the increasing importance of natural gas in the global energy mix. With a current market size estimated at USD 8.19 billion in 2025, the sector is projected to witness robust growth, exhibiting a compound annual growth rate (CAGR) of 10.89% through 2033. This significant upward trajectory is underpinned by a confluence of factors, including geopolitical shifts influencing energy trade routes, the continuous development of new LNG liquefaction and regasification terminals worldwide, and the growing emphasis on decarbonization efforts across various industries. The maritime transportation and logistics sector, along with the oil and gas industry, represent the primary application segments, directly benefiting from the increased global trade of LNG. Furthermore, the trend towards larger vessel capacities, particularly those exceeding 100,000 CBM, indicates a strategic move towards greater operational efficiency and cost-effectiveness in transporting massive volumes of LNG across vast oceanic distances.

Liquefied Natural Gas Lng Carrier Market Size (In Billion)
The market's growth trajectory, however, is not without its challenges. While the drivers are strong, potential restraints such as the high capital expenditure required for building new LNG carriers and the volatility of natural gas prices can influence investment decisions and project timelines. Despite these hurdles, the consistent demand for reliable energy supplies and the ongoing global energy transition are expected to outweigh these limitations. Major players like CSSC, HD KSOE, Hanwha Ocean, and Hyundai Heavy Industries are actively investing in research and development and expanding their production capacities to meet the burgeoning demand. The Asia Pacific region, particularly China and South Korea, is expected to remain a dominant force in both shipbuilding and LNG consumption, further propelling the market forward. Innovations in vessel design, focusing on improved fuel efficiency and environmental compliance, will also play a crucial role in shaping the future landscape of the LNG carrier market.
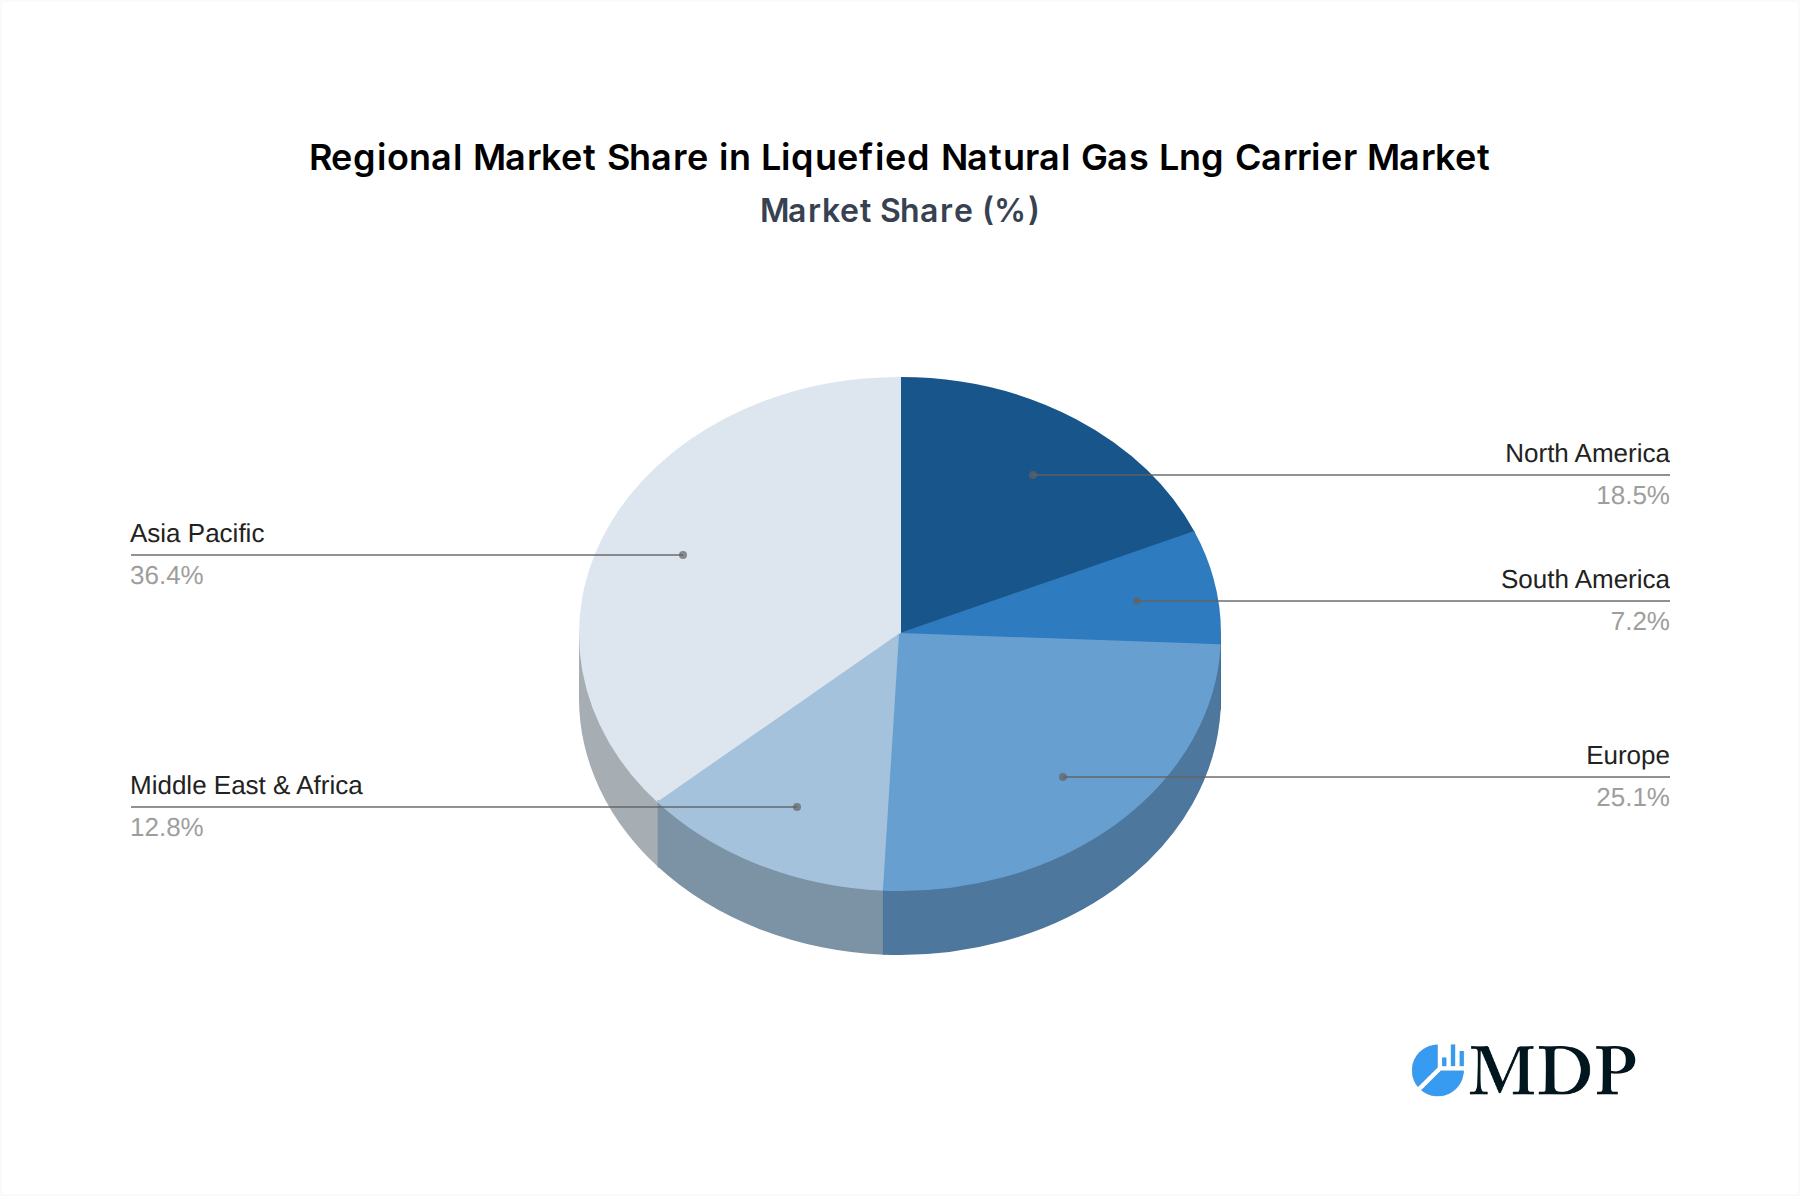
Liquefied Natural Gas Lng Carrier Company Market Share
This report provides an in-depth analysis of the global Liquefied Natural Gas (LNG) Carrier market, offering comprehensive insights for industry stakeholders. Covering a study period from 2019 to 2033, with a base and estimated year of 2025, the report delves into historical trends, current market dynamics, and future projections. It analyzes key players, technological advancements, market segments, and regional dominance to equip businesses with actionable strategies for growth and investment. The report focuses on critical aspects like maritime transportation, oil & gas applications, and carrier types ranging from below 100,000 CBM to above 100,000 CBM, providing a granular view of the evolving LNG shipping landscape.
Liquefied Natural Gas Lng Carrier Market Dynamics & Concentration
The global Liquefied Natural Gas (LNG) Carrier market is characterized by a moderate to high concentration, with a few dominant players controlling a significant portion of shipbuilding orders and fleet capacity. The primary innovation drivers revolve around enhancing vessel efficiency, reducing emissions, and improving safety standards to meet increasingly stringent environmental regulations and client demands. Regulatory frameworks, particularly those set by the International Maritime Organization (IMO) concerning sulfur emissions and greenhouse gas reductions, are a major influence on shipbuilding technology and operational practices. While direct product substitutes for LNG carriers are limited, alternative energy sources and transportation methods for natural gas (e.g., pipelines, compressed natural gas) present indirect competitive pressures. End-user trends are heavily dictated by global energy demand, the growth of LNG as a cleaner transitional fuel, and the development of new liquefaction and regasification terminals. Mergers and Acquisitions (M&A) activities, though not as frequent as in some other maritime sectors, are strategic moves by key players to consolidate market share, acquire new technologies, and expand their global footprint. For instance, a hypothetical M&A deal in the past year could have involved a value of $2 billion, aiming to integrate specialized fleet management capabilities. The market share of leading shipyards in LNG carrier construction is estimated to be upwards of 70% held by the top five.
Liquefied Natural Gas Lng Carrier Industry Trends & Analysis
The Liquefied Natural Gas (LNG) Carrier industry is experiencing robust growth, driven by the escalating global demand for natural gas as a cleaner energy alternative to coal and oil. This surge in demand is fueled by energy security concerns, expanding industrial applications, and the transition towards decarbonization across various economies. Technological disruptions are continuously reshaping the sector, with a focus on building larger, more efficient, and environmentally friendly vessels. Innovations in propulsion systems, such as dual-fuel engines capable of running on LNG and conventional fuels, are becoming standard, significantly reducing sulfur oxide (SOx) and nitrogen oxide (NOx) emissions. Furthermore, advancements in cargo containment systems, improved hull designs for fuel efficiency, and the integration of digital technologies for real-time monitoring and optimization are key trends. Consumer preferences are increasingly leaning towards carriers that offer lower operational costs and demonstrate a strong commitment to environmental sustainability, pushing shipowners to invest in cutting-edge technologies. Competitive dynamics are intense, with major shipbuilders vying for lucrative newbuild orders and existing fleet operators competing for charter contracts. The market penetration of advanced technologies like electric propulsion and advanced ballast water treatment systems is rapidly increasing. The Compound Annual Growth Rate (CAGR) for the LNG Carrier market is projected to be approximately 6.5% from 2025 to 2033, indicating sustained expansion. The global market size for LNG carriers is estimated to reach over $75 billion by 2033.
Leading Markets & Segments in Liquefied Natural Gas Lng Carrier
The dominant region for LNG Carrier newbuild orders and fleet deployment is Asia-Pacific, driven by the substantial import demands of countries like China, Japan, South Korea, and India, coupled with significant shipbuilding capacities. Within this region, South Korea and China are leading countries in terms of LNG carrier construction, hosting major shipyards that specialize in these complex vessels. Application-wise, Maritime Transportation & Logistics is the most significant segment, as LNG carriers are the backbone of international LNG trade, connecting liquefaction plants to regasification terminals worldwide. The Oil & Gas segment also plays a crucial role, encompassing the upstream and midstream operations that require secure and efficient transport of this vital commodity.
- Dominance Drivers in Asia-Pacific:
- Economic Policies: Government incentives and long-term energy security strategies in major Asian economies promote the import of LNG.
- Infrastructure Development: Continuous investment in regasification terminals and associated port infrastructure facilitates increased LNG imports and, consequently, the demand for LNG carriers.
- Growing Energy Demand: Rapid industrialization and urbanization in Asian countries lead to a sustained and increasing demand for energy, with LNG serving as a key transitional fuel.
- Shipbuilding Prowess: South Korea and China possess advanced shipbuilding capabilities and have invested heavily in developing expertise and capacity for constructing large, technologically sophisticated LNG carriers.
In terms of Type, carriers with a capacity of 100,000 CBM and above represent the dominant segment. These large-scale carriers are more economically viable for long-haul transportation and are preferred for major trade routes due to their improved economies of scale, reducing per-unit transportation costs. The increasing trend towards mega-train liquefaction facilities globally necessitates larger vessels to handle the expanded export volumes. While carriers below 100,000 CBM cater to specific regional trades or smaller import needs, the bulk of new orders and future demand is concentrated in the larger capacity segment. The global fleet of LNG carriers is projected to grow by over 20% between 2025 and 2033.
Liquefied Natural Gas Lng Carrier Product Developments
Product developments in the LNG Carrier sector are primarily focused on enhancing fuel efficiency and reducing environmental impact. Advancements in hull design, including optimized bulbous bows and air lubrication systems, are contributing to significant fuel savings, estimated at 5-10%. The integration of advanced cargo containment systems, such as membrane or prismatic tanks, allows for greater cargo capacity and improved boil-off gas management. Furthermore, the increasing adoption of dual-fuel engines, capable of running on both LNG and conventional fuels, is a major technological trend, offering compliance with stricter emissions regulations. These innovations provide competitive advantages by lowering operational costs for shipping companies and fulfilling the growing demand for "green" shipping solutions, aligning with global sustainability goals. The market is also seeing innovations in propulsion systems, including electric and hybrid solutions, and advancements in onboard gas reliquefaction plants to minimize cargo loss.
Key Drivers of Liquefied Natural Gas Lng Carrier Growth
The growth of the Liquefied Natural Gas (LNG) Carrier market is propelled by several interconnected factors. Technological advancements in shipbuilding, such as more fuel-efficient hull designs and dual-fuel engines, are making LNG transportation more cost-effective and environmentally compliant. Economic factors, including the increasing global demand for natural gas as a cleaner transitional fuel, energy security initiatives by nations, and the development of new liquefaction and regasification terminals worldwide, are creating a consistent need for expanded shipping capacity. Regulatory support and environmental mandates, such as IMO's emissions regulations, are pushing shipowners to invest in modern, cleaner vessels, further stimulating newbuild orders. The global expansion of LNG infrastructure is projected to drive a 15% increase in the LNG carrier fleet by 2028.
Challenges in the Liquefied Natural Gas Lng Carrier Market
The Liquefied Natural Gas (LNG) Carrier market faces several challenges that can impact its growth trajectory. Regulatory hurdles, particularly evolving and increasingly stringent environmental regulations for emissions and ballast water management, require significant upfront investment in new technologies and retrofitting. Supply chain issues in shipbuilding, including the availability of specialized components, skilled labor, and potential delays in material procurement, can lead to cost overruns and extended delivery times for new vessels. Competitive pressures from other energy transport methods, such as pipelines and emerging alternative fuels, as well as the cyclical nature of the shipping industry and charter rates, also pose significant challenges. The current order book for LNG carriers stands at approximately 150 vessels, indicating a robust but competitive landscape for shipyards.
Emerging Opportunities in Liquefied Natural Gas Lng Carrier
Emerging opportunities in the Liquefied Natural Gas (LNG) Carrier market are primarily driven by the global energy transition and the increasing role of natural gas as a bridge fuel. Technological breakthroughs in areas like ammonia and hydrogen-fueled vessels present long-term potential for decarbonizing the maritime sector, with LNG carriers potentially serving as a platform for testing and adapting these new technologies. Strategic partnerships between shipowners, charterers, and technology providers are crucial for accelerating the development and adoption of sustainable shipping solutions. Furthermore, market expansion strategies targeting emerging LNG markets in Africa and Southeast Asia, alongside the continued growth in established markets, offer significant potential for fleet expansion and increased demand for specialized carriers. The projected rise in global LNG trade volume by 30% over the next decade is a significant catalyst.
Leading Players in the Liquefied Natural Gas Lng Carrier Sector
- CSSC
- HD KSOE
- Hanwha Ocean
- Hyundai Heavy Industries
- Samsung Heavy Industries
- Mitsubishi Heavy Industries
- Kawasaki Heavy Industries
- Imabari Shipbuilding
- Fincantieri
- STX Offshore & Shipbuilding
Key Milestones in Liquefied Natural Gas Lng Carrier Industry
- 2019: Introduction of advanced membrane containment systems by major shipyards, enhancing cargo capacity and safety.
- 2020: Increased regulatory focus on emissions reduction, driving the demand for dual-fuel LNG-powered vessels.
- 2021: Record number of new LNG carrier orders placed by shipowners anticipating sustained global LNG demand.
- 2022: Development of innovative hull designs and air lubrication systems leading to improved fuel efficiency.
- 2023: Emergence of discussions around methanol and ammonia as potential future fuels for LNG carriers, signaling a long-term shift towards decarbonization.
- 2024: Continued expansion of LNG export capacity globally, creating sustained demand for new LNG carrier newbuilds.
Strategic Outlook for Liquefied Natural Gas Lng Carrier Market
The strategic outlook for the Liquefied Natural Gas (LNG) Carrier market remains highly positive, driven by sustained global demand for natural gas and the ongoing energy transition. Growth accelerators include the continuous development of new liquefaction and regasification terminals, necessitating fleet expansion to meet increasing trade volumes, projected to be around 150 billion CBM by 2030. Investment in research and development for decarbonization technologies, such as hydrogen and ammonia fuel cells, will also shape future fleet strategies, creating opportunities for carriers capable of adapting to these advancements. Furthermore, strategic collaborations and long-term charter agreements will continue to provide stability and drive predictable growth. The market is poised for an estimated fleet expansion of over 25% by 2033.
Liquefied Natural Gas Lng Carrier Segmentation
-
1. Application
- 1.1. Maritime Transportation & Logistics
- 1.2. Oil & Gas
- 1.3. Others
-
2. Type
- 2.1. Below 100,000 CBM
- 2.2. 100,000 CBM and above
Liquefied Natural Gas Lng Carrier Segmentation By Geography
-
1. North America
- 1.1. United States
- 1.2. Canada
- 1.3. Mexico
-
2. South America
- 2.1. Brazil
- 2.2. Argentina
- 2.3. Rest of South America
-
3. Europe
- 3.1. United Kingdom
- 3.2. Germany
- 3.3. France
- 3.4. Italy
- 3.5. Spain
- 3.6. Russia
- 3.7. Benelux
- 3.8. Nordics
- 3.9. Rest of Europe
-
4. Middle East & Africa
- 4.1. Turkey
- 4.2. Israel
- 4.3. GCC
- 4.4. North Africa
- 4.5. South Africa
- 4.6. Rest of Middle East & Africa
-
5. Asia Pacific
- 5.1. China
- 5.2. India
- 5.3. Japan
- 5.4. South Korea
- 5.5. ASEAN
- 5.6. Oceania
- 5.7. Rest of Asia Pacific
Liquefied Natural Gas Lng Carrier Regional Market Share
Geographic Coverage of Liquefied Natural Gas Lng Carrier
Liquefied Natural Gas Lng Carrier REPORT HIGHLIGHTS
| Aspects | Details |
|---|---|
| Study Period | 2020-2034 |
| Base Year | 2025 |
| Estimated Year | 2026 |
| Forecast Period | 2026-2034 |
| Historical Period | 2020-2025 |
| Growth Rate | CAGR of 10.89% from 2020-2034 |
| Segmentation |
|
Table of Contents
- 1. Introduction
- 1.1. Research Scope
- 1.2. Market Segmentation
- 1.3. Research Methodology
- 1.4. Definitions and Assumptions
- 2. Executive Summary
- 2.1. Introduction
- 3. Market Dynamics
- 3.1. Introduction
- 3.2. Market Drivers
- 3.3. Market Restrains
- 3.4. Market Trends
- 4. Market Factor Analysis
- 4.1. Porters Five Forces
- 4.2. Supply/Value Chain
- 4.3. PESTEL analysis
- 4.4. Market Entropy
- 4.5. Patent/Trademark Analysis
- 5. Global Liquefied Natural Gas Lng Carrier Analysis, Insights and Forecast, 2020-2032
- 5.1. Market Analysis, Insights and Forecast - by Application
- 5.1.1. Maritime Transportation & Logistics
- 5.1.2. Oil & Gas
- 5.1.3. Others
- 5.2. Market Analysis, Insights and Forecast - by Type
- 5.2.1. Below 100,000 CBM
- 5.2.2. 100,000 CBM and above
- 5.3. Market Analysis, Insights and Forecast - by Region
- 5.3.1. North America
- 5.3.2. South America
- 5.3.3. Europe
- 5.3.4. Middle East & Africa
- 5.3.5. Asia Pacific
- 5.1. Market Analysis, Insights and Forecast - by Application
- 6. North America Liquefied Natural Gas Lng Carrier Analysis, Insights and Forecast, 2020-2032
- 6.1. Market Analysis, Insights and Forecast - by Application
- 6.1.1. Maritime Transportation & Logistics
- 6.1.2. Oil & Gas
- 6.1.3. Others
- 6.2. Market Analysis, Insights and Forecast - by Type
- 6.2.1. Below 100,000 CBM
- 6.2.2. 100,000 CBM and above
- 6.1. Market Analysis, Insights and Forecast - by Application
- 7. South America Liquefied Natural Gas Lng Carrier Analysis, Insights and Forecast, 2020-2032
- 7.1. Market Analysis, Insights and Forecast - by Application
- 7.1.1. Maritime Transportation & Logistics
- 7.1.2. Oil & Gas
- 7.1.3. Others
- 7.2. Market Analysis, Insights and Forecast - by Type
- 7.2.1. Below 100,000 CBM
- 7.2.2. 100,000 CBM and above
- 7.1. Market Analysis, Insights and Forecast - by Application
- 8. Europe Liquefied Natural Gas Lng Carrier Analysis, Insights and Forecast, 2020-2032
- 8.1. Market Analysis, Insights and Forecast - by Application
- 8.1.1. Maritime Transportation & Logistics
- 8.1.2. Oil & Gas
- 8.1.3. Others
- 8.2. Market Analysis, Insights and Forecast - by Type
- 8.2.1. Below 100,000 CBM
- 8.2.2. 100,000 CBM and above
- 8.1. Market Analysis, Insights and Forecast - by Application
- 9. Middle East & Africa Liquefied Natural Gas Lng Carrier Analysis, Insights and Forecast, 2020-2032
- 9.1. Market Analysis, Insights and Forecast - by Application
- 9.1.1. Maritime Transportation & Logistics
- 9.1.2. Oil & Gas
- 9.1.3. Others
- 9.2. Market Analysis, Insights and Forecast - by Type
- 9.2.1. Below 100,000 CBM
- 9.2.2. 100,000 CBM and above
- 9.1. Market Analysis, Insights and Forecast - by Application
- 10. Asia Pacific Liquefied Natural Gas Lng Carrier Analysis, Insights and Forecast, 2020-2032
- 10.1. Market Analysis, Insights and Forecast - by Application
- 10.1.1. Maritime Transportation & Logistics
- 10.1.2. Oil & Gas
- 10.1.3. Others
- 10.2. Market Analysis, Insights and Forecast - by Type
- 10.2.1. Below 100,000 CBM
- 10.2.2. 100,000 CBM and above
- 10.1. Market Analysis, Insights and Forecast - by Application
- 11. Competitive Analysis
- 11.1. Global Market Share Analysis 2025
- 11.2. Company Profiles
- 11.2.1 CSSC
- 11.2.1.1. Overview
- 11.2.1.2. Products
- 11.2.1.3. SWOT Analysis
- 11.2.1.4. Recent Developments
- 11.2.1.5. Financials (Based on Availability)
- 11.2.2 HD KSOE
- 11.2.2.1. Overview
- 11.2.2.2. Products
- 11.2.2.3. SWOT Analysis
- 11.2.2.4. Recent Developments
- 11.2.2.5. Financials (Based on Availability)
- 11.2.3 Hanwha Ocean
- 11.2.3.1. Overview
- 11.2.3.2. Products
- 11.2.3.3. SWOT Analysis
- 11.2.3.4. Recent Developments
- 11.2.3.5. Financials (Based on Availability)
- 11.2.4 Hyundai Heavy Industries
- 11.2.4.1. Overview
- 11.2.4.2. Products
- 11.2.4.3. SWOT Analysis
- 11.2.4.4. Recent Developments
- 11.2.4.5. Financials (Based on Availability)
- 11.2.5 Samsung Heavy Industries
- 11.2.5.1. Overview
- 11.2.5.2. Products
- 11.2.5.3. SWOT Analysis
- 11.2.5.4. Recent Developments
- 11.2.5.5. Financials (Based on Availability)
- 11.2.6 Mitsubishi Heavy Industries
- 11.2.6.1. Overview
- 11.2.6.2. Products
- 11.2.6.3. SWOT Analysis
- 11.2.6.4. Recent Developments
- 11.2.6.5. Financials (Based on Availability)
- 11.2.7 Kawasaki Heavy Industries
- 11.2.7.1. Overview
- 11.2.7.2. Products
- 11.2.7.3. SWOT Analysis
- 11.2.7.4. Recent Developments
- 11.2.7.5. Financials (Based on Availability)
- 11.2.8 Imabari Shipbuilding
- 11.2.8.1. Overview
- 11.2.8.2. Products
- 11.2.8.3. SWOT Analysis
- 11.2.8.4. Recent Developments
- 11.2.8.5. Financials (Based on Availability)
- 11.2.9 Fincantieri
- 11.2.9.1. Overview
- 11.2.9.2. Products
- 11.2.9.3. SWOT Analysis
- 11.2.9.4. Recent Developments
- 11.2.9.5. Financials (Based on Availability)
- 11.2.10 STX Offshore & Shipbuilding
- 11.2.10.1. Overview
- 11.2.10.2. Products
- 11.2.10.3. SWOT Analysis
- 11.2.10.4. Recent Developments
- 11.2.10.5. Financials (Based on Availability)
- 11.2.1 CSSC
List of Figures
- Figure 1: Global Liquefied Natural Gas Lng Carrier Revenue Breakdown (undefined, %) by Region 2025 & 2033
- Figure 2: North America Liquefied Natural Gas Lng Carrier Revenue (undefined), by Application 2025 & 2033
- Figure 3: North America Liquefied Natural Gas Lng Carrier Revenue Share (%), by Application 2025 & 2033
- Figure 4: North America Liquefied Natural Gas Lng Carrier Revenue (undefined), by Type 2025 & 2033
- Figure 5: North America Liquefied Natural Gas Lng Carrier Revenue Share (%), by Type 2025 & 2033
- Figure 6: North America Liquefied Natural Gas Lng Carrier Revenue (undefined), by Country 2025 & 2033
- Figure 7: North America Liquefied Natural Gas Lng Carrier Revenue Share (%), by Country 2025 & 2033
- Figure 8: South America Liquefied Natural Gas Lng Carrier Revenue (undefined), by Application 2025 & 2033
- Figure 9: South America Liquefied Natural Gas Lng Carrier Revenue Share (%), by Application 2025 & 2033
- Figure 10: South America Liquefied Natural Gas Lng Carrier Revenue (undefined), by Type 2025 & 2033
- Figure 11: South America Liquefied Natural Gas Lng Carrier Revenue Share (%), by Type 2025 & 2033
- Figure 12: South America Liquefied Natural Gas Lng Carrier Revenue (undefined), by Country 2025 & 2033
- Figure 13: South America Liquefied Natural Gas Lng Carrier Revenue Share (%), by Country 2025 & 2033
- Figure 14: Europe Liquefied Natural Gas Lng Carrier Revenue (undefined), by Application 2025 & 2033
- Figure 15: Europe Liquefied Natural Gas Lng Carrier Revenue Share (%), by Application 2025 & 2033
- Figure 16: Europe Liquefied Natural Gas Lng Carrier Revenue (undefined), by Type 2025 & 2033
- Figure 17: Europe Liquefied Natural Gas Lng Carrier Revenue Share (%), by Type 2025 & 2033
- Figure 18: Europe Liquefied Natural Gas Lng Carrier Revenue (undefined), by Country 2025 & 2033
- Figure 19: Europe Liquefied Natural Gas Lng Carrier Revenue Share (%), by Country 2025 & 2033
- Figure 20: Middle East & Africa Liquefied Natural Gas Lng Carrier Revenue (undefined), by Application 2025 & 2033
- Figure 21: Middle East & Africa Liquefied Natural Gas Lng Carrier Revenue Share (%), by Application 2025 & 2033
- Figure 22: Middle East & Africa Liquefied Natural Gas Lng Carrier Revenue (undefined), by Type 2025 & 2033
- Figure 23: Middle East & Africa Liquefied Natural Gas Lng Carrier Revenue Share (%), by Type 2025 & 2033
- Figure 24: Middle East & Africa Liquefied Natural Gas Lng Carrier Revenue (undefined), by Country 2025 & 2033
- Figure 25: Middle East & Africa Liquefied Natural Gas Lng Carrier Revenue Share (%), by Country 2025 & 2033
- Figure 26: Asia Pacific Liquefied Natural Gas Lng Carrier Revenue (undefined), by Application 2025 & 2033
- Figure 27: Asia Pacific Liquefied Natural Gas Lng Carrier Revenue Share (%), by Application 2025 & 2033
- Figure 28: Asia Pacific Liquefied Natural Gas Lng Carrier Revenue (undefined), by Type 2025 & 2033
- Figure 29: Asia Pacific Liquefied Natural Gas Lng Carrier Revenue Share (%), by Type 2025 & 2033
- Figure 30: Asia Pacific Liquefied Natural Gas Lng Carrier Revenue (undefined), by Country 2025 & 2033
- Figure 31: Asia Pacific Liquefied Natural Gas Lng Carrier Revenue Share (%), by Country 2025 & 2033
List of Tables
- Table 1: Global Liquefied Natural Gas Lng Carrier Revenue undefined Forecast, by Application 2020 & 2033
- Table 2: Global Liquefied Natural Gas Lng Carrier Revenue undefined Forecast, by Type 2020 & 2033
- Table 3: Global Liquefied Natural Gas Lng Carrier Revenue undefined Forecast, by Region 2020 & 2033
- Table 4: Global Liquefied Natural Gas Lng Carrier Revenue undefined Forecast, by Application 2020 & 2033
- Table 5: Global Liquefied Natural Gas Lng Carrier Revenue undefined Forecast, by Type 2020 & 2033
- Table 6: Global Liquefied Natural Gas Lng Carrier Revenue undefined Forecast, by Country 2020 & 2033
- Table 7: United States Liquefied Natural Gas Lng Carrier Revenue (undefined) Forecast, by Application 2020 & 2033
- Table 8: Canada Liquefied Natural Gas Lng Carrier Revenue (undefined) Forecast, by Application 2020 & 2033
- Table 9: Mexico Liquefied Natural Gas Lng Carrier Revenue (undefined) Forecast, by Application 2020 & 2033
- Table 10: Global Liquefied Natural Gas Lng Carrier Revenue undefined Forecast, by Application 2020 & 2033
- Table 11: Global Liquefied Natural Gas Lng Carrier Revenue undefined Forecast, by Type 2020 & 2033
- Table 12: Global Liquefied Natural Gas Lng Carrier Revenue undefined Forecast, by Country 2020 & 2033
- Table 13: Brazil Liquefied Natural Gas Lng Carrier Revenue (undefined) Forecast, by Application 2020 & 2033
- Table 14: Argentina Liquefied Natural Gas Lng Carrier Revenue (undefined) Forecast, by Application 2020 & 2033
- Table 15: Rest of South America Liquefied Natural Gas Lng Carrier Revenue (undefined) Forecast, by Application 2020 & 2033
- Table 16: Global Liquefied Natural Gas Lng Carrier Revenue undefined Forecast, by Application 2020 & 2033
- Table 17: Global Liquefied Natural Gas Lng Carrier Revenue undefined Forecast, by Type 2020 & 2033
- Table 18: Global Liquefied Natural Gas Lng Carrier Revenue undefined Forecast, by Country 2020 & 2033
- Table 19: United Kingdom Liquefied Natural Gas Lng Carrier Revenue (undefined) Forecast, by Application 2020 & 2033
- Table 20: Germany Liquefied Natural Gas Lng Carrier Revenue (undefined) Forecast, by Application 2020 & 2033
- Table 21: France Liquefied Natural Gas Lng Carrier Revenue (undefined) Forecast, by Application 2020 & 2033
- Table 22: Italy Liquefied Natural Gas Lng Carrier Revenue (undefined) Forecast, by Application 2020 & 2033
- Table 23: Spain Liquefied Natural Gas Lng Carrier Revenue (undefined) Forecast, by Application 2020 & 2033
- Table 24: Russia Liquefied Natural Gas Lng Carrier Revenue (undefined) Forecast, by Application 2020 & 2033
- Table 25: Benelux Liquefied Natural Gas Lng Carrier Revenue (undefined) Forecast, by Application 2020 & 2033
- Table 26: Nordics Liquefied Natural Gas Lng Carrier Revenue (undefined) Forecast, by Application 2020 & 2033
- Table 27: Rest of Europe Liquefied Natural Gas Lng Carrier Revenue (undefined) Forecast, by Application 2020 & 2033
- Table 28: Global Liquefied Natural Gas Lng Carrier Revenue undefined Forecast, by Application 2020 & 2033
- Table 29: Global Liquefied Natural Gas Lng Carrier Revenue undefined Forecast, by Type 2020 & 2033
- Table 30: Global Liquefied Natural Gas Lng Carrier Revenue undefined Forecast, by Country 2020 & 2033
- Table 31: Turkey Liquefied Natural Gas Lng Carrier Revenue (undefined) Forecast, by Application 2020 & 2033
- Table 32: Israel Liquefied Natural Gas Lng Carrier Revenue (undefined) Forecast, by Application 2020 & 2033
- Table 33: GCC Liquefied Natural Gas Lng Carrier Revenue (undefined) Forecast, by Application 2020 & 2033
- Table 34: North Africa Liquefied Natural Gas Lng Carrier Revenue (undefined) Forecast, by Application 2020 & 2033
- Table 35: South Africa Liquefied Natural Gas Lng Carrier Revenue (undefined) Forecast, by Application 2020 & 2033
- Table 36: Rest of Middle East & Africa Liquefied Natural Gas Lng Carrier Revenue (undefined) Forecast, by Application 2020 & 2033
- Table 37: Global Liquefied Natural Gas Lng Carrier Revenue undefined Forecast, by Application 2020 & 2033
- Table 38: Global Liquefied Natural Gas Lng Carrier Revenue undefined Forecast, by Type 2020 & 2033
- Table 39: Global Liquefied Natural Gas Lng Carrier Revenue undefined Forecast, by Country 2020 & 2033
- Table 40: China Liquefied Natural Gas Lng Carrier Revenue (undefined) Forecast, by Application 2020 & 2033
- Table 41: India Liquefied Natural Gas Lng Carrier Revenue (undefined) Forecast, by Application 2020 & 2033
- Table 42: Japan Liquefied Natural Gas Lng Carrier Revenue (undefined) Forecast, by Application 2020 & 2033
- Table 43: South Korea Liquefied Natural Gas Lng Carrier Revenue (undefined) Forecast, by Application 2020 & 2033
- Table 44: ASEAN Liquefied Natural Gas Lng Carrier Revenue (undefined) Forecast, by Application 2020 & 2033
- Table 45: Oceania Liquefied Natural Gas Lng Carrier Revenue (undefined) Forecast, by Application 2020 & 2033
- Table 46: Rest of Asia Pacific Liquefied Natural Gas Lng Carrier Revenue (undefined) Forecast, by Application 2020 & 2033
Frequently Asked Questions
1. What is the projected Compound Annual Growth Rate (CAGR) of the Liquefied Natural Gas Lng Carrier?
The projected CAGR is approximately 10.89%.
2. Which companies are prominent players in the Liquefied Natural Gas Lng Carrier?
Key companies in the market include CSSC, HD KSOE, Hanwha Ocean, Hyundai Heavy Industries, Samsung Heavy Industries, Mitsubishi Heavy Industries, Kawasaki Heavy Industries, Imabari Shipbuilding, Fincantieri, STX Offshore & Shipbuilding.
3. What are the main segments of the Liquefied Natural Gas Lng Carrier?
The market segments include Application, Type.
4. Can you provide details about the market size?
The market size is estimated to be USD XXX N/A as of 2022.
5. What are some drivers contributing to market growth?
N/A
6. What are the notable trends driving market growth?
N/A
7. Are there any restraints impacting market growth?
N/A
8. Can you provide examples of recent developments in the market?
N/A
9. What pricing options are available for accessing the report?
Pricing options include single-user, multi-user, and enterprise licenses priced at USD 2900.00, USD 4350.00, and USD 5800.00 respectively.
10. Is the market size provided in terms of value or volume?
The market size is provided in terms of value, measured in N/A.
11. Are there any specific market keywords associated with the report?
Yes, the market keyword associated with the report is "Liquefied Natural Gas Lng Carrier," which aids in identifying and referencing the specific market segment covered.
12. How do I determine which pricing option suits my needs best?
The pricing options vary based on user requirements and access needs. Individual users may opt for single-user licenses, while businesses requiring broader access may choose multi-user or enterprise licenses for cost-effective access to the report.
13. Are there any additional resources or data provided in the Liquefied Natural Gas Lng Carrier report?
While the report offers comprehensive insights, it's advisable to review the specific contents or supplementary materials provided to ascertain if additional resources or data are available.
14. How can I stay updated on further developments or reports in the Liquefied Natural Gas Lng Carrier?
To stay informed about further developments, trends, and reports in the Liquefied Natural Gas Lng Carrier, consider subscribing to industry newsletters, following relevant companies and organizations, or regularly checking reputable industry news sources and publications.
Methodology
Step 1 - Identification of Relevant Samples Size from Population Database


Step 2 - Approaches for Defining Global Market Size (Value, Volume* & Price*)

Note*: In applicable scenarios
Step 3 - Data Sources
Primary Research
- Web Analytics
- Survey Reports
- Research Institute
- Latest Research Reports
- Opinion Leaders
Secondary Research
- Annual Reports
- White Paper
- Latest Press Release
- Industry Association
- Paid Database
- Investor Presentations

Step 4 - Data Triangulation
Involves using different sources of information in order to increase the validity of a study
These sources are likely to be stakeholders in a program - participants, other researchers, program staff, other community members, and so on.
Then we put all data in single framework & apply various statistical tools to find out the dynamic on the market.
During the analysis stage, feedback from the stakeholder groups would be compared to determine areas of agreement as well as areas of divergence