

Key Insights
The light commercial vehicle (LCV) market, encompassing vehicles like vans, pickups, and small trucks, is experiencing robust growth, driven by expanding e-commerce logistics, last-mile delivery services, and the burgeoning construction industry. A Compound Annual Growth Rate (CAGR) exceeding 20% indicates significant market expansion projected through 2033. This growth is fueled by increasing urbanization, a rising middle class in developing economies leading to higher demand for goods and services, and the ongoing shift towards efficient and cost-effective transportation solutions. The adoption of alternative fuel technologies, such as LPG and the increasing penetration of hybrid and electric vehicles, is reshaping the LCV landscape, offering benefits in terms of reduced emissions and improved fuel efficiency. However, factors such as fluctuating fuel prices, stringent emission regulations, and the initial high cost of electric vehicles present challenges to sustained growth. The market is highly competitive, with established players like Ashok Leyland, Tata Motors, and international manufacturers like Nissan and Volkswagen vying for market share. Innovative business models, such as vehicle subscription services and shared mobility initiatives, are also emerging and impacting the traditional sales patterns.
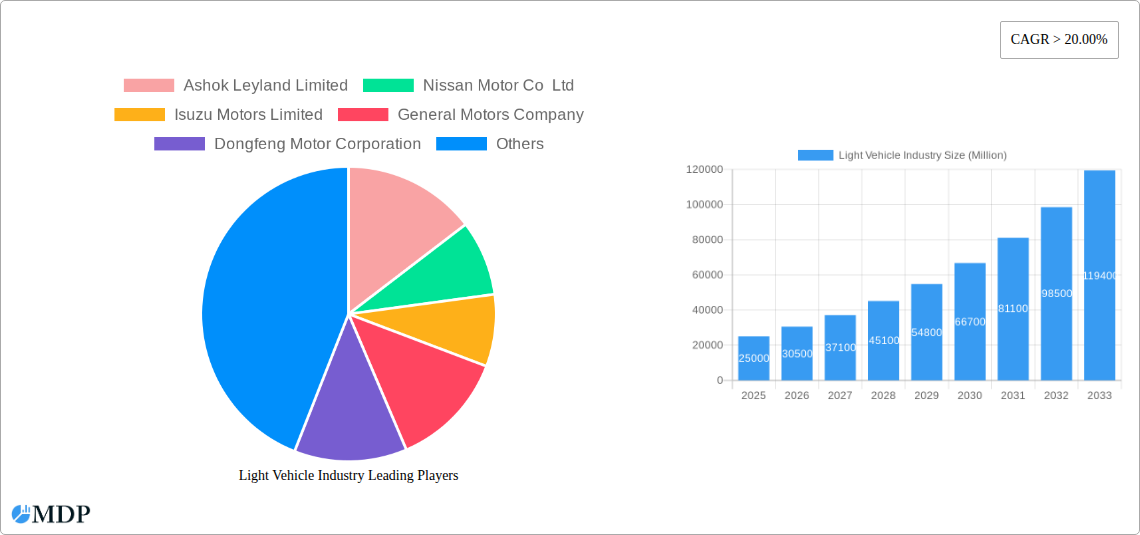
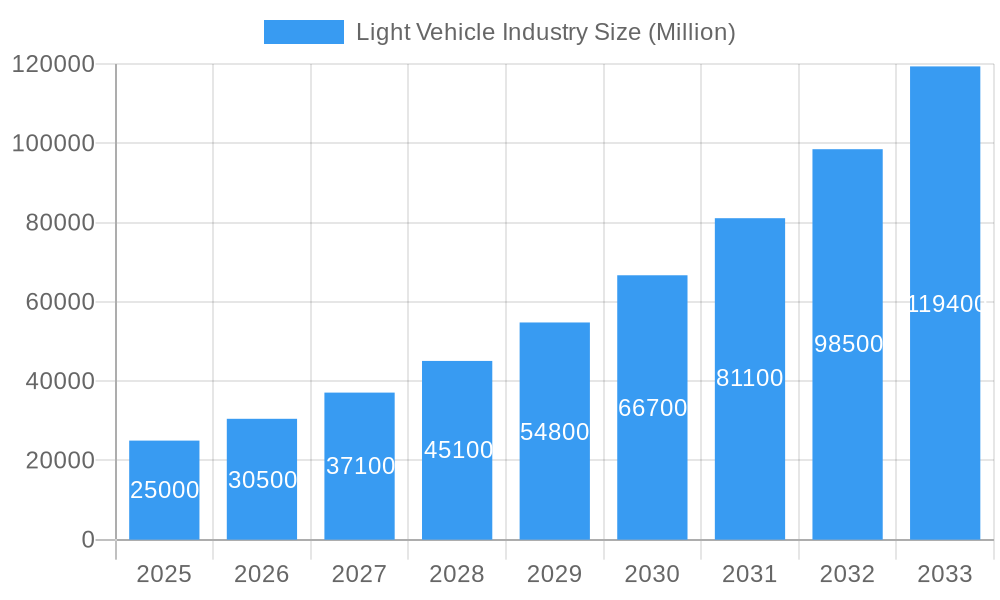
Light Vehicle Industry Market Size (In Billion)
Segment-wise, the commercial vehicle segment is the largest contributor, reflecting its vital role in logistics and transportation. The LPG propulsion type, though a niche segment currently, is expected to witness significant growth due to its cost-effectiveness and cleaner emissions compared to traditional diesel options. The hybrid and electric vehicle segment within LCVs is poised for substantial expansion, albeit starting from a lower base, driven by governmental incentives, environmental concerns, and advancements in battery technology. Regional variations in market growth will likely depend on factors such as infrastructure development, government policies, and economic conditions. The market's success hinges on a continued balance of technological innovation, sustainable practices, and regulatory support. Therefore, the light commercial vehicle industry's future trajectory looks bright, promising a period of continued growth and transformation.
Light Vehicle Industry Company Market Share
Light Vehicle Industry Market Report: 2019-2033 Forecast
Dive deep into the evolving landscape of the light vehicle industry with this comprehensive report, projecting a market value exceeding XX Million by 2033. This in-depth analysis covers market dynamics, leading players, emerging trends, and future growth opportunities within the light vehicle sector, focusing on commercial vehicles, LPG, hybrid, and electric propulsion types. The report leverages data from the historical period (2019-2024), with 2025 as the base year and a forecast period spanning 2025-2033. Key insights are provided for informed decision-making and strategic planning within this dynamic sector.
Light Vehicle Industry Market Dynamics & Concentration
The light vehicle industry, valued at XX Million in 2024, is characterized by moderate concentration, with key players holding significant market share. Ashok Leyland Limited, Tata Motors Limited, and Mahindra & Mahindra Limited represent prominent Indian players, while global giants like Volkswagen AG, Daimler AG (Mercedes-Benz AG), and General Motors Company dominate internationally. Market share fluctuations are driven by innovation, particularly in hybrid and electric vehicle (HEV/EV) technologies, influencing consumer preferences and competitive dynamics. Stringent emission regulations across various regions are impacting product development strategies. The increasing adoption of LPG vehicles presents a significant opportunity, especially in price-sensitive markets.
- Market Concentration: The top 5 players hold approximately xx% of the global market share in 2024.
- Innovation Drivers: HEV/EV technology advancements, autonomous driving features, and connected car technologies are key drivers.
- Regulatory Frameworks: Stringent emission standards and safety regulations influence product development and market access.
- Product Substitutes: Growing public transportation and ride-sharing services present some level of substitution.
- End-User Trends: A shift towards fuel-efficient and environmentally friendly vehicles is evident.
- M&A Activities: The industry has witnessed xx M&A deals in the last five years, primarily focused on technological acquisition and market expansion.
Light Vehicle Industry Industry Trends & Analysis
The light vehicle industry is experiencing significant transformation, driven by a compound annual growth rate (CAGR) of xx% during the forecast period (2025-2033). Technological disruptions, primarily the rise of HEV/EVs and the integration of advanced driver-assistance systems (ADAS), are reshaping the competitive landscape. Consumer preferences are evolving towards vehicles offering enhanced fuel efficiency, safety, and connectivity features. Market penetration of HEV/EVs is expected to reach xx% by 2033, driven by government incentives and increasing consumer awareness. The increasing demand for commercial vehicles, particularly in developing economies, further fuels market growth. Competitive dynamics are characterized by intense rivalry among established players and the emergence of new entrants, particularly in the EV segment.
Leading Markets & Segments in Light Vehicle Industry
The Asia-Pacific region, specifically India and China, is the dominant market for light vehicles, driven by robust economic growth, expanding infrastructure, and supportive government policies. Within segments, commercial vehicles are a significant portion of the market, with LPG-powered vehicles demonstrating substantial growth potential due to cost-effectiveness. Hybrid and electric vehicles are experiencing rapid expansion, driven by environmental concerns and technological advancements.
Key Drivers in Asia-Pacific:
- Strong economic growth fostering increased vehicle demand.
- Government initiatives promoting vehicle electrification.
- Expanding road infrastructure supporting increased mobility.
Dominance Analysis: The Asia-Pacific region's large population and rapidly developing economies contribute to its leading market position.
Light Vehicle Industry Product Developments
Recent product innovations focus heavily on enhancing fuel efficiency, safety, and connectivity. The integration of advanced driver-assistance systems (ADAS) and infotainment technologies is becoming standard. Manufacturers are focusing on lightweight materials to improve fuel economy and reduce emissions. The competitive advantage lies in offering innovative features and superior performance at competitive prices, particularly in the fast-growing EV and LPG segments.
Key Drivers of Light Vehicle Industry Growth
Several factors fuel growth in the light vehicle industry. Technological advancements in HEV/EV technology, including battery technology improvements and charging infrastructure development, are major drivers. Economic growth in emerging markets increases demand for personal and commercial vehicles. Supportive government policies, such as subsidies for electric vehicles and tax breaks, stimulate market expansion.
Challenges in the Light Vehicle Industry Market
The industry faces several challenges. Stringent emission regulations increase the cost of vehicle production, impacting profitability. Supply chain disruptions, particularly related to semiconductor chips and raw materials, create production bottlenecks. Intense competition among established players and the rise of new entrants intensify pricing pressure. These factors collectively impact profitability and growth trajectory.
Emerging Opportunities in Light Vehicle Industry
The long-term outlook for the light vehicle industry remains positive. Technological breakthroughs, such as the development of solid-state batteries and advanced autonomous driving capabilities, unlock significant growth potential. Strategic partnerships between established automakers and technology companies accelerate innovation. Market expansion into new regions, particularly in Africa and Southeast Asia, presents substantial opportunities for growth.
Leading Players in the Light Vehicle Industry Sector
- Ashok Leyland Limited
- Nissan Motor Co Ltd
- Isuzu Motors Limited
- General Motors Company
- Dongfeng Motor Corporation
- Volkswagen AG
- Daimler AG (Mercedes-Benz AG)
- Tata Motors Limited
- BAIC Motor Corporation Ltd
- Volvo Group
- Mahindra & Mahindra Limited
- BYD Auto Co Ltd
- Groupe Renault
- Rivian Automotive Inc
- Ford Motor Company
Key Milestones in Light Vehicle Industry Industry
- August 2023: General Motors announces the launch of an all-electric Cadillac Escalade in late 2024, signaling a significant push towards electric mobility.
- August 2023: General Motors reinforces its commitment to an electric future in the Middle East, reflecting growing demand in the region.
- August 2023: Gabriel India Limited announces the development of components for Maruti Suzuki Jimny and Stellantis electric Citroen C3, showcasing the growing role of component suppliers in the EV market.
Strategic Outlook for Light Vehicle Industry Market
The light vehicle industry is poised for continued growth, driven by technological innovation, supportive government policies, and increasing consumer demand for fuel-efficient and environmentally friendly vehicles. Strategic opportunities lie in investing in EV technologies, expanding into emerging markets, and forming strategic partnerships to accelerate innovation and market penetration. The future success of players will depend on their ability to adapt to evolving consumer preferences and regulatory landscapes.
Light Vehicle Industry Segmentation
-
1. Vehicle Type
-
1.1. Commercial Vehicles
- 1.1.1. Light Commercial Pick-up Trucks
- 1.1.2. Light Commercial Vans
-
1.1. Commercial Vehicles
-
2. Propulsion Type
-
2.1. Hybrid and Electric Vehicles
-
2.1.1. By Fuel Category
- 2.1.1.1. BEV
- 2.1.1.2. FCEV
- 2.1.1.3. HEV
- 2.1.1.4. PHEV
-
2.1.1. By Fuel Category
-
2.2. ICE
- 2.2.1. CNG
- 2.2.2. Diesel
- 2.2.3. Gasoline
- 2.2.4. LPG
-
2.1. Hybrid and Electric Vehicles
Light Vehicle Industry Segmentation By Geography
-
1. North America
- 1.1. United States
- 1.2. Canada
- 1.3. Mexico
-
2. South America
- 2.1. Brazil
- 2.2. Argentina
- 2.3. Rest of South America
-
3. Europe
- 3.1. United Kingdom
- 3.2. Germany
- 3.3. France
- 3.4. Italy
- 3.5. Spain
- 3.6. Russia
- 3.7. Benelux
- 3.8. Nordics
- 3.9. Rest of Europe
-
4. Middle East & Africa
- 4.1. Turkey
- 4.2. Israel
- 4.3. GCC
- 4.4. North Africa
- 4.5. South Africa
- 4.6. Rest of Middle East & Africa
-
5. Asia Pacific
- 5.1. China
- 5.2. India
- 5.3. Japan
- 5.4. South Korea
- 5.5. ASEAN
- 5.6. Oceania
- 5.7. Rest of Asia Pacific
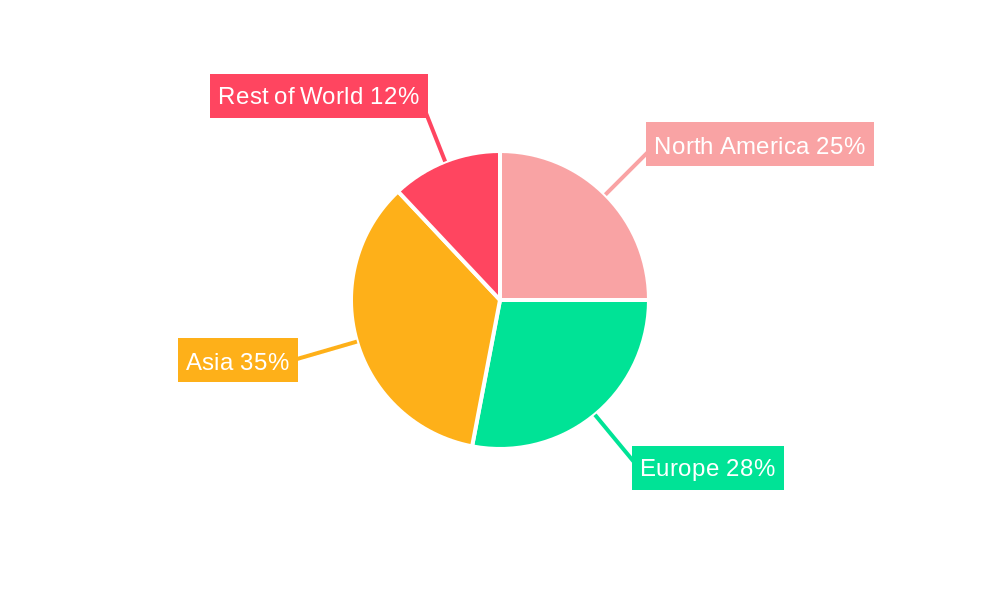
Light Vehicle Industry Regional Market Share
Geographic Coverage of Light Vehicle Industry
Light Vehicle Industry REPORT HIGHLIGHTS
| Aspects | Details |
|---|---|
| Study Period | 2020-2034 |
| Base Year | 2025 |
| Estimated Year | 2026 |
| Forecast Period | 2026-2034 |
| Historical Period | 2020-2025 |
| Growth Rate | CAGR of > 20.00% from 2020-2034 |
| Segmentation |
|
Table of Contents
- 1. Introduction
- 1.1. Research Scope
- 1.2. Market Segmentation
- 1.3. Research Objective
- 1.4. Definitions and Assumptions
- 2. Executive Summary
- 2.1. Market Snapshot
- 3. Market Dynamics
- 3.1. Market Drivers
- 3.2. Market Restrains
- 3.3. Market Trends
- 3.4. Market Opportunities
- 4. Market Factor Analysis
- 4.1. Porters Five Forces
- 4.1.1. Bargaining Power of Suppliers
- 4.1.2. Bargaining Power of Buyers
- 4.1.3. Threat of New Entrants
- 4.1.4. Threat of Substitutes
- 4.1.5. Competitive Rivalry
- 4.2. PESTEL analysis
- 4.3. BCG Analysis
- 4.3.1. Stars (High Growth, High Market Share)
- 4.3.2. Cash Cows (Low Growth, High Market Share)
- 4.3.3. Question Mark (High Growth, Low Market Share)
- 4.3.4. Dogs (Low Growth, Low Market Share)
- 4.4. Ansoff Matrix Analysis
- 4.5. Supply Chain Analysis
- 4.6. Regulatory Landscape
- 4.7. Current Market Potential and Opportunity Assessment (TAM–SAM–SOM Framework)
- 4.8. MDP Analyst Note
- 4.1. Porters Five Forces
- 5. Market Analysis, Insights and Forecast 2021-2033
- 5.1. Market Analysis, Insights and Forecast - by Vehicle Type
- 5.1.1. Commercial Vehicles
- 5.1.1.1. Light Commercial Pick-up Trucks
- 5.1.1.2. Light Commercial Vans
- 5.1.1. Commercial Vehicles
- 5.2. Market Analysis, Insights and Forecast - by Propulsion Type
- 5.2.1. Hybrid and Electric Vehicles
- 5.2.1.1. By Fuel Category
- 5.2.1.1.1. BEV
- 5.2.1.1.2. FCEV
- 5.2.1.1.3. HEV
- 5.2.1.1.4. PHEV
- 5.2.1.1. By Fuel Category
- 5.2.2. ICE
- 5.2.2.1. CNG
- 5.2.2.2. Diesel
- 5.2.2.3. Gasoline
- 5.2.2.4. LPG
- 5.2.1. Hybrid and Electric Vehicles
- 5.3. Market Analysis, Insights and Forecast - by Region
- 5.3.1. North America
- 5.3.2. South America
- 5.3.3. Europe
- 5.3.4. Middle East & Africa
- 5.3.5. Asia Pacific
- 5.1. Market Analysis, Insights and Forecast - by Vehicle Type
- 6. Global Light Vehicle Industry Analysis, Insights and Forecast, 2021-2033
- 6.1. Market Analysis, Insights and Forecast - by Vehicle Type
- 6.1.1. Commercial Vehicles
- 6.1.1.1. Light Commercial Pick-up Trucks
- 6.1.1.2. Light Commercial Vans
- 6.1.1. Commercial Vehicles
- 6.2. Market Analysis, Insights and Forecast - by Propulsion Type
- 6.2.1. Hybrid and Electric Vehicles
- 6.2.1.1. By Fuel Category
- 6.2.1.1.1. BEV
- 6.2.1.1.2. FCEV
- 6.2.1.1.3. HEV
- 6.2.1.1.4. PHEV
- 6.2.1.1. By Fuel Category
- 6.2.2. ICE
- 6.2.2.1. CNG
- 6.2.2.2. Diesel
- 6.2.2.3. Gasoline
- 6.2.2.4. LPG
- 6.2.1. Hybrid and Electric Vehicles
- 6.1. Market Analysis, Insights and Forecast - by Vehicle Type
- 7. North America Light Vehicle Industry Analysis, Insights and Forecast, 2020-2032
- 7.1. Market Analysis, Insights and Forecast - by Vehicle Type
- 7.1.1. Commercial Vehicles
- 7.1.1.1. Light Commercial Pick-up Trucks
- 7.1.1.2. Light Commercial Vans
- 7.1.1. Commercial Vehicles
- 7.2. Market Analysis, Insights and Forecast - by Propulsion Type
- 7.2.1. Hybrid and Electric Vehicles
- 7.2.1.1. By Fuel Category
- 7.2.1.1.1. BEV
- 7.2.1.1.2. FCEV
- 7.2.1.1.3. HEV
- 7.2.1.1.4. PHEV
- 7.2.1.1. By Fuel Category
- 7.2.2. ICE
- 7.2.2.1. CNG
- 7.2.2.2. Diesel
- 7.2.2.3. Gasoline
- 7.2.2.4. LPG
- 7.2.1. Hybrid and Electric Vehicles
- 7.1. Market Analysis, Insights and Forecast - by Vehicle Type
- 8. South America Light Vehicle Industry Analysis, Insights and Forecast, 2020-2032
- 8.1. Market Analysis, Insights and Forecast - by Vehicle Type
- 8.1.1. Commercial Vehicles
- 8.1.1.1. Light Commercial Pick-up Trucks
- 8.1.1.2. Light Commercial Vans
- 8.1.1. Commercial Vehicles
- 8.2. Market Analysis, Insights and Forecast - by Propulsion Type
- 8.2.1. Hybrid and Electric Vehicles
- 8.2.1.1. By Fuel Category
- 8.2.1.1.1. BEV
- 8.2.1.1.2. FCEV
- 8.2.1.1.3. HEV
- 8.2.1.1.4. PHEV
- 8.2.1.1. By Fuel Category
- 8.2.2. ICE
- 8.2.2.1. CNG
- 8.2.2.2. Diesel
- 8.2.2.3. Gasoline
- 8.2.2.4. LPG
- 8.2.1. Hybrid and Electric Vehicles
- 8.1. Market Analysis, Insights and Forecast - by Vehicle Type
- 9. Europe Light Vehicle Industry Analysis, Insights and Forecast, 2020-2032
- 9.1. Market Analysis, Insights and Forecast - by Vehicle Type
- 9.1.1. Commercial Vehicles
- 9.1.1.1. Light Commercial Pick-up Trucks
- 9.1.1.2. Light Commercial Vans
- 9.1.1. Commercial Vehicles
- 9.2. Market Analysis, Insights and Forecast - by Propulsion Type
- 9.2.1. Hybrid and Electric Vehicles
- 9.2.1.1. By Fuel Category
- 9.2.1.1.1. BEV
- 9.2.1.1.2. FCEV
- 9.2.1.1.3. HEV
- 9.2.1.1.4. PHEV
- 9.2.1.1. By Fuel Category
- 9.2.2. ICE
- 9.2.2.1. CNG
- 9.2.2.2. Diesel
- 9.2.2.3. Gasoline
- 9.2.2.4. LPG
- 9.2.1. Hybrid and Electric Vehicles
- 9.1. Market Analysis, Insights and Forecast - by Vehicle Type
- 10. Middle East & Africa Light Vehicle Industry Analysis, Insights and Forecast, 2020-2032
- 10.1. Market Analysis, Insights and Forecast - by Vehicle Type
- 10.1.1. Commercial Vehicles
- 10.1.1.1. Light Commercial Pick-up Trucks
- 10.1.1.2. Light Commercial Vans
- 10.1.1. Commercial Vehicles
- 10.2. Market Analysis, Insights and Forecast - by Propulsion Type
- 10.2.1. Hybrid and Electric Vehicles
- 10.2.1.1. By Fuel Category
- 10.2.1.1.1. BEV
- 10.2.1.1.2. FCEV
- 10.2.1.1.3. HEV
- 10.2.1.1.4. PHEV
- 10.2.1.1. By Fuel Category
- 10.2.2. ICE
- 10.2.2.1. CNG
- 10.2.2.2. Diesel
- 10.2.2.3. Gasoline
- 10.2.2.4. LPG
- 10.2.1. Hybrid and Electric Vehicles
- 10.1. Market Analysis, Insights and Forecast - by Vehicle Type
- 11. Asia Pacific Light Vehicle Industry Analysis, Insights and Forecast, 2020-2032
- 11.1. Market Analysis, Insights and Forecast - by Vehicle Type
- 11.1.1. Commercial Vehicles
- 11.1.1.1. Light Commercial Pick-up Trucks
- 11.1.1.2. Light Commercial Vans
- 11.1.1. Commercial Vehicles
- 11.2. Market Analysis, Insights and Forecast - by Propulsion Type
- 11.2.1. Hybrid and Electric Vehicles
- 11.2.1.1. By Fuel Category
- 11.2.1.1.1. BEV
- 11.2.1.1.2. FCEV
- 11.2.1.1.3. HEV
- 11.2.1.1.4. PHEV
- 11.2.1.1. By Fuel Category
- 11.2.2. ICE
- 11.2.2.1. CNG
- 11.2.2.2. Diesel
- 11.2.2.3. Gasoline
- 11.2.2.4. LPG
- 11.2.1. Hybrid and Electric Vehicles
- 11.1. Market Analysis, Insights and Forecast - by Vehicle Type
- 12. Competitive Analysis
- 12.1. Company Profiles
- 12.1.1 Ashok Leyland Limited
- 12.1.1.1. Company Overview
- 12.1.1.2. Products
- 12.1.1.3. Company Financials
- 12.1.1.4. SWOT Analysis
- 12.1.2 Nissan Motor Co Ltd
- 12.1.2.1. Company Overview
- 12.1.2.2. Products
- 12.1.2.3. Company Financials
- 12.1.2.4. SWOT Analysis
- 12.1.3 Isuzu Motors Limited
- 12.1.3.1. Company Overview
- 12.1.3.2. Products
- 12.1.3.3. Company Financials
- 12.1.3.4. SWOT Analysis
- 12.1.4 General Motors Company
- 12.1.4.1. Company Overview
- 12.1.4.2. Products
- 12.1.4.3. Company Financials
- 12.1.4.4. SWOT Analysis
- 12.1.5 Dongfeng Motor Corporation
- 12.1.5.1. Company Overview
- 12.1.5.2. Products
- 12.1.5.3. Company Financials
- 12.1.5.4. SWOT Analysis
- 12.1.6 Volkswagen AG
- 12.1.6.1. Company Overview
- 12.1.6.2. Products
- 12.1.6.3. Company Financials
- 12.1.6.4. SWOT Analysis
- 12.1.7 Daimler AG (Mercedes-Benz AG)
- 12.1.7.1. Company Overview
- 12.1.7.2. Products
- 12.1.7.3. Company Financials
- 12.1.7.4. SWOT Analysis
- 12.1.8 Tata Motors Limited
- 12.1.8.1. Company Overview
- 12.1.8.2. Products
- 12.1.8.3. Company Financials
- 12.1.8.4. SWOT Analysis
- 12.1.9 BAIC Motor Corporation Ltd
- 12.1.9.1. Company Overview
- 12.1.9.2. Products
- 12.1.9.3. Company Financials
- 12.1.9.4. SWOT Analysis
- 12.1.10 Volvo Grou
- 12.1.10.1. Company Overview
- 12.1.10.2. Products
- 12.1.10.3. Company Financials
- 12.1.10.4. SWOT Analysis
- 12.1.11 Mahindra & Mahindra Limited
- 12.1.11.1. Company Overview
- 12.1.11.2. Products
- 12.1.11.3. Company Financials
- 12.1.11.4. SWOT Analysis
- 12.1.12 BYD Auto Co Ltd
- 12.1.12.1. Company Overview
- 12.1.12.2. Products
- 12.1.12.3. Company Financials
- 12.1.12.4. SWOT Analysis
- 12.1.13 Groupe Renault
- 12.1.13.1. Company Overview
- 12.1.13.2. Products
- 12.1.13.3. Company Financials
- 12.1.13.4. SWOT Analysis
- 12.1.14 Rivian Automotive Inc
- 12.1.14.1. Company Overview
- 12.1.14.2. Products
- 12.1.14.3. Company Financials
- 12.1.14.4. SWOT Analysis
- 12.1.15 Ford Motor Company
- 12.1.15.1. Company Overview
- 12.1.15.2. Products
- 12.1.15.3. Company Financials
- 12.1.15.4. SWOT Analysis
- 12.1.1 Ashok Leyland Limited
- 12.2. Market Entropy
- 12.2.1 Company's Key Areas Served
- 12.2.2 Recent Developments
- 12.3. Company Market Share Analysis 2025
- 12.3.1 Top 5 Companies Market Share Analysis
- 12.3.2 Top 3 Companies Market Share Analysis
- 12.4. List of Potential Customers
- 13. Research Methodology
List of Figures
- Figure 1: Global Light Vehicle Industry Revenue Breakdown (Million, %) by Region 2025 & 2033
- Figure 2: North America Light Vehicle Industry Revenue (Million), by Vehicle Type 2025 & 2033
- Figure 3: North America Light Vehicle Industry Revenue Share (%), by Vehicle Type 2025 & 2033
- Figure 4: North America Light Vehicle Industry Revenue (Million), by Propulsion Type 2025 & 2033
- Figure 5: North America Light Vehicle Industry Revenue Share (%), by Propulsion Type 2025 & 2033
- Figure 6: North America Light Vehicle Industry Revenue (Million), by Country 2025 & 2033
- Figure 7: North America Light Vehicle Industry Revenue Share (%), by Country 2025 & 2033
- Figure 8: South America Light Vehicle Industry Revenue (Million), by Vehicle Type 2025 & 2033
- Figure 9: South America Light Vehicle Industry Revenue Share (%), by Vehicle Type 2025 & 2033
- Figure 10: South America Light Vehicle Industry Revenue (Million), by Propulsion Type 2025 & 2033
- Figure 11: South America Light Vehicle Industry Revenue Share (%), by Propulsion Type 2025 & 2033
- Figure 12: South America Light Vehicle Industry Revenue (Million), by Country 2025 & 2033
- Figure 13: South America Light Vehicle Industry Revenue Share (%), by Country 2025 & 2033
- Figure 14: Europe Light Vehicle Industry Revenue (Million), by Vehicle Type 2025 & 2033
- Figure 15: Europe Light Vehicle Industry Revenue Share (%), by Vehicle Type 2025 & 2033
- Figure 16: Europe Light Vehicle Industry Revenue (Million), by Propulsion Type 2025 & 2033
- Figure 17: Europe Light Vehicle Industry Revenue Share (%), by Propulsion Type 2025 & 2033
- Figure 18: Europe Light Vehicle Industry Revenue (Million), by Country 2025 & 2033
- Figure 19: Europe Light Vehicle Industry Revenue Share (%), by Country 2025 & 2033
- Figure 20: Middle East & Africa Light Vehicle Industry Revenue (Million), by Vehicle Type 2025 & 2033
- Figure 21: Middle East & Africa Light Vehicle Industry Revenue Share (%), by Vehicle Type 2025 & 2033
- Figure 22: Middle East & Africa Light Vehicle Industry Revenue (Million), by Propulsion Type 2025 & 2033
- Figure 23: Middle East & Africa Light Vehicle Industry Revenue Share (%), by Propulsion Type 2025 & 2033
- Figure 24: Middle East & Africa Light Vehicle Industry Revenue (Million), by Country 2025 & 2033
- Figure 25: Middle East & Africa Light Vehicle Industry Revenue Share (%), by Country 2025 & 2033
- Figure 26: Asia Pacific Light Vehicle Industry Revenue (Million), by Vehicle Type 2025 & 2033
- Figure 27: Asia Pacific Light Vehicle Industry Revenue Share (%), by Vehicle Type 2025 & 2033
- Figure 28: Asia Pacific Light Vehicle Industry Revenue (Million), by Propulsion Type 2025 & 2033
- Figure 29: Asia Pacific Light Vehicle Industry Revenue Share (%), by Propulsion Type 2025 & 2033
- Figure 30: Asia Pacific Light Vehicle Industry Revenue (Million), by Country 2025 & 2033
- Figure 31: Asia Pacific Light Vehicle Industry Revenue Share (%), by Country 2025 & 2033
List of Tables
- Table 1: Global Light Vehicle Industry Revenue Million Forecast, by Vehicle Type 2020 & 2033
- Table 2: Global Light Vehicle Industry Revenue Million Forecast, by Propulsion Type 2020 & 2033
- Table 3: Global Light Vehicle Industry Revenue Million Forecast, by Region 2020 & 2033
- Table 4: Global Light Vehicle Industry Revenue Million Forecast, by Vehicle Type 2020 & 2033
- Table 5: Global Light Vehicle Industry Revenue Million Forecast, by Propulsion Type 2020 & 2033
- Table 6: Global Light Vehicle Industry Revenue Million Forecast, by Country 2020 & 2033
- Table 7: United States Light Vehicle Industry Revenue (Million) Forecast, by Application 2020 & 2033
- Table 8: Canada Light Vehicle Industry Revenue (Million) Forecast, by Application 2020 & 2033
- Table 9: Mexico Light Vehicle Industry Revenue (Million) Forecast, by Application 2020 & 2033
- Table 10: Global Light Vehicle Industry Revenue Million Forecast, by Vehicle Type 2020 & 2033
- Table 11: Global Light Vehicle Industry Revenue Million Forecast, by Propulsion Type 2020 & 2033
- Table 12: Global Light Vehicle Industry Revenue Million Forecast, by Country 2020 & 2033
- Table 13: Brazil Light Vehicle Industry Revenue (Million) Forecast, by Application 2020 & 2033
- Table 14: Argentina Light Vehicle Industry Revenue (Million) Forecast, by Application 2020 & 2033
- Table 15: Rest of South America Light Vehicle Industry Revenue (Million) Forecast, by Application 2020 & 2033
- Table 16: Global Light Vehicle Industry Revenue Million Forecast, by Vehicle Type 2020 & 2033
- Table 17: Global Light Vehicle Industry Revenue Million Forecast, by Propulsion Type 2020 & 2033
- Table 18: Global Light Vehicle Industry Revenue Million Forecast, by Country 2020 & 2033
- Table 19: United Kingdom Light Vehicle Industry Revenue (Million) Forecast, by Application 2020 & 2033
- Table 20: Germany Light Vehicle Industry Revenue (Million) Forecast, by Application 2020 & 2033
- Table 21: France Light Vehicle Industry Revenue (Million) Forecast, by Application 2020 & 2033
- Table 22: Italy Light Vehicle Industry Revenue (Million) Forecast, by Application 2020 & 2033
- Table 23: Spain Light Vehicle Industry Revenue (Million) Forecast, by Application 2020 & 2033
- Table 24: Russia Light Vehicle Industry Revenue (Million) Forecast, by Application 2020 & 2033
- Table 25: Benelux Light Vehicle Industry Revenue (Million) Forecast, by Application 2020 & 2033
- Table 26: Nordics Light Vehicle Industry Revenue (Million) Forecast, by Application 2020 & 2033
- Table 27: Rest of Europe Light Vehicle Industry Revenue (Million) Forecast, by Application 2020 & 2033
- Table 28: Global Light Vehicle Industry Revenue Million Forecast, by Vehicle Type 2020 & 2033
- Table 29: Global Light Vehicle Industry Revenue Million Forecast, by Propulsion Type 2020 & 2033
- Table 30: Global Light Vehicle Industry Revenue Million Forecast, by Country 2020 & 2033
- Table 31: Turkey Light Vehicle Industry Revenue (Million) Forecast, by Application 2020 & 2033
- Table 32: Israel Light Vehicle Industry Revenue (Million) Forecast, by Application 2020 & 2033
- Table 33: GCC Light Vehicle Industry Revenue (Million) Forecast, by Application 2020 & 2033
- Table 34: North Africa Light Vehicle Industry Revenue (Million) Forecast, by Application 2020 & 2033
- Table 35: South Africa Light Vehicle Industry Revenue (Million) Forecast, by Application 2020 & 2033
- Table 36: Rest of Middle East & Africa Light Vehicle Industry Revenue (Million) Forecast, by Application 2020 & 2033
- Table 37: Global Light Vehicle Industry Revenue Million Forecast, by Vehicle Type 2020 & 2033
- Table 38: Global Light Vehicle Industry Revenue Million Forecast, by Propulsion Type 2020 & 2033
- Table 39: Global Light Vehicle Industry Revenue Million Forecast, by Country 2020 & 2033
- Table 40: China Light Vehicle Industry Revenue (Million) Forecast, by Application 2020 & 2033
- Table 41: India Light Vehicle Industry Revenue (Million) Forecast, by Application 2020 & 2033
- Table 42: Japan Light Vehicle Industry Revenue (Million) Forecast, by Application 2020 & 2033
- Table 43: South Korea Light Vehicle Industry Revenue (Million) Forecast, by Application 2020 & 2033
- Table 44: ASEAN Light Vehicle Industry Revenue (Million) Forecast, by Application 2020 & 2033
- Table 45: Oceania Light Vehicle Industry Revenue (Million) Forecast, by Application 2020 & 2033
- Table 46: Rest of Asia Pacific Light Vehicle Industry Revenue (Million) Forecast, by Application 2020 & 2033
Frequently Asked Questions
1. What is the projected Compound Annual Growth Rate (CAGR) of the Light Vehicle Industry?
The projected CAGR is approximately > 20.00%.
2. Which companies are prominent players in the Light Vehicle Industry?
Key companies in the market include Ashok Leyland Limited, Nissan Motor Co Ltd, Isuzu Motors Limited, General Motors Company, Dongfeng Motor Corporation, Volkswagen AG, Daimler AG (Mercedes-Benz AG), Tata Motors Limited, BAIC Motor Corporation Ltd, Volvo Grou, Mahindra & Mahindra Limited, BYD Auto Co Ltd, Groupe Renault, Rivian Automotive Inc, Ford Motor Company.
3. What are the main segments of the Light Vehicle Industry?
The market segments include Vehicle Type, Propulsion Type.
4. Can you provide details about the market size?
The market size is estimated to be USD XX Million as of 2022.
5. What are some drivers contributing to market growth?
Growing Travel and Tourism Industry is Driving the Car Rental Market.
6. What are the notable trends driving market growth?
OTHER KEY INDUSTRY TRENDS COVERED IN THE REPORT.
7. Are there any restraints impacting market growth?
Increasing Popularity of Ride-Sharing Services Pose Challenges for the Conventional Car Rental Market.
8. Can you provide examples of recent developments in the market?
August 2023: General Motors will launch an all-electric Cadillac Escalade in late 2024August 2023: General Motors doubles down on plans for an electric future in the Middle East.August 2023: Gabriel India Limited (Gabriel India), a flagship company of Anand Group, announced that during the quarter that ended on June 30, 2023, it has developed components for Maruti Suzuki Jimny and Stellantis electric Citroen C3. At present it is developing parts for new models of VW, Tata, Stellantis, Mahindra, and Maruti Suzuki.
9. What pricing options are available for accessing the report?
Pricing options include single-user, multi-user, and enterprise licenses priced at USD 3800, USD 4500, and USD 5800 respectively.
10. Is the market size provided in terms of value or volume?
The market size is provided in terms of value, measured in Million.
11. Are there any specific market keywords associated with the report?
Yes, the market keyword associated with the report is "Light Vehicle Industry," which aids in identifying and referencing the specific market segment covered.
12. How do I determine which pricing option suits my needs best?
The pricing options vary based on user requirements and access needs. Individual users may opt for single-user licenses, while businesses requiring broader access may choose multi-user or enterprise licenses for cost-effective access to the report.
13. Are there any additional resources or data provided in the Light Vehicle Industry report?
While the report offers comprehensive insights, it's advisable to review the specific contents or supplementary materials provided to ascertain if additional resources or data are available.
14. How can I stay updated on further developments or reports in the Light Vehicle Industry?
To stay informed about further developments, trends, and reports in the Light Vehicle Industry, consider subscribing to industry newsletters, following relevant companies and organizations, or regularly checking reputable industry news sources and publications.
Methodology
Step 1 - Identification of Relevant Samples Size from Population Database


Step 2 - Approaches for Defining Global Market Size (Value, Volume* & Price*)

Note*: In applicable scenarios
Step 3 - Data Sources
Primary Research
- Web Analytics
- Survey Reports
- Research Institute
- Latest Research Reports
- Opinion Leaders
Secondary Research
- Annual Reports
- White Paper
- Latest Press Release
- Industry Association
- Paid Database
- Investor Presentations

Step 4 - Data Triangulation
Involves using different sources of information in order to increase the validity of a study
These sources are likely to be stakeholders in a program - participants, other researchers, program staff, other community members, and so on.
Then we put all data in single framework & apply various statistical tools to find out the dynamic on the market.
During the analysis stage, feedback from the stakeholder groups would be compared to determine areas of agreement as well as areas of divergence