

Key Insights
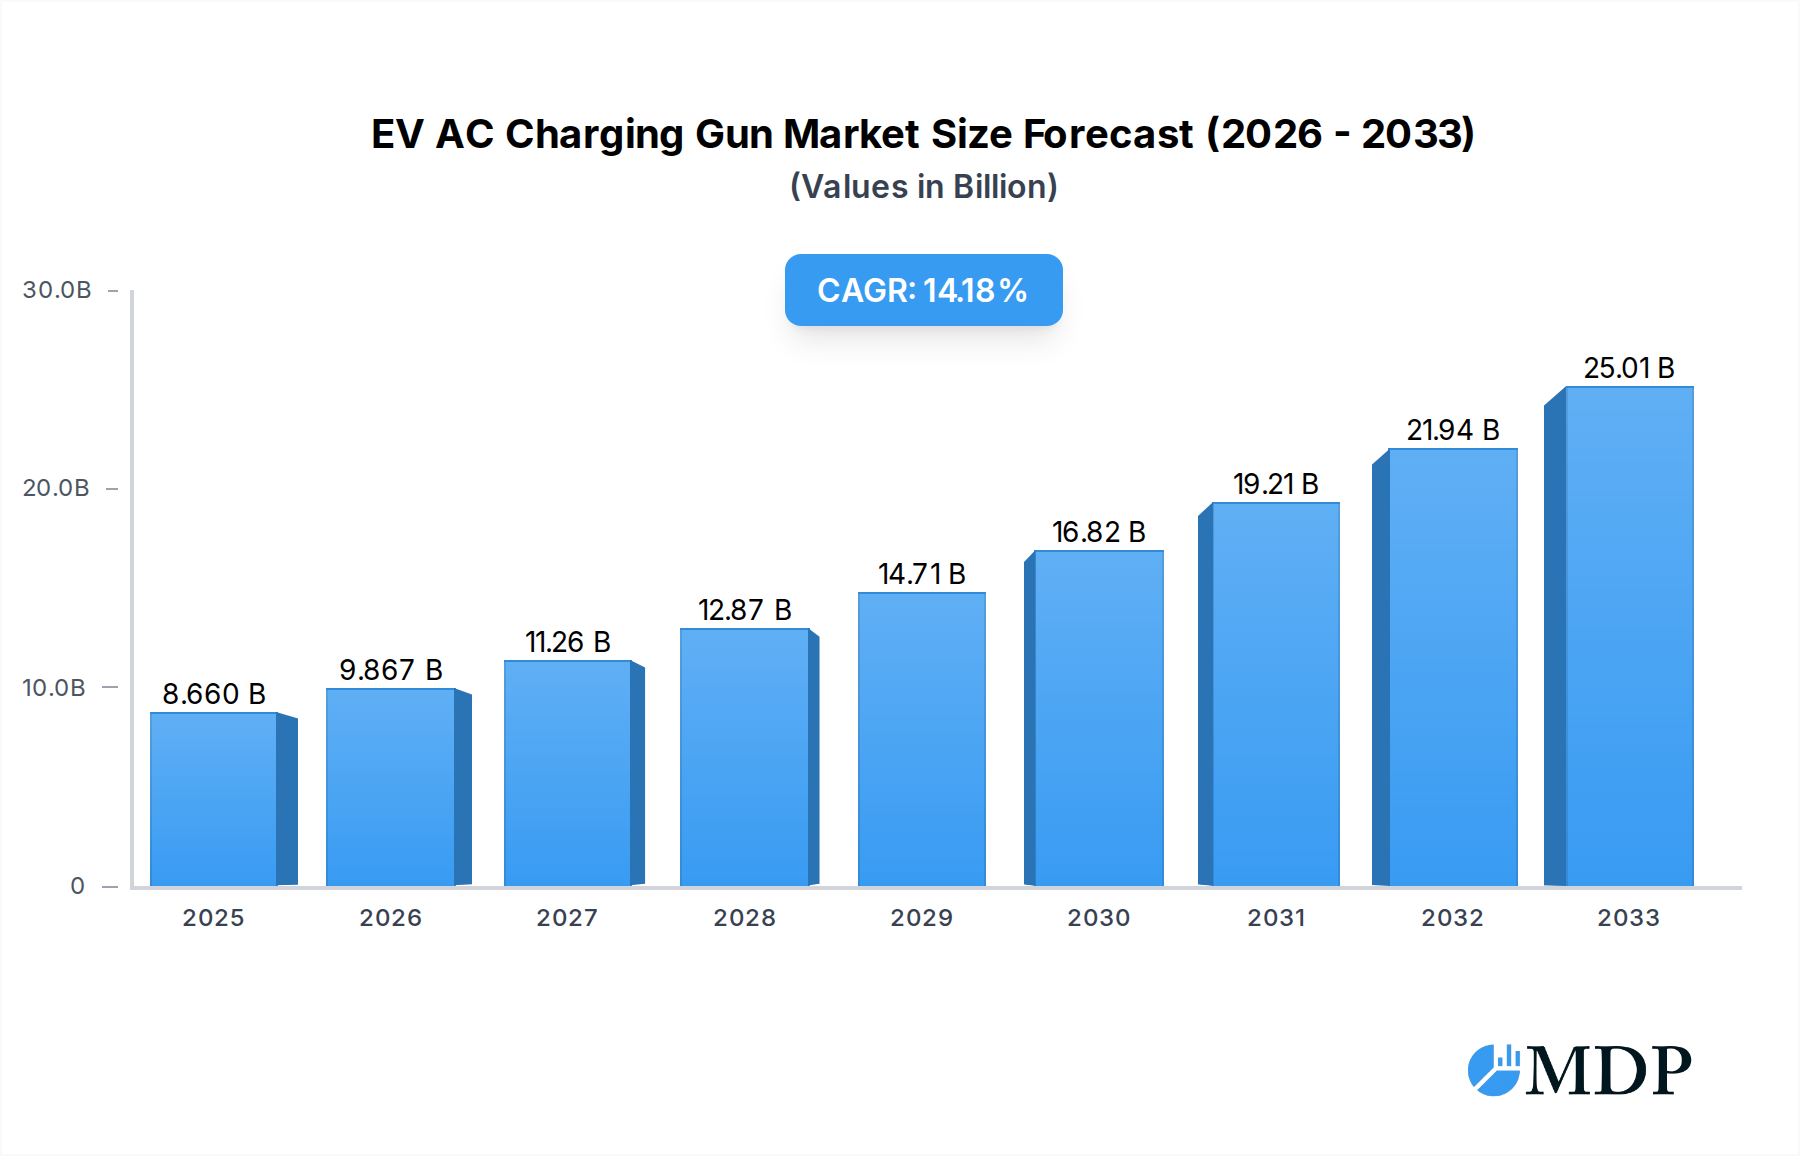
The global market for EV AC Charging Guns is poised for significant expansion, projected to reach $8.66 billion in 2025 and demonstrating a robust Compound Annual Growth Rate (CAGR) of 13.95% through 2033. This substantial growth is primarily driven by the accelerating adoption of electric vehicles worldwide, fueled by government incentives, increasing environmental consciousness, and advancements in battery technology that enhance EV range and performance. The expanding charging infrastructure, encompassing both public and private installations, is a critical enabler, directly correlating with the demand for reliable and efficient AC charging guns. Key applications within this market include commercial vehicles and passenger cars, both experiencing a surge in electrification. The trend towards smart charging solutions, offering greater control, grid integration, and optimized energy management, is also a significant growth catalyst. Furthermore, the increasing focus on fast charging capabilities and the development of portable and versatile charging gun designs are shaping market dynamics.

EV AC Charging Gun Market Size (In Billion)
Despite the promising outlook, the market faces certain restraints. High initial costs associated with advanced charging solutions and the need for widespread standardization across different EV models and charging networks can pose challenges to rapid market penetration. Furthermore, the availability and reliability of the electricity grid in certain regions, alongside regulatory hurdles and complex permitting processes for charging station installations, can impede progress. However, ongoing technological innovations, such as the integration of wireless charging capabilities and enhanced safety features, are expected to mitigate these restraints. The market is segmented by type into stationary and mobile charging solutions, with both segments witnessing growth as the charging infrastructure diversifies to meet the varied needs of EV users, from home charging to on-the-go convenience. Leading companies are actively investing in R&D to offer innovative and competitive products, further stimulating market growth.
EV AC Charging Gun Company Market Share
Report Description: EV AC Charging Gun Market Insights - 2019-2033: Forecasts, Trends, and Key Player Analysis
Unlock critical insights into the burgeoning EV AC charging gun market with this comprehensive report. Analyzing the period from 2019 to 2033, with a base year of 2025 and an extensive forecast period from 2025 to 2033, this study provides an in-depth look at market dynamics, industry trends, leading segments, and strategic outlooks. Essential for automotive manufacturers, charging infrastructure providers, component suppliers, and investors, this report illuminates market concentration, innovation drivers, and regulatory landscapes shaping the future of electric vehicle charging. Discover key growth drivers, technological disruptions, and emerging opportunities within this rapidly evolving sector.
EV AC Charging Gun Market Dynamics & Concentration
The global EV AC charging gun market exhibits a moderate level of concentration, with a significant portion of market share held by a handful of established players. However, the increasing demand for electric vehicles and the corresponding expansion of charging infrastructure are fostering an environment conducive to the entry of new innovators and regional specialists. Key drivers of innovation include the relentless pursuit of faster charging speeds, enhanced safety features, and improved user convenience. Regulatory frameworks are playing a pivotal role, with governments worldwide implementing mandates and incentives to accelerate EV adoption and charging network deployment, influencing product design and interoperability standards. Product substitutes, while nascent, are being closely monitored, particularly advancements in DC fast charging and wireless charging technologies, which could impact the long-term demand for AC charging guns. End-user trends are characterized by a growing preference for smart charging solutions, bidirectional charging capabilities, and aesthetically integrated charging hardware. Mergers and acquisitions (M&A) activities within the EV charging ecosystem are on the rise as companies seek to consolidate their market positions, expand their technological portfolios, and secure supply chain resilience. The number of M&A deals in the broader EV charging infrastructure sector is projected to reach 400 by the end of the forecast period, indicating significant consolidation and strategic maneuvering. Market share estimations for leading companies are dynamic, with key players like SINBON and Phoenix Contact holding substantial, though fluctuating, percentages of the market.
EV AC Charging Gun Industry Trends & Analysis
The EV AC charging gun industry is experiencing robust growth, driven by an unprecedented surge in electric vehicle sales and a global commitment to decarbonization. The market is projected to witness a Compound Annual Growth Rate (CAGR) of approximately 22.5% during the forecast period (2025–2033). This impressive expansion is fueled by several interconnected factors. Technological disruptions are at the forefront, with continuous innovation in materials science, power electronics, and connectivity solutions enhancing the performance, durability, and intelligence of charging guns. Advancements in smart grid integration and the development of advanced safety mechanisms, such as improved insulation and fault detection, are becoming standard. Consumer preferences are evolving rapidly, with a growing demand for user-friendly interfaces, compatibility with a wide range of EVs, and the integration of mobile app control for scheduling and monitoring charging sessions. The convenience and affordability of AC charging, especially for overnight or workplace charging, continue to make it a preferred option for many EV owners. Competitive dynamics are intensifying, characterized by fierce price competition, product differentiation through unique features, and strategic partnerships between charging gun manufacturers and EV OEMs. The increasing market penetration of EVs across developed and developing economies is creating a vast and expanding customer base for AC charging solutions. By the end of the study period, the market penetration of EV AC charging guns is expected to surpass 75% in key automotive markets. This sustained growth is further supported by ongoing investments in charging infrastructure development, aimed at alleviating range anxiety and promoting widespread EV adoption. The development of higher power AC charging solutions, bridging the gap between Level 1 and Level 2 charging, is also a significant trend, offering a faster charging experience without the higher costs associated with DC fast chargers. Furthermore, the standardization of charging connectors and protocols is simplifying integration and improving interoperability, thereby fostering market expansion. The growing awareness of environmental benefits and government subsidies for EV purchases and charging installations are also significant contributors to this upward trajectory.
Leading Markets & Segments in EV AC Charging Gun
The Passenger Car segment, particularly within the Asia-Pacific region, stands out as the dominant market for EV AC charging guns. This supremacy is attributed to a confluence of factors, including the world's largest EV manufacturing base and a rapidly growing consumer market for electric vehicles in countries like China. The economic policies in these nations, characterized by substantial subsidies for EV purchases and aggressive targets for charging infrastructure deployment, have created an exceptionally fertile ground for AC charging gun adoption.
- Key Drivers of Dominance in Asia-Pacific (Passenger Car Segment):
- Government Incentives and Subsidies: Significant financial support for EV buyers and charging infrastructure developers.
- Rapid EV Adoption: Unprecedented growth in the sales of electric passenger cars.
- Extensive Charging Network Expansion: Government and private sector investments in public and private charging stations.
- Technological Advancements: Local manufacturers are at the forefront of developing innovative and cost-effective charging solutions.
- Urbanization and Commuting Patterns: High population density and increasing urbanization necessitate convenient and accessible charging solutions for daily commutes.
The Stationary type of EV AC charging gun commands a larger market share compared to its mobile counterpart, primarily due to the widespread need for permanent charging solutions at homes, workplaces, and public charging stations. The sheer volume of residential installations, driven by the convenience of overnight charging, forms the bedrock of this segment's dominance.
- Key Drivers of Dominance for Stationary Charging Guns:
- Residential Charging Convenience: Home charging provides unparalleled convenience for EV owners.
- Workplace Charging Infrastructure: Increasing installation of charging points in corporate environments.
- Public Charging Stations: Ubiquitous deployment in parking lots, retail centers, and public spaces.
- Reliability and Durability: Stationary units are designed for continuous use and often offer higher power outputs.
- Cost-Effectiveness: Compared to DC fast charging, stationary AC charging solutions represent a more economical initial investment.
While the Passenger Car segment and Stationary type are dominant, the Commercial Vehicle segment is poised for significant growth, driven by fleet electrification initiatives and the operational cost savings associated with EVs. The strategic implementation of charging infrastructure at depots and hubs will be critical for this segment's expansion.
EV AC Charging Gun Product Developments
Recent product developments in the EV AC charging gun sector are characterized by a focus on enhanced safety, increased charging speeds, and greater interoperability. Manufacturers are integrating advanced cooling systems and robust insulation materials to support higher amperage charging, reducing charging times for passenger cars and commercial vehicles alike. The incorporation of smart features, such as Wi-Fi and Bluetooth connectivity, allows for remote monitoring, control, and software updates, providing users with a more integrated and convenient charging experience. Furthermore, the development of ruggedized and weather-resistant designs is crucial for the durability of stationary charging guns, while compact and portable designs are emerging for mobile applications. Competitive advantages are being gained through innovations in user interface design, energy management capabilities, and the seamless integration with existing smart home or building management systems.
Key Drivers of EV AC Charging Gun Growth
The EV AC charging gun market is propelled by a multifaceted set of growth drivers. Government mandates and incentives aimed at promoting EV adoption and building out charging infrastructure are a primary catalyst. The rapidly declining costs of EV batteries and the increasing range of electric vehicles are making them more accessible and practical for a wider consumer base. Technological advancements in charging efficiency and safety features, such as improved thermal management and smart grid compatibility, are enhancing user experience and reliability. Furthermore, the growing environmental consciousness and the desire to reduce carbon emissions are influencing consumer purchasing decisions, leading to a greater demand for electric mobility solutions. The expansion of charging infrastructure, both public and private, is crucial for alleviating range anxiety and fostering widespread adoption.
Challenges in the EV AC Charging Gun Market
Despite the robust growth trajectory, the EV AC charging gun market faces several challenges. Standardization issues across different regions and EV manufacturers can lead to compatibility concerns and fragmented infrastructure. Supply chain disruptions, particularly for critical components like semiconductors and specialized plastics, can impact production volumes and lead to price volatility. The high initial cost of installing charging infrastructure, especially for large-scale commercial deployments, can be a deterrent for some businesses. Intense competition among manufacturers, coupled with the commoditization of basic charging gun models, can put pressure on profit margins. Regulatory hurdles and the complexity of obtaining permits for charging station installations in some areas can also slow down market expansion.
Emerging Opportunities in EV AC Charging Gun
Emerging opportunities in the EV AC charging gun market are abundant and driven by several key catalysts. The rapid growth of the electric commercial vehicle sector presents a significant opportunity for higher-power AC charging solutions designed for fleet operations and depot charging. Strategic partnerships between charging gun manufacturers and EV original equipment manufacturers (OEMs) are crucial for developing integrated charging solutions and ensuring seamless interoperability. The development of bidirectional charging capabilities, allowing EVs to supply power back to the grid or a home, opens new revenue streams and enhances grid stability. Furthermore, the expansion of charging infrastructure into underserved markets, such as rural areas and developing economies, offers substantial growth potential. Innovations in smart charging technologies, including vehicle-to-grid (V2G) integration and load balancing, will be key to unlocking further value.
Leading Players in the EV AC Charging Gun Sector
- SINBON
- Phoenix Contact
- JAE
- Volex
- Delphi
- Sumitomo Electric Industries
- Aptiv
- ITT Cannon
- BULL
- Youcheng New Energy
- Shenglan Technology
- Shenzhen Woer Heat
- Weihai HonglinElectronic
- Suzhou Recodeal
- Saichuan Electronics
- Zhejiang Wanma
- AG Electrical
- Guangzhou Zeesung
- Suzhou Yeeda
Key Milestones in EV AC Charging Gun Industry
- 2019/Q1: Introduction of the first smart AC charging guns with integrated Wi-Fi connectivity.
- 2019/Q3: Major automotive OEM announces strategic partnership with a leading charging gun manufacturer to integrate proprietary charging solutions.
- 2020/Q2: Significant advancements in high-power AC charging technology enabling faster charging for specific EV models.
- 2021/Q1: A key player in the industry completes a substantial acquisition of a smaller competitor, consolidating market share.
- 2021/Q4: Release of new charging gun standards by international bodies, promoting interoperability and safety.
- 2022/Q3: Introduction of bidirectional charging capabilities in select AC charging gun models.
- 2023/Q1: Expansion of manufacturing facilities by several leading players to meet burgeoning global demand.
- 2023/Q4: Growing trend of smart home integration for EV charging solutions.
- 2024/Q2: Development of more robust and weather-resistant charging guns for harsh environmental conditions.
Strategic Outlook for EV AC Charging Gun Market
The strategic outlook for the EV AC charging gun market is overwhelmingly positive, driven by the accelerating global transition to electric mobility. Key growth accelerators include the continued expansion of EV sales, supported by government policies and consumer demand for sustainable transportation. The ongoing innovation in charging technology, particularly in areas of speed, intelligence, and bidirectional capabilities, will further enhance the appeal and functionality of AC charging solutions. Strategic opportunities lie in the development of robust charging ecosystems that integrate seamlessly with smart grids and renewable energy sources. Partnerships between charging hardware manufacturers, EV OEMs, and utility companies will be crucial for scaling infrastructure and optimizing charging experiences. The increasing focus on fleet electrification, especially for commercial vehicles, presents a significant avenue for growth, requiring the development of specialized and high-capacity AC charging solutions.
EV AC Charging Gun Segmentation
-
1. Application
- 1.1. Commercial Vehicle
- 1.2. Passenger Car
-
2. Types
- 2.1. Stationary
- 2.2. Mobile
EV AC Charging Gun Segmentation By Geography
-
1. North America
- 1.1. United States
- 1.2. Canada
- 1.3. Mexico
-
2. South America
- 2.1. Brazil
- 2.2. Argentina
- 2.3. Rest of South America
-
3. Europe
- 3.1. United Kingdom
- 3.2. Germany
- 3.3. France
- 3.4. Italy
- 3.5. Spain
- 3.6. Russia
- 3.7. Benelux
- 3.8. Nordics
- 3.9. Rest of Europe
-
4. Middle East & Africa
- 4.1. Turkey
- 4.2. Israel
- 4.3. GCC
- 4.4. North Africa
- 4.5. South Africa
- 4.6. Rest of Middle East & Africa
-
5. Asia Pacific
- 5.1. China
- 5.2. India
- 5.3. Japan
- 5.4. South Korea
- 5.5. ASEAN
- 5.6. Oceania
- 5.7. Rest of Asia Pacific
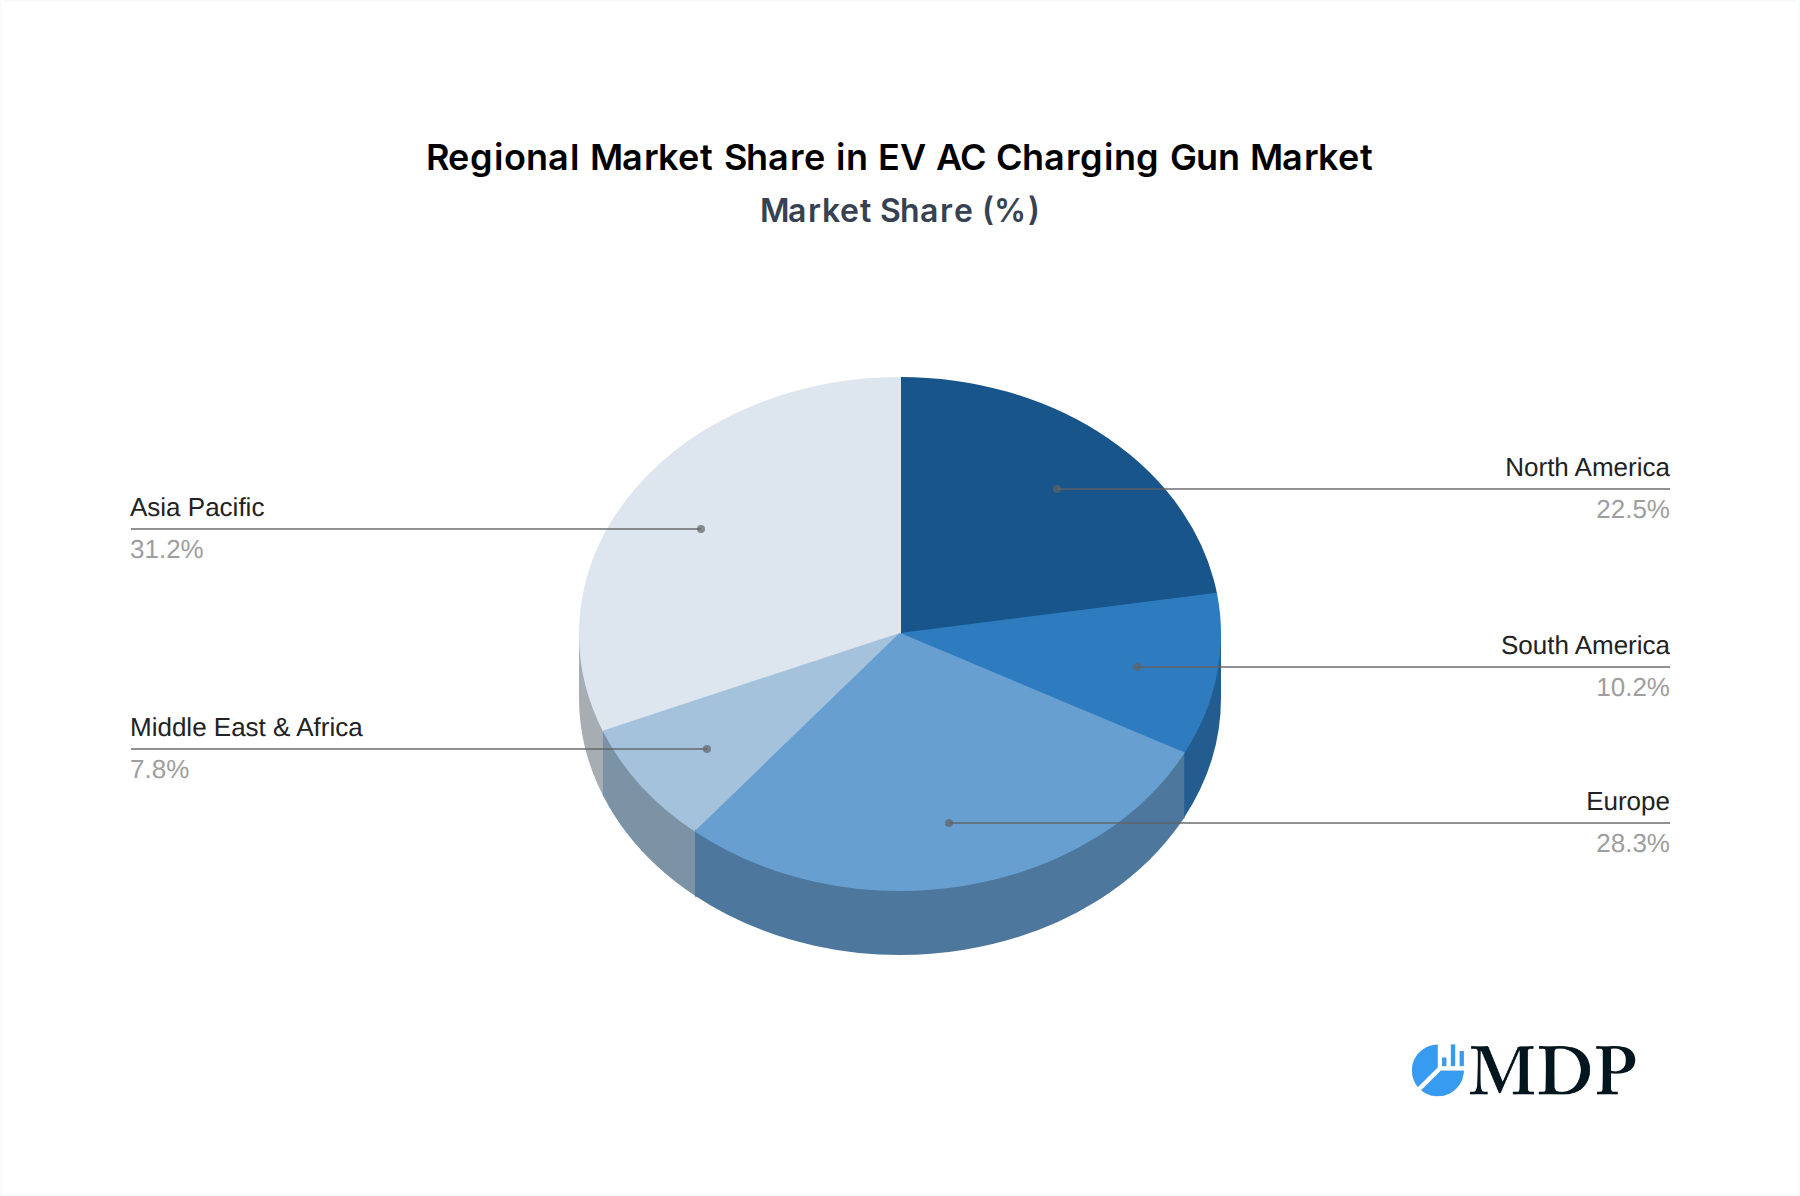
EV AC Charging Gun Regional Market Share
Geographic Coverage of EV AC Charging Gun
EV AC Charging Gun REPORT HIGHLIGHTS
| Aspects | Details |
|---|---|
| Study Period | 2020-2034 |
| Base Year | 2025 |
| Estimated Year | 2026 |
| Forecast Period | 2026-2034 |
| Historical Period | 2020-2025 |
| Growth Rate | CAGR of 13.95% from 2020-2034 |
| Segmentation |
|
Table of Contents
- 1. Introduction
- 1.1. Research Scope
- 1.2. Market Segmentation
- 1.3. Research Methodology
- 1.4. Definitions and Assumptions
- 2. Executive Summary
- 2.1. Introduction
- 3. Market Dynamics
- 3.1. Introduction
- 3.2. Market Drivers
- 3.3. Market Restrains
- 3.4. Market Trends
- 4. Market Factor Analysis
- 4.1. Porters Five Forces
- 4.2. Supply/Value Chain
- 4.3. PESTEL analysis
- 4.4. Market Entropy
- 4.5. Patent/Trademark Analysis
- 5. Global EV AC Charging Gun Analysis, Insights and Forecast, 2020-2032
- 5.1. Market Analysis, Insights and Forecast - by Application
- 5.1.1. Commercial Vehicle
- 5.1.2. Passenger Car
- 5.2. Market Analysis, Insights and Forecast - by Types
- 5.2.1. Stationary
- 5.2.2. Mobile
- 5.3. Market Analysis, Insights and Forecast - by Region
- 5.3.1. North America
- 5.3.2. South America
- 5.3.3. Europe
- 5.3.4. Middle East & Africa
- 5.3.5. Asia Pacific
- 5.1. Market Analysis, Insights and Forecast - by Application
- 6. North America EV AC Charging Gun Analysis, Insights and Forecast, 2020-2032
- 6.1. Market Analysis, Insights and Forecast - by Application
- 6.1.1. Commercial Vehicle
- 6.1.2. Passenger Car
- 6.2. Market Analysis, Insights and Forecast - by Types
- 6.2.1. Stationary
- 6.2.2. Mobile
- 6.1. Market Analysis, Insights and Forecast - by Application
- 7. South America EV AC Charging Gun Analysis, Insights and Forecast, 2020-2032
- 7.1. Market Analysis, Insights and Forecast - by Application
- 7.1.1. Commercial Vehicle
- 7.1.2. Passenger Car
- 7.2. Market Analysis, Insights and Forecast - by Types
- 7.2.1. Stationary
- 7.2.2. Mobile
- 7.1. Market Analysis, Insights and Forecast - by Application
- 8. Europe EV AC Charging Gun Analysis, Insights and Forecast, 2020-2032
- 8.1. Market Analysis, Insights and Forecast - by Application
- 8.1.1. Commercial Vehicle
- 8.1.2. Passenger Car
- 8.2. Market Analysis, Insights and Forecast - by Types
- 8.2.1. Stationary
- 8.2.2. Mobile
- 8.1. Market Analysis, Insights and Forecast - by Application
- 9. Middle East & Africa EV AC Charging Gun Analysis, Insights and Forecast, 2020-2032
- 9.1. Market Analysis, Insights and Forecast - by Application
- 9.1.1. Commercial Vehicle
- 9.1.2. Passenger Car
- 9.2. Market Analysis, Insights and Forecast - by Types
- 9.2.1. Stationary
- 9.2.2. Mobile
- 9.1. Market Analysis, Insights and Forecast - by Application
- 10. Asia Pacific EV AC Charging Gun Analysis, Insights and Forecast, 2020-2032
- 10.1. Market Analysis, Insights and Forecast - by Application
- 10.1.1. Commercial Vehicle
- 10.1.2. Passenger Car
- 10.2. Market Analysis, Insights and Forecast - by Types
- 10.2.1. Stationary
- 10.2.2. Mobile
- 10.1. Market Analysis, Insights and Forecast - by Application
- 11. Competitive Analysis
- 11.1. Global Market Share Analysis 2025
- 11.2. Company Profiles
- 11.2.1 SINBON
- 11.2.1.1. Overview
- 11.2.1.2. Products
- 11.2.1.3. SWOT Analysis
- 11.2.1.4. Recent Developments
- 11.2.1.5. Financials (Based on Availability)
- 11.2.2 Phoenix Contact
- 11.2.2.1. Overview
- 11.2.2.2. Products
- 11.2.2.3. SWOT Analysis
- 11.2.2.4. Recent Developments
- 11.2.2.5. Financials (Based on Availability)
- 11.2.3 JAE
- 11.2.3.1. Overview
- 11.2.3.2. Products
- 11.2.3.3. SWOT Analysis
- 11.2.3.4. Recent Developments
- 11.2.3.5. Financials (Based on Availability)
- 11.2.4 Volex
- 11.2.4.1. Overview
- 11.2.4.2. Products
- 11.2.4.3. SWOT Analysis
- 11.2.4.4. Recent Developments
- 11.2.4.5. Financials (Based on Availability)
- 11.2.5 Delphi
- 11.2.5.1. Overview
- 11.2.5.2. Products
- 11.2.5.3. SWOT Analysis
- 11.2.5.4. Recent Developments
- 11.2.5.5. Financials (Based on Availability)
- 11.2.6 Sumitomo Electric Industries
- 11.2.6.1. Overview
- 11.2.6.2. Products
- 11.2.6.3. SWOT Analysis
- 11.2.6.4. Recent Developments
- 11.2.6.5. Financials (Based on Availability)
- 11.2.7 Aptiv
- 11.2.7.1. Overview
- 11.2.7.2. Products
- 11.2.7.3. SWOT Analysis
- 11.2.7.4. Recent Developments
- 11.2.7.5. Financials (Based on Availability)
- 11.2.8 ITT Cannon
- 11.2.8.1. Overview
- 11.2.8.2. Products
- 11.2.8.3. SWOT Analysis
- 11.2.8.4. Recent Developments
- 11.2.8.5. Financials (Based on Availability)
- 11.2.9 BULL
- 11.2.9.1. Overview
- 11.2.9.2. Products
- 11.2.9.3. SWOT Analysis
- 11.2.9.4. Recent Developments
- 11.2.9.5. Financials (Based on Availability)
- 11.2.10 Youcheng New Energy
- 11.2.10.1. Overview
- 11.2.10.2. Products
- 11.2.10.3. SWOT Analysis
- 11.2.10.4. Recent Developments
- 11.2.10.5. Financials (Based on Availability)
- 11.2.11 Shenglan Technology
- 11.2.11.1. Overview
- 11.2.11.2. Products
- 11.2.11.3. SWOT Analysis
- 11.2.11.4. Recent Developments
- 11.2.11.5. Financials (Based on Availability)
- 11.2.12 Shenzhen Woer Heat
- 11.2.12.1. Overview
- 11.2.12.2. Products
- 11.2.12.3. SWOT Analysis
- 11.2.12.4. Recent Developments
- 11.2.12.5. Financials (Based on Availability)
- 11.2.13 Weihai HonglinElectronic
- 11.2.13.1. Overview
- 11.2.13.2. Products
- 11.2.13.3. SWOT Analysis
- 11.2.13.4. Recent Developments
- 11.2.13.5. Financials (Based on Availability)
- 11.2.14 Suzhou Recodeal
- 11.2.14.1. Overview
- 11.2.14.2. Products
- 11.2.14.3. SWOT Analysis
- 11.2.14.4. Recent Developments
- 11.2.14.5. Financials (Based on Availability)
- 11.2.15 Saichuan Electronics
- 11.2.15.1. Overview
- 11.2.15.2. Products
- 11.2.15.3. SWOT Analysis
- 11.2.15.4. Recent Developments
- 11.2.15.5. Financials (Based on Availability)
- 11.2.16 Zhejiang Wanma
- 11.2.16.1. Overview
- 11.2.16.2. Products
- 11.2.16.3. SWOT Analysis
- 11.2.16.4. Recent Developments
- 11.2.16.5. Financials (Based on Availability)
- 11.2.17 AG Electrical
- 11.2.17.1. Overview
- 11.2.17.2. Products
- 11.2.17.3. SWOT Analysis
- 11.2.17.4. Recent Developments
- 11.2.17.5. Financials (Based on Availability)
- 11.2.18 Guangzhou Zeesung
- 11.2.18.1. Overview
- 11.2.18.2. Products
- 11.2.18.3. SWOT Analysis
- 11.2.18.4. Recent Developments
- 11.2.18.5. Financials (Based on Availability)
- 11.2.19 Suzhou Yeeda
- 11.2.19.1. Overview
- 11.2.19.2. Products
- 11.2.19.3. SWOT Analysis
- 11.2.19.4. Recent Developments
- 11.2.19.5. Financials (Based on Availability)
- 11.2.1 SINBON
List of Figures
- Figure 1: Global EV AC Charging Gun Revenue Breakdown (billion, %) by Region 2025 & 2033
- Figure 2: Global EV AC Charging Gun Volume Breakdown (K, %) by Region 2025 & 2033
- Figure 3: North America EV AC Charging Gun Revenue (billion), by Application 2025 & 2033
- Figure 4: North America EV AC Charging Gun Volume (K), by Application 2025 & 2033
- Figure 5: North America EV AC Charging Gun Revenue Share (%), by Application 2025 & 2033
- Figure 6: North America EV AC Charging Gun Volume Share (%), by Application 2025 & 2033
- Figure 7: North America EV AC Charging Gun Revenue (billion), by Types 2025 & 2033
- Figure 8: North America EV AC Charging Gun Volume (K), by Types 2025 & 2033
- Figure 9: North America EV AC Charging Gun Revenue Share (%), by Types 2025 & 2033
- Figure 10: North America EV AC Charging Gun Volume Share (%), by Types 2025 & 2033
- Figure 11: North America EV AC Charging Gun Revenue (billion), by Country 2025 & 2033
- Figure 12: North America EV AC Charging Gun Volume (K), by Country 2025 & 2033
- Figure 13: North America EV AC Charging Gun Revenue Share (%), by Country 2025 & 2033
- Figure 14: North America EV AC Charging Gun Volume Share (%), by Country 2025 & 2033
- Figure 15: South America EV AC Charging Gun Revenue (billion), by Application 2025 & 2033
- Figure 16: South America EV AC Charging Gun Volume (K), by Application 2025 & 2033
- Figure 17: South America EV AC Charging Gun Revenue Share (%), by Application 2025 & 2033
- Figure 18: South America EV AC Charging Gun Volume Share (%), by Application 2025 & 2033
- Figure 19: South America EV AC Charging Gun Revenue (billion), by Types 2025 & 2033
- Figure 20: South America EV AC Charging Gun Volume (K), by Types 2025 & 2033
- Figure 21: South America EV AC Charging Gun Revenue Share (%), by Types 2025 & 2033
- Figure 22: South America EV AC Charging Gun Volume Share (%), by Types 2025 & 2033
- Figure 23: South America EV AC Charging Gun Revenue (billion), by Country 2025 & 2033
- Figure 24: South America EV AC Charging Gun Volume (K), by Country 2025 & 2033
- Figure 25: South America EV AC Charging Gun Revenue Share (%), by Country 2025 & 2033
- Figure 26: South America EV AC Charging Gun Volume Share (%), by Country 2025 & 2033
- Figure 27: Europe EV AC Charging Gun Revenue (billion), by Application 2025 & 2033
- Figure 28: Europe EV AC Charging Gun Volume (K), by Application 2025 & 2033
- Figure 29: Europe EV AC Charging Gun Revenue Share (%), by Application 2025 & 2033
- Figure 30: Europe EV AC Charging Gun Volume Share (%), by Application 2025 & 2033
- Figure 31: Europe EV AC Charging Gun Revenue (billion), by Types 2025 & 2033
- Figure 32: Europe EV AC Charging Gun Volume (K), by Types 2025 & 2033
- Figure 33: Europe EV AC Charging Gun Revenue Share (%), by Types 2025 & 2033
- Figure 34: Europe EV AC Charging Gun Volume Share (%), by Types 2025 & 2033
- Figure 35: Europe EV AC Charging Gun Revenue (billion), by Country 2025 & 2033
- Figure 36: Europe EV AC Charging Gun Volume (K), by Country 2025 & 2033
- Figure 37: Europe EV AC Charging Gun Revenue Share (%), by Country 2025 & 2033
- Figure 38: Europe EV AC Charging Gun Volume Share (%), by Country 2025 & 2033
- Figure 39: Middle East & Africa EV AC Charging Gun Revenue (billion), by Application 2025 & 2033
- Figure 40: Middle East & Africa EV AC Charging Gun Volume (K), by Application 2025 & 2033
- Figure 41: Middle East & Africa EV AC Charging Gun Revenue Share (%), by Application 2025 & 2033
- Figure 42: Middle East & Africa EV AC Charging Gun Volume Share (%), by Application 2025 & 2033
- Figure 43: Middle East & Africa EV AC Charging Gun Revenue (billion), by Types 2025 & 2033
- Figure 44: Middle East & Africa EV AC Charging Gun Volume (K), by Types 2025 & 2033
- Figure 45: Middle East & Africa EV AC Charging Gun Revenue Share (%), by Types 2025 & 2033
- Figure 46: Middle East & Africa EV AC Charging Gun Volume Share (%), by Types 2025 & 2033
- Figure 47: Middle East & Africa EV AC Charging Gun Revenue (billion), by Country 2025 & 2033
- Figure 48: Middle East & Africa EV AC Charging Gun Volume (K), by Country 2025 & 2033
- Figure 49: Middle East & Africa EV AC Charging Gun Revenue Share (%), by Country 2025 & 2033
- Figure 50: Middle East & Africa EV AC Charging Gun Volume Share (%), by Country 2025 & 2033
- Figure 51: Asia Pacific EV AC Charging Gun Revenue (billion), by Application 2025 & 2033
- Figure 52: Asia Pacific EV AC Charging Gun Volume (K), by Application 2025 & 2033
- Figure 53: Asia Pacific EV AC Charging Gun Revenue Share (%), by Application 2025 & 2033
- Figure 54: Asia Pacific EV AC Charging Gun Volume Share (%), by Application 2025 & 2033
- Figure 55: Asia Pacific EV AC Charging Gun Revenue (billion), by Types 2025 & 2033
- Figure 56: Asia Pacific EV AC Charging Gun Volume (K), by Types 2025 & 2033
- Figure 57: Asia Pacific EV AC Charging Gun Revenue Share (%), by Types 2025 & 2033
- Figure 58: Asia Pacific EV AC Charging Gun Volume Share (%), by Types 2025 & 2033
- Figure 59: Asia Pacific EV AC Charging Gun Revenue (billion), by Country 2025 & 2033
- Figure 60: Asia Pacific EV AC Charging Gun Volume (K), by Country 2025 & 2033
- Figure 61: Asia Pacific EV AC Charging Gun Revenue Share (%), by Country 2025 & 2033
- Figure 62: Asia Pacific EV AC Charging Gun Volume Share (%), by Country 2025 & 2033
List of Tables
- Table 1: Global EV AC Charging Gun Revenue billion Forecast, by Application 2020 & 2033
- Table 2: Global EV AC Charging Gun Volume K Forecast, by Application 2020 & 2033
- Table 3: Global EV AC Charging Gun Revenue billion Forecast, by Types 2020 & 2033
- Table 4: Global EV AC Charging Gun Volume K Forecast, by Types 2020 & 2033
- Table 5: Global EV AC Charging Gun Revenue billion Forecast, by Region 2020 & 2033
- Table 6: Global EV AC Charging Gun Volume K Forecast, by Region 2020 & 2033
- Table 7: Global EV AC Charging Gun Revenue billion Forecast, by Application 2020 & 2033
- Table 8: Global EV AC Charging Gun Volume K Forecast, by Application 2020 & 2033
- Table 9: Global EV AC Charging Gun Revenue billion Forecast, by Types 2020 & 2033
- Table 10: Global EV AC Charging Gun Volume K Forecast, by Types 2020 & 2033
- Table 11: Global EV AC Charging Gun Revenue billion Forecast, by Country 2020 & 2033
- Table 12: Global EV AC Charging Gun Volume K Forecast, by Country 2020 & 2033
- Table 13: United States EV AC Charging Gun Revenue (billion) Forecast, by Application 2020 & 2033
- Table 14: United States EV AC Charging Gun Volume (K) Forecast, by Application 2020 & 2033
- Table 15: Canada EV AC Charging Gun Revenue (billion) Forecast, by Application 2020 & 2033
- Table 16: Canada EV AC Charging Gun Volume (K) Forecast, by Application 2020 & 2033
- Table 17: Mexico EV AC Charging Gun Revenue (billion) Forecast, by Application 2020 & 2033
- Table 18: Mexico EV AC Charging Gun Volume (K) Forecast, by Application 2020 & 2033
- Table 19: Global EV AC Charging Gun Revenue billion Forecast, by Application 2020 & 2033
- Table 20: Global EV AC Charging Gun Volume K Forecast, by Application 2020 & 2033
- Table 21: Global EV AC Charging Gun Revenue billion Forecast, by Types 2020 & 2033
- Table 22: Global EV AC Charging Gun Volume K Forecast, by Types 2020 & 2033
- Table 23: Global EV AC Charging Gun Revenue billion Forecast, by Country 2020 & 2033
- Table 24: Global EV AC Charging Gun Volume K Forecast, by Country 2020 & 2033
- Table 25: Brazil EV AC Charging Gun Revenue (billion) Forecast, by Application 2020 & 2033
- Table 26: Brazil EV AC Charging Gun Volume (K) Forecast, by Application 2020 & 2033
- Table 27: Argentina EV AC Charging Gun Revenue (billion) Forecast, by Application 2020 & 2033
- Table 28: Argentina EV AC Charging Gun Volume (K) Forecast, by Application 2020 & 2033
- Table 29: Rest of South America EV AC Charging Gun Revenue (billion) Forecast, by Application 2020 & 2033
- Table 30: Rest of South America EV AC Charging Gun Volume (K) Forecast, by Application 2020 & 2033
- Table 31: Global EV AC Charging Gun Revenue billion Forecast, by Application 2020 & 2033
- Table 32: Global EV AC Charging Gun Volume K Forecast, by Application 2020 & 2033
- Table 33: Global EV AC Charging Gun Revenue billion Forecast, by Types 2020 & 2033
- Table 34: Global EV AC Charging Gun Volume K Forecast, by Types 2020 & 2033
- Table 35: Global EV AC Charging Gun Revenue billion Forecast, by Country 2020 & 2033
- Table 36: Global EV AC Charging Gun Volume K Forecast, by Country 2020 & 2033
- Table 37: United Kingdom EV AC Charging Gun Revenue (billion) Forecast, by Application 2020 & 2033
- Table 38: United Kingdom EV AC Charging Gun Volume (K) Forecast, by Application 2020 & 2033
- Table 39: Germany EV AC Charging Gun Revenue (billion) Forecast, by Application 2020 & 2033
- Table 40: Germany EV AC Charging Gun Volume (K) Forecast, by Application 2020 & 2033
- Table 41: France EV AC Charging Gun Revenue (billion) Forecast, by Application 2020 & 2033
- Table 42: France EV AC Charging Gun Volume (K) Forecast, by Application 2020 & 2033
- Table 43: Italy EV AC Charging Gun Revenue (billion) Forecast, by Application 2020 & 2033
- Table 44: Italy EV AC Charging Gun Volume (K) Forecast, by Application 2020 & 2033
- Table 45: Spain EV AC Charging Gun Revenue (billion) Forecast, by Application 2020 & 2033
- Table 46: Spain EV AC Charging Gun Volume (K) Forecast, by Application 2020 & 2033
- Table 47: Russia EV AC Charging Gun Revenue (billion) Forecast, by Application 2020 & 2033
- Table 48: Russia EV AC Charging Gun Volume (K) Forecast, by Application 2020 & 2033
- Table 49: Benelux EV AC Charging Gun Revenue (billion) Forecast, by Application 2020 & 2033
- Table 50: Benelux EV AC Charging Gun Volume (K) Forecast, by Application 2020 & 2033
- Table 51: Nordics EV AC Charging Gun Revenue (billion) Forecast, by Application 2020 & 2033
- Table 52: Nordics EV AC Charging Gun Volume (K) Forecast, by Application 2020 & 2033
- Table 53: Rest of Europe EV AC Charging Gun Revenue (billion) Forecast, by Application 2020 & 2033
- Table 54: Rest of Europe EV AC Charging Gun Volume (K) Forecast, by Application 2020 & 2033
- Table 55: Global EV AC Charging Gun Revenue billion Forecast, by Application 2020 & 2033
- Table 56: Global EV AC Charging Gun Volume K Forecast, by Application 2020 & 2033
- Table 57: Global EV AC Charging Gun Revenue billion Forecast, by Types 2020 & 2033
- Table 58: Global EV AC Charging Gun Volume K Forecast, by Types 2020 & 2033
- Table 59: Global EV AC Charging Gun Revenue billion Forecast, by Country 2020 & 2033
- Table 60: Global EV AC Charging Gun Volume K Forecast, by Country 2020 & 2033
- Table 61: Turkey EV AC Charging Gun Revenue (billion) Forecast, by Application 2020 & 2033
- Table 62: Turkey EV AC Charging Gun Volume (K) Forecast, by Application 2020 & 2033
- Table 63: Israel EV AC Charging Gun Revenue (billion) Forecast, by Application 2020 & 2033
- Table 64: Israel EV AC Charging Gun Volume (K) Forecast, by Application 2020 & 2033
- Table 65: GCC EV AC Charging Gun Revenue (billion) Forecast, by Application 2020 & 2033
- Table 66: GCC EV AC Charging Gun Volume (K) Forecast, by Application 2020 & 2033
- Table 67: North Africa EV AC Charging Gun Revenue (billion) Forecast, by Application 2020 & 2033
- Table 68: North Africa EV AC Charging Gun Volume (K) Forecast, by Application 2020 & 2033
- Table 69: South Africa EV AC Charging Gun Revenue (billion) Forecast, by Application 2020 & 2033
- Table 70: South Africa EV AC Charging Gun Volume (K) Forecast, by Application 2020 & 2033
- Table 71: Rest of Middle East & Africa EV AC Charging Gun Revenue (billion) Forecast, by Application 2020 & 2033
- Table 72: Rest of Middle East & Africa EV AC Charging Gun Volume (K) Forecast, by Application 2020 & 2033
- Table 73: Global EV AC Charging Gun Revenue billion Forecast, by Application 2020 & 2033
- Table 74: Global EV AC Charging Gun Volume K Forecast, by Application 2020 & 2033
- Table 75: Global EV AC Charging Gun Revenue billion Forecast, by Types 2020 & 2033
- Table 76: Global EV AC Charging Gun Volume K Forecast, by Types 2020 & 2033
- Table 77: Global EV AC Charging Gun Revenue billion Forecast, by Country 2020 & 2033
- Table 78: Global EV AC Charging Gun Volume K Forecast, by Country 2020 & 2033
- Table 79: China EV AC Charging Gun Revenue (billion) Forecast, by Application 2020 & 2033
- Table 80: China EV AC Charging Gun Volume (K) Forecast, by Application 2020 & 2033
- Table 81: India EV AC Charging Gun Revenue (billion) Forecast, by Application 2020 & 2033
- Table 82: India EV AC Charging Gun Volume (K) Forecast, by Application 2020 & 2033
- Table 83: Japan EV AC Charging Gun Revenue (billion) Forecast, by Application 2020 & 2033
- Table 84: Japan EV AC Charging Gun Volume (K) Forecast, by Application 2020 & 2033
- Table 85: South Korea EV AC Charging Gun Revenue (billion) Forecast, by Application 2020 & 2033
- Table 86: South Korea EV AC Charging Gun Volume (K) Forecast, by Application 2020 & 2033
- Table 87: ASEAN EV AC Charging Gun Revenue (billion) Forecast, by Application 2020 & 2033
- Table 88: ASEAN EV AC Charging Gun Volume (K) Forecast, by Application 2020 & 2033
- Table 89: Oceania EV AC Charging Gun Revenue (billion) Forecast, by Application 2020 & 2033
- Table 90: Oceania EV AC Charging Gun Volume (K) Forecast, by Application 2020 & 2033
- Table 91: Rest of Asia Pacific EV AC Charging Gun Revenue (billion) Forecast, by Application 2020 & 2033
- Table 92: Rest of Asia Pacific EV AC Charging Gun Volume (K) Forecast, by Application 2020 & 2033
Frequently Asked Questions
1. What is the projected Compound Annual Growth Rate (CAGR) of the EV AC Charging Gun?
The projected CAGR is approximately 13.95%.
2. Which companies are prominent players in the EV AC Charging Gun?
Key companies in the market include SINBON, Phoenix Contact, JAE, Volex, Delphi, Sumitomo Electric Industries, Aptiv, ITT Cannon, BULL, Youcheng New Energy, Shenglan Technology, Shenzhen Woer Heat, Weihai HonglinElectronic, Suzhou Recodeal, Saichuan Electronics, Zhejiang Wanma, AG Electrical, Guangzhou Zeesung, Suzhou Yeeda.
3. What are the main segments of the EV AC Charging Gun?
The market segments include Application, Types.
4. Can you provide details about the market size?
The market size is estimated to be USD 8.66 billion as of 2022.
5. What are some drivers contributing to market growth?
N/A
6. What are the notable trends driving market growth?
N/A
7. Are there any restraints impacting market growth?
N/A
8. Can you provide examples of recent developments in the market?
N/A
9. What pricing options are available for accessing the report?
Pricing options include single-user, multi-user, and enterprise licenses priced at USD 3350.00, USD 5025.00, and USD 6700.00 respectively.
10. Is the market size provided in terms of value or volume?
The market size is provided in terms of value, measured in billion and volume, measured in K.
11. Are there any specific market keywords associated with the report?
Yes, the market keyword associated with the report is "EV AC Charging Gun," which aids in identifying and referencing the specific market segment covered.
12. How do I determine which pricing option suits my needs best?
The pricing options vary based on user requirements and access needs. Individual users may opt for single-user licenses, while businesses requiring broader access may choose multi-user or enterprise licenses for cost-effective access to the report.
13. Are there any additional resources or data provided in the EV AC Charging Gun report?
While the report offers comprehensive insights, it's advisable to review the specific contents or supplementary materials provided to ascertain if additional resources or data are available.
14. How can I stay updated on further developments or reports in the EV AC Charging Gun?
To stay informed about further developments, trends, and reports in the EV AC Charging Gun, consider subscribing to industry newsletters, following relevant companies and organizations, or regularly checking reputable industry news sources and publications.
Methodology
Step 1 - Identification of Relevant Samples Size from Population Database


Step 2 - Approaches for Defining Global Market Size (Value, Volume* & Price*)

Note*: In applicable scenarios
Step 3 - Data Sources
Primary Research
- Web Analytics
- Survey Reports
- Research Institute
- Latest Research Reports
- Opinion Leaders
Secondary Research
- Annual Reports
- White Paper
- Latest Press Release
- Industry Association
- Paid Database
- Investor Presentations

Step 4 - Data Triangulation
Involves using different sources of information in order to increase the validity of a study
These sources are likely to be stakeholders in a program - participants, other researchers, program staff, other community members, and so on.
Then we put all data in single framework & apply various statistical tools to find out the dynamic on the market.
During the analysis stage, feedback from the stakeholder groups would be compared to determine areas of agreement as well as areas of divergence