

Key Insights
The global water transportation market, spanning deep sea, coastal, and Great Lakes segments, is characterized by dynamic growth and diverse influencing factors. The market is projected to reach $542.5 billion by 2025, with a Compound Annual Growth Rate (CAGR) of 6.3%. Deep sea transportation, the largest segment, is driven by expanding global trade and the demand for efficient long-haul cargo solutions. Investments in advanced vessel technology and port infrastructure enhance this sector, although it faces headwinds from volatile fuel costs, geopolitical instability, and stringent environmental regulations. Coastal transportation, focusing on shorter routes and increased frequency, anticipates robust expansion due to regional trade and the burgeoning e-commerce sector, necessitating faster delivery times and fostering competition among agile shipping firms. The Great Lakes segment, vital to North America's industrial core, is subject to seasonal variations and commodity market cycles. Its growth will be shaped by industrial output, infrastructure upgrades, and waterway access regulations. Key market challenges include the imperative for sustainable practices amid growing environmental scrutiny and the adoption of emerging technologies such as autonomous vessels and advanced supply chain management systems.
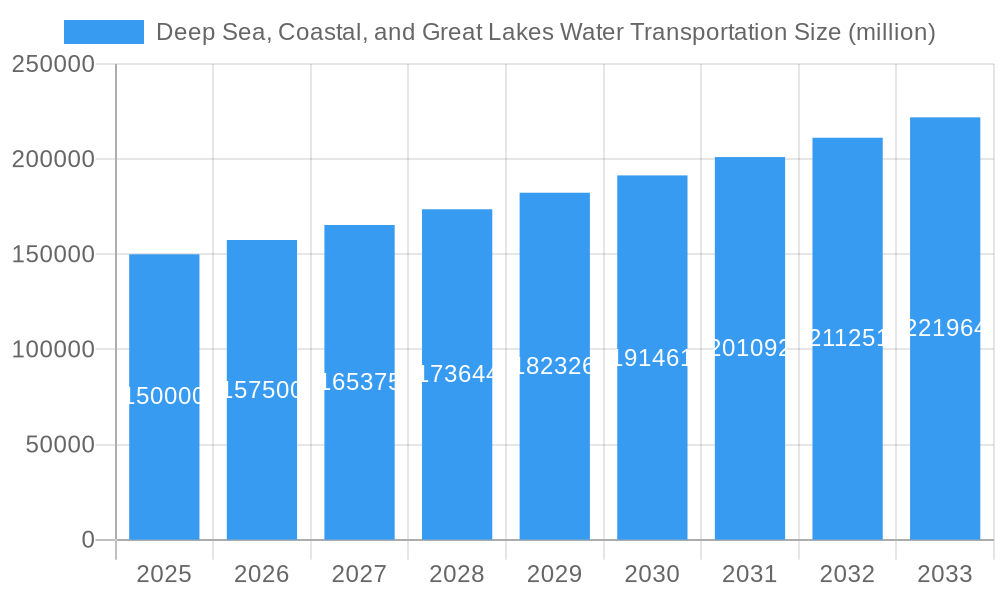
Deep Sea, Coastal, and Great Lakes Water Transportation Market Size (In Billion)
Geographically, the water transportation market mirrors global trade flows. North America and Europe are anticipated to maintain the largest market shares, supported by mature economies and extensive port networks. The Asia Pacific region, propelled by its rapid economic development and significant manufacturing base, is poised for substantial growth, particularly in coastal shipping. Emerging economies in South America, Africa, and the Middle East present future expansion opportunities, contingent on infrastructure development and regulatory advancements. Competitive intensity is high, with established players contending with new entrants leveraging innovative technologies and business models. Strategic adaptation to market shifts, effective navigation of geopolitical complexities, and commitment to sustainable operations are paramount for competitive success in this crucial logistics sector.
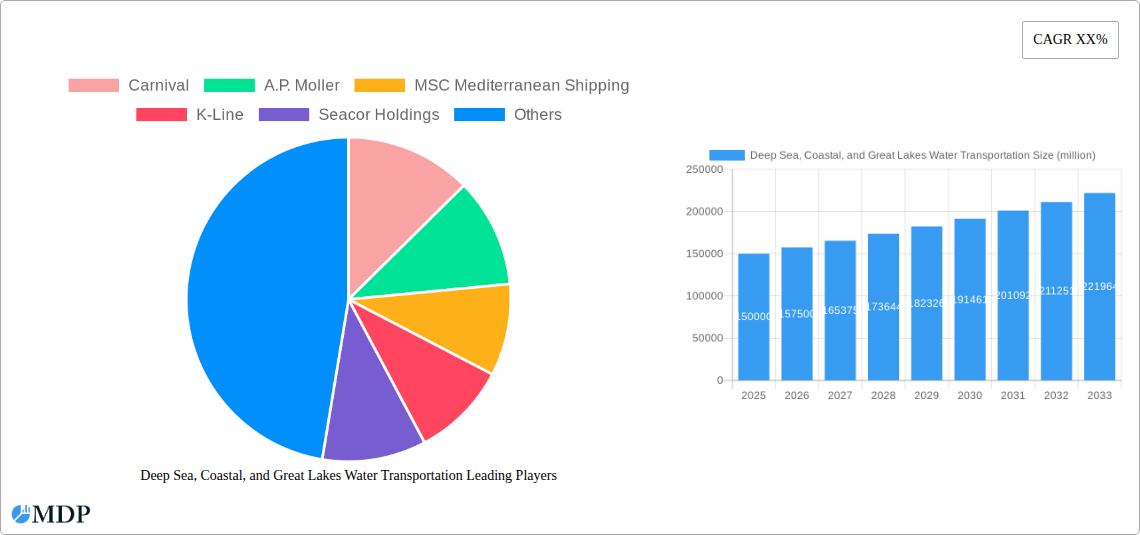
Deep Sea, Coastal, and Great Lakes Water Transportation Company Market Share
Deep Sea, Coastal, & Great Lakes Water Transportation Market Report: 2019-2033
This comprehensive report provides an in-depth analysis of the Deep Sea, Coastal, and Great Lakes Water Transportation market, offering crucial insights for stakeholders across the industry. Covering the period 2019-2033, with a focus on 2025, this report analyzes market dynamics, trends, leading players, and future opportunities. The report uses millions (M) for all values.
Keywords: Deep Sea Transportation, Coastal Transportation, Great Lakes Transportation, Water Transportation Market, Maritime Industry, Shipping Industry, Carnival, A.P. Moller-Maersk, MSC, K-Line, Seacor Holdings, Market Analysis, Market Forecast, Industry Trends, CAGR, Market Share, M&A Activity.
Deep Sea, Coastal, and Great Lakes Water Transportation Market Dynamics & Concentration
The global Deep Sea, Coastal, and Great Lakes Water Transportation market, valued at $XX million in 2024, is characterized by moderate concentration. Key players such as Carnival, A.P. Moller-Maersk, MSC Mediterranean Shipping, K-Line, and Seacor Holdings hold significant market share, though the precise distribution varies across segments. The market is dynamic, influenced by fluctuating fuel prices, stringent regulatory frameworks (e.g., IMO 2020), and the increasing adoption of technological innovations like autonomous vessels and digitalization of shipping operations. Product substitution is limited, largely restricted to alternative modes of transportation, which are often less cost-effective for bulk cargo. End-user trends favor efficient, reliable, and environmentally sustainable transportation solutions. M&A activity has been moderate in recent years, with approximately XX deals recorded between 2019 and 2024, primarily focused on consolidation within specific segments.
- Market Concentration: Moderately concentrated, with top 5 players holding approximately XX% of market share.
- Innovation Drivers: Automation, digitalization, alternative fuels, and sustainable practices.
- Regulatory Frameworks: IMO regulations, port regulations, and environmental compliance.
- Product Substitutes: Rail, road, and air freight (limited applicability).
- End-User Trends: Demand for efficient, reliable, and sustainable transportation.
- M&A Activity: Approximately XX deals between 2019 and 2024.
Deep Sea, Coastal, and Great Lakes Water Transportation Industry Trends & Analysis
The Deep Sea, Coastal, and Great Lakes Water Transportation market is projected to experience a CAGR of XX% during the forecast period (2025-2033), reaching $XX million by 2033. Market growth is driven by global trade expansion, particularly in emerging economies. Technological disruptions, including the development of autonomous vessels and advanced cargo management systems, are significantly impacting efficiency and cost-effectiveness. Consumer preferences are shifting towards greater transparency and traceability in supply chains, along with a growing emphasis on environmentally friendly shipping solutions. Competitive dynamics are intense, with established players continually investing in fleet modernization and operational optimization while facing pressure from smaller, more agile competitors. Market penetration of new technologies remains relatively low but is expected to increase substantially over the next decade.
Leading Markets & Segments in Deep Sea, Coastal, and Great Lakes Water Transportation
The Asia-Pacific region dominates the global market, driven by robust economic growth and expanding trade volumes. Within application segments, Transportation accounts for the largest share, followed by Others (e.g., offshore support) and Entertainment (cruises). Deep Sea transportation remains the largest type, though Coastal and Great Lakes transportation are experiencing notable growth, particularly in regions with substantial inland waterway infrastructure.
- Key Drivers:
- Asia-Pacific: Rapid economic growth, robust trade, and extensive port infrastructure.
- Transportation Segment: High volume of goods requiring water transport.
- Deep Sea Transportation: Dominance in global trade.
- Dominance Analysis: The dominance of Asia-Pacific stems from its role as a manufacturing and export hub, coupled with its investment in port and waterway development. The Transportation segment’s prominence reflects the fundamental role of water transport in global supply chains. Deep Sea transportation's leading position reflects its capacity to handle large-scale, long-distance cargo movement.
Deep Sea, Coastal, and Great Lakes Water Transportation Product Developments
Recent product innovations include the development of larger, more fuel-efficient vessels, advanced cargo handling systems, and the integration of digital technologies for improved fleet management and cargo tracking. These innovations enhance efficiency, reduce operational costs, and improve supply chain visibility. The growing adoption of alternative fuels and environmentally friendly technologies aims to mitigate the industry's environmental impact and meet increasing regulatory requirements. The market fit for these innovations is strong, driven by the need for greater efficiency, sustainability, and transparency within the shipping industry.
Key Drivers of Deep Sea, Coastal, and Great Lakes Water Transportation Growth
Growth is primarily fueled by expanding global trade, particularly between Asia and other regions. Technological advancements, such as autonomous vessels and digitalization, enhance efficiency and reduce costs. Government investments in port infrastructure and waterway development further stimulate growth. Stringent environmental regulations, although initially presenting challenges, also drive innovation in cleaner shipping technologies, fostering long-term sustainability.
Challenges in the Deep Sea, Coastal, and Great Lakes Water Transportation Market
Significant challenges include fluctuating fuel prices, which directly impact operational costs. Supply chain disruptions, exacerbated by geopolitical instability and natural disasters, can severely affect transportation efficiency. Intense competition, coupled with increasing regulatory burdens related to environmental compliance, necessitates continuous investment in upgrades and adaptation. This represents an estimated XX million in annual additional costs for the industry.
Emerging Opportunities in Deep Sea, Coastal, and Great Lakes Water Transportation
Emerging opportunities arise from the growing adoption of autonomous vessels, promising improved efficiency and safety. Strategic partnerships between shipping companies and technology providers are accelerating the development and deployment of innovative solutions. Market expansion into emerging economies, particularly in Africa and Southeast Asia, presents significant potential for growth. The shift towards cleaner fuels and sustainable practices offers long-term opportunities for environmentally conscious operators.
Leading Players in the Deep Sea, Coastal, and Great Lakes Water Transportation Sector
Key Milestones in Deep Sea, Coastal, and Great Lakes Water Transportation Industry
- 2020: Implementation of IMO 2020 sulfur cap.
- 2021: Increased focus on decarbonization strategies and alternative fuels.
- 2022: Several significant M&A deals within the container shipping sector.
- 2023: Accelerated adoption of digital technologies for fleet management.
- 2024: Initial deployments of autonomous vessel technologies in limited contexts.
Strategic Outlook for Deep Sea, Coastal, and Great Lakes Water Transportation Market
The Deep Sea, Coastal, and Great Lakes Water Transportation market exhibits strong growth potential, driven by ongoing globalization and the increasing adoption of innovative technologies. Strategic opportunities lie in investing in sustainable solutions, leveraging digital technologies for enhanced efficiency and transparency, and expanding operations into new and emerging markets. Companies that successfully adapt to evolving regulatory landscapes and consumer preferences will be best positioned to capture market share in the years to come.
Deep Sea, Coastal, and Great Lakes Water Transportation Segmentation
-
1. Application
- 1.1. Transportation
- 1.2. Entertainment
- 1.3. Others
-
2. Types
- 2.1. Deep Sea Transportation
- 2.2. Coastal Transportation
- 2.3. Great Lakes Water Transportation
Deep Sea, Coastal, and Great Lakes Water Transportation Segmentation By Geography
-
1. North America
- 1.1. United States
- 1.2. Canada
- 1.3. Mexico
-
2. South America
- 2.1. Brazil
- 2.2. Argentina
- 2.3. Rest of South America
-
3. Europe
- 3.1. United Kingdom
- 3.2. Germany
- 3.3. France
- 3.4. Italy
- 3.5. Spain
- 3.6. Russia
- 3.7. Benelux
- 3.8. Nordics
- 3.9. Rest of Europe
-
4. Middle East & Africa
- 4.1. Turkey
- 4.2. Israel
- 4.3. GCC
- 4.4. North Africa
- 4.5. South Africa
- 4.6. Rest of Middle East & Africa
-
5. Asia Pacific
- 5.1. China
- 5.2. India
- 5.3. Japan
- 5.4. South Korea
- 5.5. ASEAN
- 5.6. Oceania
- 5.7. Rest of Asia Pacific
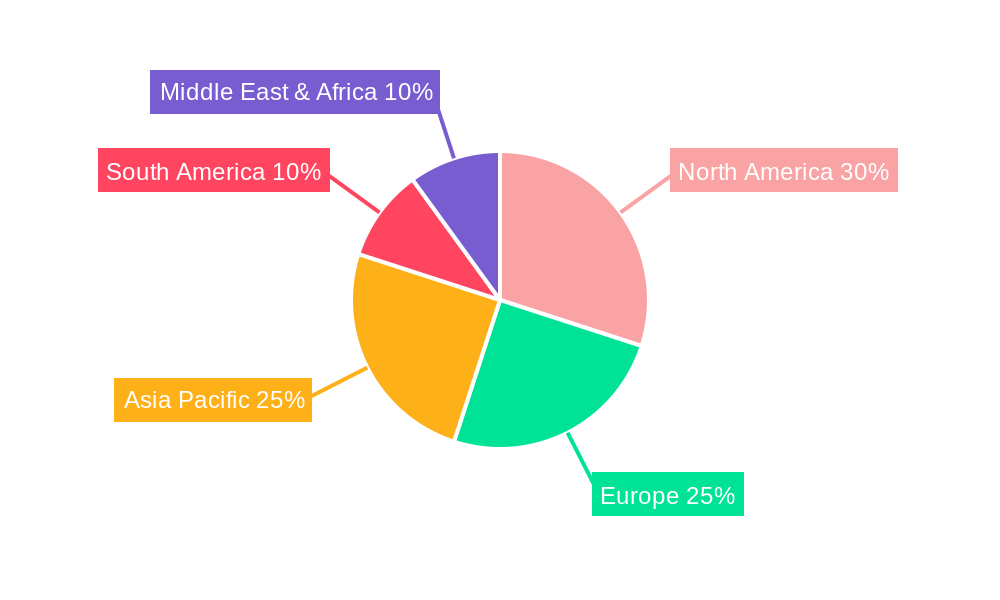
Deep Sea, Coastal, and Great Lakes Water Transportation Regional Market Share
Geographic Coverage of Deep Sea, Coastal, and Great Lakes Water Transportation
Deep Sea, Coastal, and Great Lakes Water Transportation REPORT HIGHLIGHTS
| Aspects | Details |
|---|---|
| Study Period | 2020-2034 |
| Base Year | 2025 |
| Estimated Year | 2026 |
| Forecast Period | 2026-2034 |
| Historical Period | 2020-2025 |
| Growth Rate | CAGR of 6.3% from 2020-2034 |
| Segmentation |
|
Table of Contents
- 1. Introduction
- 1.1. Research Scope
- 1.2. Market Segmentation
- 1.3. Research Methodology
- 1.4. Definitions and Assumptions
- 2. Executive Summary
- 2.1. Introduction
- 3. Market Dynamics
- 3.1. Introduction
- 3.2. Market Drivers
- 3.3. Market Restrains
- 3.4. Market Trends
- 4. Market Factor Analysis
- 4.1. Porters Five Forces
- 4.2. Supply/Value Chain
- 4.3. PESTEL analysis
- 4.4. Market Entropy
- 4.5. Patent/Trademark Analysis
- 5. Global Deep Sea, Coastal, and Great Lakes Water Transportation Analysis, Insights and Forecast, 2020-2032
- 5.1. Market Analysis, Insights and Forecast - by Application
- 5.1.1. Transportation
- 5.1.2. Entertainment
- 5.1.3. Others
- 5.2. Market Analysis, Insights and Forecast - by Types
- 5.2.1. Deep Sea Transportation
- 5.2.2. Coastal Transportation
- 5.2.3. Great Lakes Water Transportation
- 5.3. Market Analysis, Insights and Forecast - by Region
- 5.3.1. North America
- 5.3.2. South America
- 5.3.3. Europe
- 5.3.4. Middle East & Africa
- 5.3.5. Asia Pacific
- 5.1. Market Analysis, Insights and Forecast - by Application
- 6. North America Deep Sea, Coastal, and Great Lakes Water Transportation Analysis, Insights and Forecast, 2020-2032
- 6.1. Market Analysis, Insights and Forecast - by Application
- 6.1.1. Transportation
- 6.1.2. Entertainment
- 6.1.3. Others
- 6.2. Market Analysis, Insights and Forecast - by Types
- 6.2.1. Deep Sea Transportation
- 6.2.2. Coastal Transportation
- 6.2.3. Great Lakes Water Transportation
- 6.1. Market Analysis, Insights and Forecast - by Application
- 7. South America Deep Sea, Coastal, and Great Lakes Water Transportation Analysis, Insights and Forecast, 2020-2032
- 7.1. Market Analysis, Insights and Forecast - by Application
- 7.1.1. Transportation
- 7.1.2. Entertainment
- 7.1.3. Others
- 7.2. Market Analysis, Insights and Forecast - by Types
- 7.2.1. Deep Sea Transportation
- 7.2.2. Coastal Transportation
- 7.2.3. Great Lakes Water Transportation
- 7.1. Market Analysis, Insights and Forecast - by Application
- 8. Europe Deep Sea, Coastal, and Great Lakes Water Transportation Analysis, Insights and Forecast, 2020-2032
- 8.1. Market Analysis, Insights and Forecast - by Application
- 8.1.1. Transportation
- 8.1.2. Entertainment
- 8.1.3. Others
- 8.2. Market Analysis, Insights and Forecast - by Types
- 8.2.1. Deep Sea Transportation
- 8.2.2. Coastal Transportation
- 8.2.3. Great Lakes Water Transportation
- 8.1. Market Analysis, Insights and Forecast - by Application
- 9. Middle East & Africa Deep Sea, Coastal, and Great Lakes Water Transportation Analysis, Insights and Forecast, 2020-2032
- 9.1. Market Analysis, Insights and Forecast - by Application
- 9.1.1. Transportation
- 9.1.2. Entertainment
- 9.1.3. Others
- 9.2. Market Analysis, Insights and Forecast - by Types
- 9.2.1. Deep Sea Transportation
- 9.2.2. Coastal Transportation
- 9.2.3. Great Lakes Water Transportation
- 9.1. Market Analysis, Insights and Forecast - by Application
- 10. Asia Pacific Deep Sea, Coastal, and Great Lakes Water Transportation Analysis, Insights and Forecast, 2020-2032
- 10.1. Market Analysis, Insights and Forecast - by Application
- 10.1.1. Transportation
- 10.1.2. Entertainment
- 10.1.3. Others
- 10.2. Market Analysis, Insights and Forecast - by Types
- 10.2.1. Deep Sea Transportation
- 10.2.2. Coastal Transportation
- 10.2.3. Great Lakes Water Transportation
- 10.1. Market Analysis, Insights and Forecast - by Application
- 11. Competitive Analysis
- 11.1. Global Market Share Analysis 2025
- 11.2. Company Profiles
- 11.2.1 Carnival
- 11.2.1.1. Overview
- 11.2.1.2. Products
- 11.2.1.3. SWOT Analysis
- 11.2.1.4. Recent Developments
- 11.2.1.5. Financials (Based on Availability)
- 11.2.2 A.P. Moller
- 11.2.2.1. Overview
- 11.2.2.2. Products
- 11.2.2.3. SWOT Analysis
- 11.2.2.4. Recent Developments
- 11.2.2.5. Financials (Based on Availability)
- 11.2.3 MSC Mediterranean Shipping
- 11.2.3.1. Overview
- 11.2.3.2. Products
- 11.2.3.3. SWOT Analysis
- 11.2.3.4. Recent Developments
- 11.2.3.5. Financials (Based on Availability)
- 11.2.4 K-Line
- 11.2.4.1. Overview
- 11.2.4.2. Products
- 11.2.4.3. SWOT Analysis
- 11.2.4.4. Recent Developments
- 11.2.4.5. Financials (Based on Availability)
- 11.2.5 Seacor Holdings
- 11.2.5.1. Overview
- 11.2.5.2. Products
- 11.2.5.3. SWOT Analysis
- 11.2.5.4. Recent Developments
- 11.2.5.5. Financials (Based on Availability)
- 11.2.1 Carnival
List of Figures
- Figure 1: Global Deep Sea, Coastal, and Great Lakes Water Transportation Revenue Breakdown (billion, %) by Region 2025 & 2033
- Figure 2: North America Deep Sea, Coastal, and Great Lakes Water Transportation Revenue (billion), by Application 2025 & 2033
- Figure 3: North America Deep Sea, Coastal, and Great Lakes Water Transportation Revenue Share (%), by Application 2025 & 2033
- Figure 4: North America Deep Sea, Coastal, and Great Lakes Water Transportation Revenue (billion), by Types 2025 & 2033
- Figure 5: North America Deep Sea, Coastal, and Great Lakes Water Transportation Revenue Share (%), by Types 2025 & 2033
- Figure 6: North America Deep Sea, Coastal, and Great Lakes Water Transportation Revenue (billion), by Country 2025 & 2033
- Figure 7: North America Deep Sea, Coastal, and Great Lakes Water Transportation Revenue Share (%), by Country 2025 & 2033
- Figure 8: South America Deep Sea, Coastal, and Great Lakes Water Transportation Revenue (billion), by Application 2025 & 2033
- Figure 9: South America Deep Sea, Coastal, and Great Lakes Water Transportation Revenue Share (%), by Application 2025 & 2033
- Figure 10: South America Deep Sea, Coastal, and Great Lakes Water Transportation Revenue (billion), by Types 2025 & 2033
- Figure 11: South America Deep Sea, Coastal, and Great Lakes Water Transportation Revenue Share (%), by Types 2025 & 2033
- Figure 12: South America Deep Sea, Coastal, and Great Lakes Water Transportation Revenue (billion), by Country 2025 & 2033
- Figure 13: South America Deep Sea, Coastal, and Great Lakes Water Transportation Revenue Share (%), by Country 2025 & 2033
- Figure 14: Europe Deep Sea, Coastal, and Great Lakes Water Transportation Revenue (billion), by Application 2025 & 2033
- Figure 15: Europe Deep Sea, Coastal, and Great Lakes Water Transportation Revenue Share (%), by Application 2025 & 2033
- Figure 16: Europe Deep Sea, Coastal, and Great Lakes Water Transportation Revenue (billion), by Types 2025 & 2033
- Figure 17: Europe Deep Sea, Coastal, and Great Lakes Water Transportation Revenue Share (%), by Types 2025 & 2033
- Figure 18: Europe Deep Sea, Coastal, and Great Lakes Water Transportation Revenue (billion), by Country 2025 & 2033
- Figure 19: Europe Deep Sea, Coastal, and Great Lakes Water Transportation Revenue Share (%), by Country 2025 & 2033
- Figure 20: Middle East & Africa Deep Sea, Coastal, and Great Lakes Water Transportation Revenue (billion), by Application 2025 & 2033
- Figure 21: Middle East & Africa Deep Sea, Coastal, and Great Lakes Water Transportation Revenue Share (%), by Application 2025 & 2033
- Figure 22: Middle East & Africa Deep Sea, Coastal, and Great Lakes Water Transportation Revenue (billion), by Types 2025 & 2033
- Figure 23: Middle East & Africa Deep Sea, Coastal, and Great Lakes Water Transportation Revenue Share (%), by Types 2025 & 2033
- Figure 24: Middle East & Africa Deep Sea, Coastal, and Great Lakes Water Transportation Revenue (billion), by Country 2025 & 2033
- Figure 25: Middle East & Africa Deep Sea, Coastal, and Great Lakes Water Transportation Revenue Share (%), by Country 2025 & 2033
- Figure 26: Asia Pacific Deep Sea, Coastal, and Great Lakes Water Transportation Revenue (billion), by Application 2025 & 2033
- Figure 27: Asia Pacific Deep Sea, Coastal, and Great Lakes Water Transportation Revenue Share (%), by Application 2025 & 2033
- Figure 28: Asia Pacific Deep Sea, Coastal, and Great Lakes Water Transportation Revenue (billion), by Types 2025 & 2033
- Figure 29: Asia Pacific Deep Sea, Coastal, and Great Lakes Water Transportation Revenue Share (%), by Types 2025 & 2033
- Figure 30: Asia Pacific Deep Sea, Coastal, and Great Lakes Water Transportation Revenue (billion), by Country 2025 & 2033
- Figure 31: Asia Pacific Deep Sea, Coastal, and Great Lakes Water Transportation Revenue Share (%), by Country 2025 & 2033
List of Tables
- Table 1: Global Deep Sea, Coastal, and Great Lakes Water Transportation Revenue billion Forecast, by Application 2020 & 2033
- Table 2: Global Deep Sea, Coastal, and Great Lakes Water Transportation Revenue billion Forecast, by Types 2020 & 2033
- Table 3: Global Deep Sea, Coastal, and Great Lakes Water Transportation Revenue billion Forecast, by Region 2020 & 2033
- Table 4: Global Deep Sea, Coastal, and Great Lakes Water Transportation Revenue billion Forecast, by Application 2020 & 2033
- Table 5: Global Deep Sea, Coastal, and Great Lakes Water Transportation Revenue billion Forecast, by Types 2020 & 2033
- Table 6: Global Deep Sea, Coastal, and Great Lakes Water Transportation Revenue billion Forecast, by Country 2020 & 2033
- Table 7: United States Deep Sea, Coastal, and Great Lakes Water Transportation Revenue (billion) Forecast, by Application 2020 & 2033
- Table 8: Canada Deep Sea, Coastal, and Great Lakes Water Transportation Revenue (billion) Forecast, by Application 2020 & 2033
- Table 9: Mexico Deep Sea, Coastal, and Great Lakes Water Transportation Revenue (billion) Forecast, by Application 2020 & 2033
- Table 10: Global Deep Sea, Coastal, and Great Lakes Water Transportation Revenue billion Forecast, by Application 2020 & 2033
- Table 11: Global Deep Sea, Coastal, and Great Lakes Water Transportation Revenue billion Forecast, by Types 2020 & 2033
- Table 12: Global Deep Sea, Coastal, and Great Lakes Water Transportation Revenue billion Forecast, by Country 2020 & 2033
- Table 13: Brazil Deep Sea, Coastal, and Great Lakes Water Transportation Revenue (billion) Forecast, by Application 2020 & 2033
- Table 14: Argentina Deep Sea, Coastal, and Great Lakes Water Transportation Revenue (billion) Forecast, by Application 2020 & 2033
- Table 15: Rest of South America Deep Sea, Coastal, and Great Lakes Water Transportation Revenue (billion) Forecast, by Application 2020 & 2033
- Table 16: Global Deep Sea, Coastal, and Great Lakes Water Transportation Revenue billion Forecast, by Application 2020 & 2033
- Table 17: Global Deep Sea, Coastal, and Great Lakes Water Transportation Revenue billion Forecast, by Types 2020 & 2033
- Table 18: Global Deep Sea, Coastal, and Great Lakes Water Transportation Revenue billion Forecast, by Country 2020 & 2033
- Table 19: United Kingdom Deep Sea, Coastal, and Great Lakes Water Transportation Revenue (billion) Forecast, by Application 2020 & 2033
- Table 20: Germany Deep Sea, Coastal, and Great Lakes Water Transportation Revenue (billion) Forecast, by Application 2020 & 2033
- Table 21: France Deep Sea, Coastal, and Great Lakes Water Transportation Revenue (billion) Forecast, by Application 2020 & 2033
- Table 22: Italy Deep Sea, Coastal, and Great Lakes Water Transportation Revenue (billion) Forecast, by Application 2020 & 2033
- Table 23: Spain Deep Sea, Coastal, and Great Lakes Water Transportation Revenue (billion) Forecast, by Application 2020 & 2033
- Table 24: Russia Deep Sea, Coastal, and Great Lakes Water Transportation Revenue (billion) Forecast, by Application 2020 & 2033
- Table 25: Benelux Deep Sea, Coastal, and Great Lakes Water Transportation Revenue (billion) Forecast, by Application 2020 & 2033
- Table 26: Nordics Deep Sea, Coastal, and Great Lakes Water Transportation Revenue (billion) Forecast, by Application 2020 & 2033
- Table 27: Rest of Europe Deep Sea, Coastal, and Great Lakes Water Transportation Revenue (billion) Forecast, by Application 2020 & 2033
- Table 28: Global Deep Sea, Coastal, and Great Lakes Water Transportation Revenue billion Forecast, by Application 2020 & 2033
- Table 29: Global Deep Sea, Coastal, and Great Lakes Water Transportation Revenue billion Forecast, by Types 2020 & 2033
- Table 30: Global Deep Sea, Coastal, and Great Lakes Water Transportation Revenue billion Forecast, by Country 2020 & 2033
- Table 31: Turkey Deep Sea, Coastal, and Great Lakes Water Transportation Revenue (billion) Forecast, by Application 2020 & 2033
- Table 32: Israel Deep Sea, Coastal, and Great Lakes Water Transportation Revenue (billion) Forecast, by Application 2020 & 2033
- Table 33: GCC Deep Sea, Coastal, and Great Lakes Water Transportation Revenue (billion) Forecast, by Application 2020 & 2033
- Table 34: North Africa Deep Sea, Coastal, and Great Lakes Water Transportation Revenue (billion) Forecast, by Application 2020 & 2033
- Table 35: South Africa Deep Sea, Coastal, and Great Lakes Water Transportation Revenue (billion) Forecast, by Application 2020 & 2033
- Table 36: Rest of Middle East & Africa Deep Sea, Coastal, and Great Lakes Water Transportation Revenue (billion) Forecast, by Application 2020 & 2033
- Table 37: Global Deep Sea, Coastal, and Great Lakes Water Transportation Revenue billion Forecast, by Application 2020 & 2033
- Table 38: Global Deep Sea, Coastal, and Great Lakes Water Transportation Revenue billion Forecast, by Types 2020 & 2033
- Table 39: Global Deep Sea, Coastal, and Great Lakes Water Transportation Revenue billion Forecast, by Country 2020 & 2033
- Table 40: China Deep Sea, Coastal, and Great Lakes Water Transportation Revenue (billion) Forecast, by Application 2020 & 2033
- Table 41: India Deep Sea, Coastal, and Great Lakes Water Transportation Revenue (billion) Forecast, by Application 2020 & 2033
- Table 42: Japan Deep Sea, Coastal, and Great Lakes Water Transportation Revenue (billion) Forecast, by Application 2020 & 2033
- Table 43: South Korea Deep Sea, Coastal, and Great Lakes Water Transportation Revenue (billion) Forecast, by Application 2020 & 2033
- Table 44: ASEAN Deep Sea, Coastal, and Great Lakes Water Transportation Revenue (billion) Forecast, by Application 2020 & 2033
- Table 45: Oceania Deep Sea, Coastal, and Great Lakes Water Transportation Revenue (billion) Forecast, by Application 2020 & 2033
- Table 46: Rest of Asia Pacific Deep Sea, Coastal, and Great Lakes Water Transportation Revenue (billion) Forecast, by Application 2020 & 2033
Frequently Asked Questions
1. What is the projected Compound Annual Growth Rate (CAGR) of the Deep Sea, Coastal, and Great Lakes Water Transportation?
The projected CAGR is approximately 6.3%.
2. Which companies are prominent players in the Deep Sea, Coastal, and Great Lakes Water Transportation?
Key companies in the market include Carnival, A.P. Moller, MSC Mediterranean Shipping, K-Line, Seacor Holdings.
3. What are the main segments of the Deep Sea, Coastal, and Great Lakes Water Transportation?
The market segments include Application, Types.
4. Can you provide details about the market size?
The market size is estimated to be USD 542.5 billion as of 2022.
5. What are some drivers contributing to market growth?
N/A
6. What are the notable trends driving market growth?
N/A
7. Are there any restraints impacting market growth?
N/A
8. Can you provide examples of recent developments in the market?
N/A
9. What pricing options are available for accessing the report?
Pricing options include single-user, multi-user, and enterprise licenses priced at USD 5600.00, USD 8400.00, and USD 11200.00 respectively.
10. Is the market size provided in terms of value or volume?
The market size is provided in terms of value, measured in billion.
11. Are there any specific market keywords associated with the report?
Yes, the market keyword associated with the report is "Deep Sea, Coastal, and Great Lakes Water Transportation," which aids in identifying and referencing the specific market segment covered.
12. How do I determine which pricing option suits my needs best?
The pricing options vary based on user requirements and access needs. Individual users may opt for single-user licenses, while businesses requiring broader access may choose multi-user or enterprise licenses for cost-effective access to the report.
13. Are there any additional resources or data provided in the Deep Sea, Coastal, and Great Lakes Water Transportation report?
While the report offers comprehensive insights, it's advisable to review the specific contents or supplementary materials provided to ascertain if additional resources or data are available.
14. How can I stay updated on further developments or reports in the Deep Sea, Coastal, and Great Lakes Water Transportation?
To stay informed about further developments, trends, and reports in the Deep Sea, Coastal, and Great Lakes Water Transportation, consider subscribing to industry newsletters, following relevant companies and organizations, or regularly checking reputable industry news sources and publications.
Methodology
Step 1 - Identification of Relevant Samples Size from Population Database


Step 2 - Approaches for Defining Global Market Size (Value, Volume* & Price*)

Note*: In applicable scenarios
Step 3 - Data Sources
Primary Research
- Web Analytics
- Survey Reports
- Research Institute
- Latest Research Reports
- Opinion Leaders
Secondary Research
- Annual Reports
- White Paper
- Latest Press Release
- Industry Association
- Paid Database
- Investor Presentations

Step 4 - Data Triangulation
Involves using different sources of information in order to increase the validity of a study
These sources are likely to be stakeholders in a program - participants, other researchers, program staff, other community members, and so on.
Then we put all data in single framework & apply various statistical tools to find out the dynamic on the market.
During the analysis stage, feedback from the stakeholder groups would be compared to determine areas of agreement as well as areas of divergence