

Key Insights
The global Automated Vehicle Bottom Scanner market is poised for substantial expansion, projected to reach an estimated value of over $1.5 billion by 2033, driven by a robust Compound Annual Growth Rate (CAGR) of approximately 9%. This significant growth is fueled by the escalating demand for enhanced security and efficient inspection processes across critical infrastructure, including government agencies, transportation hubs like airports and stations, and high-security checkpoints. The increasing adoption of advanced imaging and artificial intelligence technologies is enabling quicker, more accurate, and less intrusive vehicle screening, directly addressing the need for improved safety and operational efficiency in these sensitive environments. Furthermore, the growing concern over illicit activities and smuggling operations necessitates advanced surveillance solutions, making automated vehicle bottom scanners an indispensable tool.
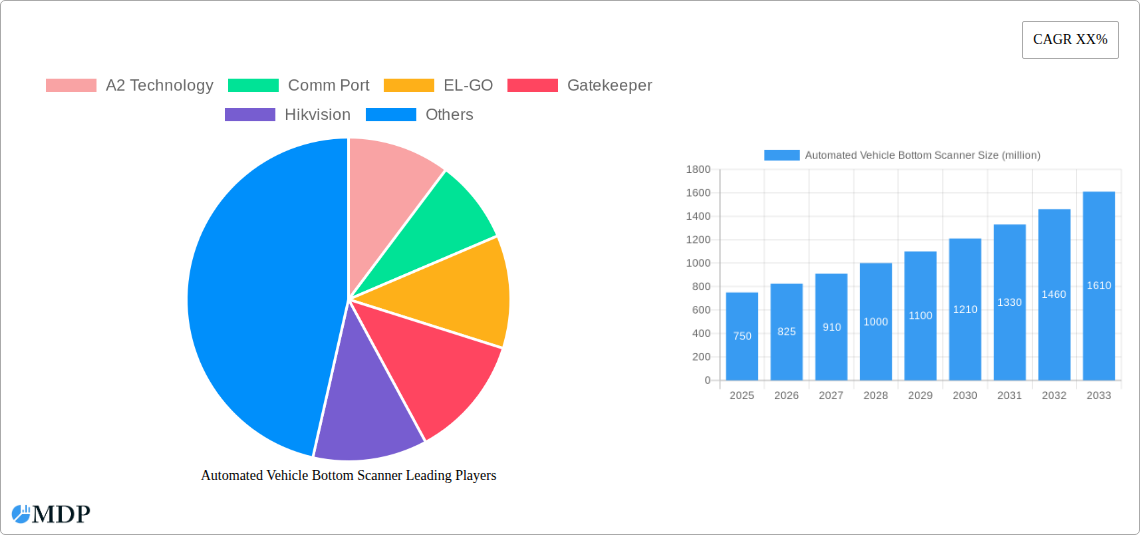
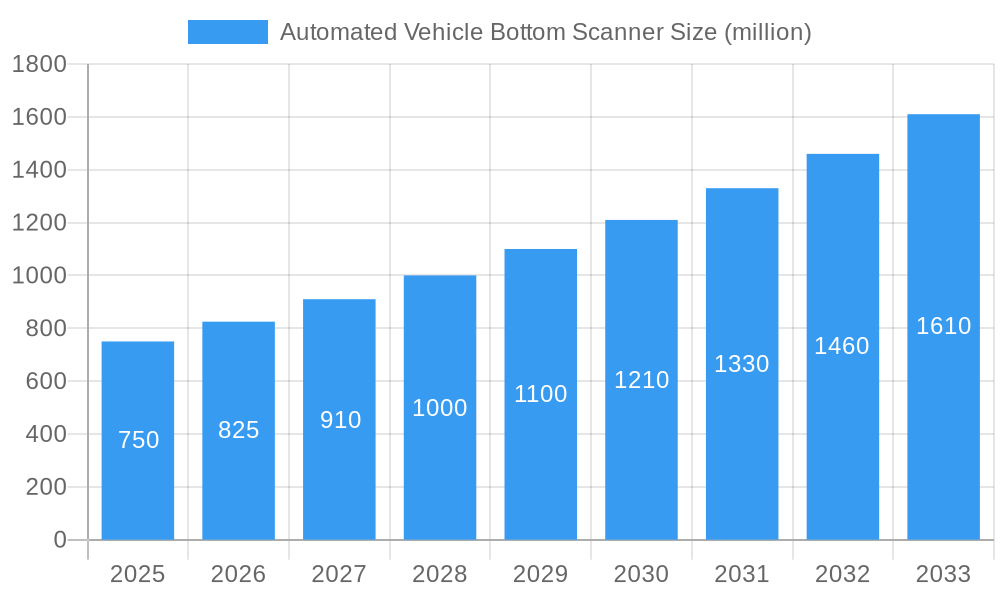
Automated Vehicle Bottom Scanner Market Size (In Million)
The market's dynamism is further shaped by key trends such as the integration of machine learning for threat detection, the development of portable and mobile scanning solutions for flexible deployment, and the continuous improvement in image resolution and processing speed. While the substantial initial investment and the need for skilled personnel to operate and maintain these sophisticated systems present some restraints, the long-term benefits in terms of operational savings, enhanced security, and compliance with stringent regulations are expected to outweigh these challenges. Leading players like Hikvision, ZKTeco Co., and Gatekeeper are actively innovating, introducing more intelligent and user-friendly systems, thereby accelerating market penetration. The forecast period is expected to witness a significant surge in demand from the Asia Pacific region, driven by rapid infrastructure development and increased security investments.
Automated Vehicle Bottom Scanner Company Market Share
Automated Vehicle Bottom Scanner Market: Comprehensive Industry Analysis and Future Outlook (2019-2033)
This in-depth report provides a thorough analysis of the global Automated Vehicle Bottom Scanner market, offering critical insights for industry stakeholders. Covering a study period from 2019 to 2033, with a base and estimated year of 2025, this report details market dynamics, key trends, leading segments, product developments, growth drivers, challenges, emerging opportunities, and a strategic outlook. The forecast period extends from 2025 to 2033, building upon historical data from 2019-2024.
Automated Vehicle Bottom Scanner Market Dynamics & Concentration
The global Automated Vehicle Bottom Scanner market exhibits a moderate to high concentration, driven by significant technological advancements and increasing security demands across various sectors. Key innovation drivers include the development of higher resolution imaging technologies, AI-powered anomaly detection algorithms, and enhanced data processing capabilities, leading to improved threat identification. Regulatory frameworks, particularly those mandating stringent vehicle inspections at ports, borders, and critical infrastructure, play a pivotal role in shaping market adoption. The proliferation of fixed scanning systems at checkpoints and the growing demand for mobile solutions at event venues and temporary security zones highlight evolving end-user trends. Product substitutes, such as manual inspections and portable X-ray devices, exist but are increasingly being outperformed by the efficiency and accuracy of automated bottom scanners. Mergers and acquisitions (M&A) activities are moderately present as larger security firms integrate specialized scanning technologies to broaden their portfolios. The market share distribution among the leading players indicates a competitive landscape where innovation and strategic partnerships are crucial for sustained growth. M&A deal counts are projected to remain steady, with an estimated 20-30 deals annually over the forecast period, focusing on acquiring niche technologies or expanding geographical reach.
Automated Vehicle Bottom Scanner Industry Trends & Analysis
The Automated Vehicle Bottom Scanner industry is poised for substantial growth, fueled by escalating global security concerns and the continuous evolution of transportation infrastructure. The market is experiencing a significant Compound Annual Growth Rate (CAGR) of approximately 12% over the forecast period, driven by the imperative for enhanced border control, cargo screening, and public safety. Technological disruptions are at the forefront of this expansion, with advancements in artificial intelligence (AI) for real-time threat detection, machine learning for pattern recognition of concealed contraband, and the integration of multiple sensor technologies (e.g., X-ray, gamma-ray, thermal imaging) to provide comprehensive scanning capabilities. Consumer preferences are increasingly shifting towards automated, non-intrusive, and highly efficient inspection solutions that minimize vehicle downtime and maximize throughput. This demand is particularly pronounced in high-traffic environments such as international airports, major railway stations, and critical government facilities.
The competitive dynamics are characterized by a blend of established security solution providers and agile technology innovators. Companies are investing heavily in research and development to offer scanners with higher inspection speeds, lower false alarm rates, and enhanced user-friendliness. The market penetration of automated vehicle bottom scanners is still relatively low in certain developing regions, presenting a significant opportunity for market expansion. As global trade volumes continue to rise and the threat landscape becomes more sophisticated, the adoption of these advanced scanning systems is expected to accelerate. The push for smart city initiatives and integrated security ecosystems further bolsters the demand for automated vehicle bottom scanners that can seamlessly communicate with other security and traffic management systems. The industry is also witnessing a trend towards modular and scalable solutions, allowing for customization based on specific application requirements and budget constraints. The total market size is projected to reach over $5,000 million by 2033, from an estimated $2,500 million in 2025.
Leading Markets & Segments in Automated Vehicle Bottom Scanner
The Government Agencies, Stations, Airports, etc. segment is the dominant force within the Automated Vehicle Bottom Scanner market, driven by stringent security mandates and the critical need for threat detection in these high-consequence environments. This segment, projected to account for over 50% of the market revenue by 2033, encompasses international airports, major seaports, railway hubs, and government buildings that experience substantial vehicular traffic. The primary drivers for its dominance include enhanced border security protocols, the prevention of smuggling of illegal goods and weapons, and the safeguarding of critical national infrastructure. Economic policies favoring robust national security and significant government investments in infrastructure upgrades further bolster this segment.
The Checkpoint segment, closely following, is also a major revenue contributor, particularly for highway checkpoints and border crossings. The increasing volume of commercial and private vehicle traffic necessitates rapid and efficient inspection solutions, making automated bottom scanners indispensable. Key drivers here include national security imperatives, customs and excise enforcement, and traffic management efficiency. The Highway segment, while broader, also presents substantial growth opportunities as toll roads and expressways increasingly adopt scanning technologies for security and toll collection integration.
In terms of Types, the Fixed scanners represent the largest market share due to their permanent installation at strategic locations like ports and permanent checkpoints, offering continuous surveillance and high throughput. However, the Mobile scanner segment is experiencing a faster growth rate. This surge is attributed to their flexibility in deployment for temporary security needs, event security, and rapid response scenarios, such as at large public gatherings or during special security operations. The ability to move these scanners to different locations without significant reinstallation makes them highly versatile. The Others application category, including industrial facilities and private security zones, is expected to exhibit steady growth as awareness of integrated security solutions increases across diverse sectors.
Automated Vehicle Bottom Scanner Product Developments
Recent product developments in the Automated Vehicle Bottom Scanner market focus on enhancing imaging resolution, AI-driven threat detection, and integration capabilities. Innovations include the development of ultra-high-resolution X-ray scanners capable of identifying even minute contraband and the incorporation of advanced AI algorithms that can detect anomalies with unprecedented accuracy, significantly reducing false positives. Furthermore, manufacturers are increasingly offering modular systems that can be customized with different sensor types – such as gamma-ray or thermal imaging – to suit specific application needs. Competitive advantages are being gained through faster scanning speeds, reduced operational footprints, and the seamless integration of these scanners with existing security infrastructure and data management platforms. This focus on technological advancement ensures that automated vehicle bottom scanners remain at the forefront of security screening solutions.
Key Drivers of Automated Vehicle Bottom Scanner Growth
The Automated Vehicle Bottom Scanner market is propelled by a confluence of critical factors. Technological Advancements such as AI-powered anomaly detection, higher resolution imaging, and improved data analytics are enhancing accuracy and efficiency. Increasing Global Security Concerns, including terrorism and cross-border smuggling, are driving the adoption of advanced screening solutions by governments and security agencies worldwide. Stringent Regulatory Frameworks mandating vehicle inspections at critical points like borders and ports provide a significant impetus. Furthermore, Growing Infrastructure Development, especially in emerging economies, is creating new deployment opportunities. The Need for Operational Efficiency in high-traffic areas, minimizing inspection times and maximizing throughput, also fuels demand for automated systems.
Challenges in the Automated Vehicle Bottom Scanner Market
Despite robust growth, the Automated Vehicle Bottom Scanner market faces several significant challenges. High Initial Investment Costs for advanced systems can be a barrier for smaller organizations and in budget-constrained regions, potentially limiting market penetration. Complex Regulatory Compliance and the need for frequent updates to meet evolving security standards can also pose hurdles. Supply Chain Disruptions, particularly for specialized electronic components, can impact production timelines and product availability. Intense Competitive Pressures among manufacturers often lead to price wars, affecting profit margins. Furthermore, Public Perception and Privacy Concerns surrounding comprehensive scanning technologies require careful management and transparent communication. The estimated impact of these challenges could slow market growth by approximately 5-10% annually in specific regions.
Emerging Opportunities in Automated Vehicle Bottom Scanner
Emerging opportunities in the Automated Vehicle Bottom Scanner market are abundant, driven by innovation and evolving security needs. Technological Breakthroughs in areas like quantum sensing and advanced artificial intelligence for predictive threat assessment offer exciting new avenues for enhanced detection capabilities. Strategic Partnerships between scanner manufacturers and software developers are creating integrated security solutions that offer seamless data analysis and reporting. The Expansion into Developing Markets with increasing focus on border security and infrastructure development presents a substantial growth catalyst. Furthermore, the Integration with Smart City Initiatives and the Internet of Things (IoT) will enable networked security systems, where automated vehicle bottom scanners play a crucial role in comprehensive urban safety. The development of Environmentally Friendly and Energy-Efficient Scanning Technologies also represents a growing niche.
Leading Players in the Automated Vehicle Bottom Scanner Sector
- A2 Technology
- Comm Port
- EL-GO
- Gatekeeper
- Hikvision
- Matrix Security
- SafeAgle
- SECOM
- SecuScan
- Ulgen
- UVIScan
- Vehant
- Westminster
- ZKTeco Co
- ZOAN GAOKE
- Advanced Detection Technology
- Nestor Technologies
Key Milestones in Automated Vehicle Bottom Scanner Industry
- 2019: Introduction of AI-powered anomaly detection algorithms in select scanner models, enhancing threat identification accuracy.
- 2020: Increased adoption of mobile automated vehicle bottom scanners for event security and rapid deployment scenarios.
- 2021: Significant investment in R&D for higher resolution X-ray and gamma-ray imaging technologies by leading manufacturers.
- 2022: Development of integrated data analytics platforms for automated vehicle bottom scanners, improving reporting and threat intelligence.
- 2023: Launch of modular scanning solutions allowing for customization with multiple sensor technologies.
- 2024: Growing interest in eco-friendly and energy-efficient scanner designs from manufacturers.
- 2025 (Estimated): Continued advancements in AI and machine learning for real-time threat prediction and reduced false alarm rates.
Strategic Outlook for Automated Vehicle Bottom Scanner Market
The strategic outlook for the Automated Vehicle Bottom Scanner market is overwhelmingly positive, characterized by continuous innovation and expanding applications. Growth accelerators will be driven by the ongoing integration of cutting-edge AI and machine learning for predictive threat analysis and the development of multi-modal scanning systems that combine various detection technologies for comprehensive security. Strategic opportunities lie in the expanding adoption within developing economies, the increasing demand for customized and scalable solutions, and the seamless integration of scanners into broader smart city and national security frameworks. Manufacturers focusing on robust cybersecurity features for connected scanning systems and those investing in sustainable and energy-efficient technologies are well-positioned for long-term success. The market is expected to witness increased collaboration and strategic alliances to deliver end-to-end security solutions.
Automated Vehicle Bottom Scanner Segmentation
-
1. Application
- 1.1. Government Agencies
- 1.2. Stations, Airports, etc
- 1.3. Highway
- 1.4. Checkpoint
- 1.5. Others
-
2. Types
- 2.1. Fixed
- 2.2. Mobile
Automated Vehicle Bottom Scanner Segmentation By Geography
-
1. North America
- 1.1. United States
- 1.2. Canada
- 1.3. Mexico
-
2. South America
- 2.1. Brazil
- 2.2. Argentina
- 2.3. Rest of South America
-
3. Europe
- 3.1. United Kingdom
- 3.2. Germany
- 3.3. France
- 3.4. Italy
- 3.5. Spain
- 3.6. Russia
- 3.7. Benelux
- 3.8. Nordics
- 3.9. Rest of Europe
-
4. Middle East & Africa
- 4.1. Turkey
- 4.2. Israel
- 4.3. GCC
- 4.4. North Africa
- 4.5. South Africa
- 4.6. Rest of Middle East & Africa
-
5. Asia Pacific
- 5.1. China
- 5.2. India
- 5.3. Japan
- 5.4. South Korea
- 5.5. ASEAN
- 5.6. Oceania
- 5.7. Rest of Asia Pacific
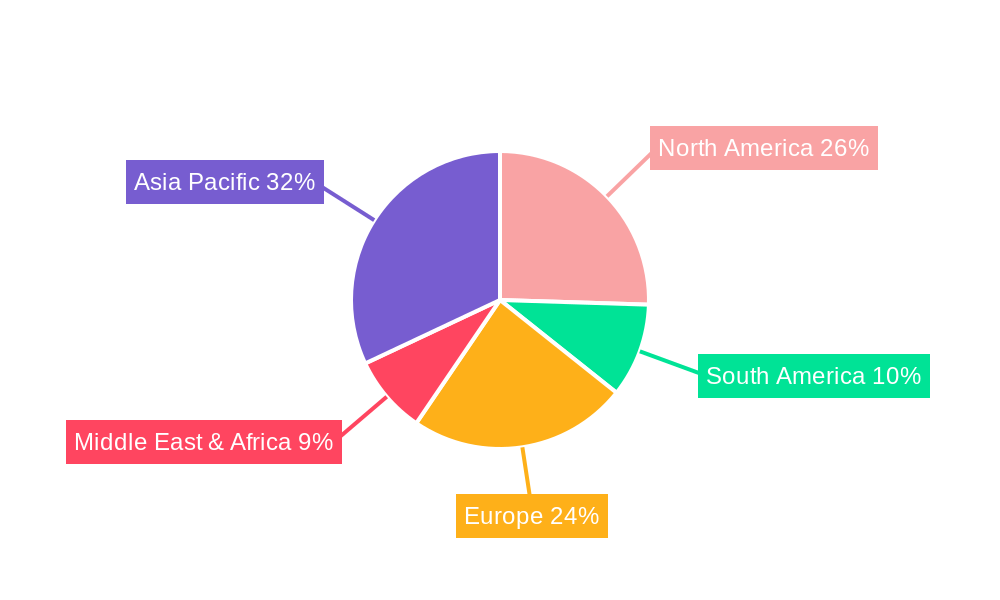
Automated Vehicle Bottom Scanner Regional Market Share
Geographic Coverage of Automated Vehicle Bottom Scanner
Automated Vehicle Bottom Scanner REPORT HIGHLIGHTS
| Aspects | Details |
|---|---|
| Study Period | 2020-2034 |
| Base Year | 2025 |
| Estimated Year | 2026 |
| Forecast Period | 2026-2034 |
| Historical Period | 2020-2025 |
| Growth Rate | CAGR of 14.07% from 2020-2034 |
| Segmentation |
|
Table of Contents
- 1. Introduction
- 1.1. Research Scope
- 1.2. Market Segmentation
- 1.3. Research Methodology
- 1.4. Definitions and Assumptions
- 2. Executive Summary
- 2.1. Introduction
- 3. Market Dynamics
- 3.1. Introduction
- 3.2. Market Drivers
- 3.3. Market Restrains
- 3.4. Market Trends
- 4. Market Factor Analysis
- 4.1. Porters Five Forces
- 4.2. Supply/Value Chain
- 4.3. PESTEL analysis
- 4.4. Market Entropy
- 4.5. Patent/Trademark Analysis
- 5. Global Automated Vehicle Bottom Scanner Analysis, Insights and Forecast, 2020-2032
- 5.1. Market Analysis, Insights and Forecast - by Application
- 5.1.1. Government Agencies
- 5.1.2. Stations, Airports, etc
- 5.1.3. Highway
- 5.1.4. Checkpoint
- 5.1.5. Others
- 5.2. Market Analysis, Insights and Forecast - by Types
- 5.2.1. Fixed
- 5.2.2. Mobile
- 5.3. Market Analysis, Insights and Forecast - by Region
- 5.3.1. North America
- 5.3.2. South America
- 5.3.3. Europe
- 5.3.4. Middle East & Africa
- 5.3.5. Asia Pacific
- 5.1. Market Analysis, Insights and Forecast - by Application
- 6. North America Automated Vehicle Bottom Scanner Analysis, Insights and Forecast, 2020-2032
- 6.1. Market Analysis, Insights and Forecast - by Application
- 6.1.1. Government Agencies
- 6.1.2. Stations, Airports, etc
- 6.1.3. Highway
- 6.1.4. Checkpoint
- 6.1.5. Others
- 6.2. Market Analysis, Insights and Forecast - by Types
- 6.2.1. Fixed
- 6.2.2. Mobile
- 6.1. Market Analysis, Insights and Forecast - by Application
- 7. South America Automated Vehicle Bottom Scanner Analysis, Insights and Forecast, 2020-2032
- 7.1. Market Analysis, Insights and Forecast - by Application
- 7.1.1. Government Agencies
- 7.1.2. Stations, Airports, etc
- 7.1.3. Highway
- 7.1.4. Checkpoint
- 7.1.5. Others
- 7.2. Market Analysis, Insights and Forecast - by Types
- 7.2.1. Fixed
- 7.2.2. Mobile
- 7.1. Market Analysis, Insights and Forecast - by Application
- 8. Europe Automated Vehicle Bottom Scanner Analysis, Insights and Forecast, 2020-2032
- 8.1. Market Analysis, Insights and Forecast - by Application
- 8.1.1. Government Agencies
- 8.1.2. Stations, Airports, etc
- 8.1.3. Highway
- 8.1.4. Checkpoint
- 8.1.5. Others
- 8.2. Market Analysis, Insights and Forecast - by Types
- 8.2.1. Fixed
- 8.2.2. Mobile
- 8.1. Market Analysis, Insights and Forecast - by Application
- 9. Middle East & Africa Automated Vehicle Bottom Scanner Analysis, Insights and Forecast, 2020-2032
- 9.1. Market Analysis, Insights and Forecast - by Application
- 9.1.1. Government Agencies
- 9.1.2. Stations, Airports, etc
- 9.1.3. Highway
- 9.1.4. Checkpoint
- 9.1.5. Others
- 9.2. Market Analysis, Insights and Forecast - by Types
- 9.2.1. Fixed
- 9.2.2. Mobile
- 9.1. Market Analysis, Insights and Forecast - by Application
- 10. Asia Pacific Automated Vehicle Bottom Scanner Analysis, Insights and Forecast, 2020-2032
- 10.1. Market Analysis, Insights and Forecast - by Application
- 10.1.1. Government Agencies
- 10.1.2. Stations, Airports, etc
- 10.1.3. Highway
- 10.1.4. Checkpoint
- 10.1.5. Others
- 10.2. Market Analysis, Insights and Forecast - by Types
- 10.2.1. Fixed
- 10.2.2. Mobile
- 10.1. Market Analysis, Insights and Forecast - by Application
- 11. Competitive Analysis
- 11.1. Global Market Share Analysis 2025
- 11.2. Company Profiles
- 11.2.1 A2 Technology
- 11.2.1.1. Overview
- 11.2.1.2. Products
- 11.2.1.3. SWOT Analysis
- 11.2.1.4. Recent Developments
- 11.2.1.5. Financials (Based on Availability)
- 11.2.2 Comm Port
- 11.2.2.1. Overview
- 11.2.2.2. Products
- 11.2.2.3. SWOT Analysis
- 11.2.2.4. Recent Developments
- 11.2.2.5. Financials (Based on Availability)
- 11.2.3 EL-GO
- 11.2.3.1. Overview
- 11.2.3.2. Products
- 11.2.3.3. SWOT Analysis
- 11.2.3.4. Recent Developments
- 11.2.3.5. Financials (Based on Availability)
- 11.2.4 Gatekeeper
- 11.2.4.1. Overview
- 11.2.4.2. Products
- 11.2.4.3. SWOT Analysis
- 11.2.4.4. Recent Developments
- 11.2.4.5. Financials (Based on Availability)
- 11.2.5 Hikvision
- 11.2.5.1. Overview
- 11.2.5.2. Products
- 11.2.5.3. SWOT Analysis
- 11.2.5.4. Recent Developments
- 11.2.5.5. Financials (Based on Availability)
- 11.2.6 Matrix Security
- 11.2.6.1. Overview
- 11.2.6.2. Products
- 11.2.6.3. SWOT Analysis
- 11.2.6.4. Recent Developments
- 11.2.6.5. Financials (Based on Availability)
- 11.2.7 SafeAgle
- 11.2.7.1. Overview
- 11.2.7.2. Products
- 11.2.7.3. SWOT Analysis
- 11.2.7.4. Recent Developments
- 11.2.7.5. Financials (Based on Availability)
- 11.2.8 SECOM
- 11.2.8.1. Overview
- 11.2.8.2. Products
- 11.2.8.3. SWOT Analysis
- 11.2.8.4. Recent Developments
- 11.2.8.5. Financials (Based on Availability)
- 11.2.9 SecuScan
- 11.2.9.1. Overview
- 11.2.9.2. Products
- 11.2.9.3. SWOT Analysis
- 11.2.9.4. Recent Developments
- 11.2.9.5. Financials (Based on Availability)
- 11.2.10 Ulgen
- 11.2.10.1. Overview
- 11.2.10.2. Products
- 11.2.10.3. SWOT Analysis
- 11.2.10.4. Recent Developments
- 11.2.10.5. Financials (Based on Availability)
- 11.2.11 UVIScan
- 11.2.11.1. Overview
- 11.2.11.2. Products
- 11.2.11.3. SWOT Analysis
- 11.2.11.4. Recent Developments
- 11.2.11.5. Financials (Based on Availability)
- 11.2.12 Vehant
- 11.2.12.1. Overview
- 11.2.12.2. Products
- 11.2.12.3. SWOT Analysis
- 11.2.12.4. Recent Developments
- 11.2.12.5. Financials (Based on Availability)
- 11.2.13 Westminster
- 11.2.13.1. Overview
- 11.2.13.2. Products
- 11.2.13.3. SWOT Analysis
- 11.2.13.4. Recent Developments
- 11.2.13.5. Financials (Based on Availability)
- 11.2.14 ZKTeco Co
- 11.2.14.1. Overview
- 11.2.14.2. Products
- 11.2.14.3. SWOT Analysis
- 11.2.14.4. Recent Developments
- 11.2.14.5. Financials (Based on Availability)
- 11.2.15 ZOAN GAOKE
- 11.2.15.1. Overview
- 11.2.15.2. Products
- 11.2.15.3. SWOT Analysis
- 11.2.15.4. Recent Developments
- 11.2.15.5. Financials (Based on Availability)
- 11.2.16 Advanced Detection Technology
- 11.2.16.1. Overview
- 11.2.16.2. Products
- 11.2.16.3. SWOT Analysis
- 11.2.16.4. Recent Developments
- 11.2.16.5. Financials (Based on Availability)
- 11.2.17 Nestor Technologies
- 11.2.17.1. Overview
- 11.2.17.2. Products
- 11.2.17.3. SWOT Analysis
- 11.2.17.4. Recent Developments
- 11.2.17.5. Financials (Based on Availability)
- 11.2.1 A2 Technology
List of Figures
- Figure 1: Global Automated Vehicle Bottom Scanner Revenue Breakdown (undefined, %) by Region 2025 & 2033
- Figure 2: North America Automated Vehicle Bottom Scanner Revenue (undefined), by Application 2025 & 2033
- Figure 3: North America Automated Vehicle Bottom Scanner Revenue Share (%), by Application 2025 & 2033
- Figure 4: North America Automated Vehicle Bottom Scanner Revenue (undefined), by Types 2025 & 2033
- Figure 5: North America Automated Vehicle Bottom Scanner Revenue Share (%), by Types 2025 & 2033
- Figure 6: North America Automated Vehicle Bottom Scanner Revenue (undefined), by Country 2025 & 2033
- Figure 7: North America Automated Vehicle Bottom Scanner Revenue Share (%), by Country 2025 & 2033
- Figure 8: South America Automated Vehicle Bottom Scanner Revenue (undefined), by Application 2025 & 2033
- Figure 9: South America Automated Vehicle Bottom Scanner Revenue Share (%), by Application 2025 & 2033
- Figure 10: South America Automated Vehicle Bottom Scanner Revenue (undefined), by Types 2025 & 2033
- Figure 11: South America Automated Vehicle Bottom Scanner Revenue Share (%), by Types 2025 & 2033
- Figure 12: South America Automated Vehicle Bottom Scanner Revenue (undefined), by Country 2025 & 2033
- Figure 13: South America Automated Vehicle Bottom Scanner Revenue Share (%), by Country 2025 & 2033
- Figure 14: Europe Automated Vehicle Bottom Scanner Revenue (undefined), by Application 2025 & 2033
- Figure 15: Europe Automated Vehicle Bottom Scanner Revenue Share (%), by Application 2025 & 2033
- Figure 16: Europe Automated Vehicle Bottom Scanner Revenue (undefined), by Types 2025 & 2033
- Figure 17: Europe Automated Vehicle Bottom Scanner Revenue Share (%), by Types 2025 & 2033
- Figure 18: Europe Automated Vehicle Bottom Scanner Revenue (undefined), by Country 2025 & 2033
- Figure 19: Europe Automated Vehicle Bottom Scanner Revenue Share (%), by Country 2025 & 2033
- Figure 20: Middle East & Africa Automated Vehicle Bottom Scanner Revenue (undefined), by Application 2025 & 2033
- Figure 21: Middle East & Africa Automated Vehicle Bottom Scanner Revenue Share (%), by Application 2025 & 2033
- Figure 22: Middle East & Africa Automated Vehicle Bottom Scanner Revenue (undefined), by Types 2025 & 2033
- Figure 23: Middle East & Africa Automated Vehicle Bottom Scanner Revenue Share (%), by Types 2025 & 2033
- Figure 24: Middle East & Africa Automated Vehicle Bottom Scanner Revenue (undefined), by Country 2025 & 2033
- Figure 25: Middle East & Africa Automated Vehicle Bottom Scanner Revenue Share (%), by Country 2025 & 2033
- Figure 26: Asia Pacific Automated Vehicle Bottom Scanner Revenue (undefined), by Application 2025 & 2033
- Figure 27: Asia Pacific Automated Vehicle Bottom Scanner Revenue Share (%), by Application 2025 & 2033
- Figure 28: Asia Pacific Automated Vehicle Bottom Scanner Revenue (undefined), by Types 2025 & 2033
- Figure 29: Asia Pacific Automated Vehicle Bottom Scanner Revenue Share (%), by Types 2025 & 2033
- Figure 30: Asia Pacific Automated Vehicle Bottom Scanner Revenue (undefined), by Country 2025 & 2033
- Figure 31: Asia Pacific Automated Vehicle Bottom Scanner Revenue Share (%), by Country 2025 & 2033
List of Tables
- Table 1: Global Automated Vehicle Bottom Scanner Revenue undefined Forecast, by Application 2020 & 2033
- Table 2: Global Automated Vehicle Bottom Scanner Revenue undefined Forecast, by Types 2020 & 2033
- Table 3: Global Automated Vehicle Bottom Scanner Revenue undefined Forecast, by Region 2020 & 2033
- Table 4: Global Automated Vehicle Bottom Scanner Revenue undefined Forecast, by Application 2020 & 2033
- Table 5: Global Automated Vehicle Bottom Scanner Revenue undefined Forecast, by Types 2020 & 2033
- Table 6: Global Automated Vehicle Bottom Scanner Revenue undefined Forecast, by Country 2020 & 2033
- Table 7: United States Automated Vehicle Bottom Scanner Revenue (undefined) Forecast, by Application 2020 & 2033
- Table 8: Canada Automated Vehicle Bottom Scanner Revenue (undefined) Forecast, by Application 2020 & 2033
- Table 9: Mexico Automated Vehicle Bottom Scanner Revenue (undefined) Forecast, by Application 2020 & 2033
- Table 10: Global Automated Vehicle Bottom Scanner Revenue undefined Forecast, by Application 2020 & 2033
- Table 11: Global Automated Vehicle Bottom Scanner Revenue undefined Forecast, by Types 2020 & 2033
- Table 12: Global Automated Vehicle Bottom Scanner Revenue undefined Forecast, by Country 2020 & 2033
- Table 13: Brazil Automated Vehicle Bottom Scanner Revenue (undefined) Forecast, by Application 2020 & 2033
- Table 14: Argentina Automated Vehicle Bottom Scanner Revenue (undefined) Forecast, by Application 2020 & 2033
- Table 15: Rest of South America Automated Vehicle Bottom Scanner Revenue (undefined) Forecast, by Application 2020 & 2033
- Table 16: Global Automated Vehicle Bottom Scanner Revenue undefined Forecast, by Application 2020 & 2033
- Table 17: Global Automated Vehicle Bottom Scanner Revenue undefined Forecast, by Types 2020 & 2033
- Table 18: Global Automated Vehicle Bottom Scanner Revenue undefined Forecast, by Country 2020 & 2033
- Table 19: United Kingdom Automated Vehicle Bottom Scanner Revenue (undefined) Forecast, by Application 2020 & 2033
- Table 20: Germany Automated Vehicle Bottom Scanner Revenue (undefined) Forecast, by Application 2020 & 2033
- Table 21: France Automated Vehicle Bottom Scanner Revenue (undefined) Forecast, by Application 2020 & 2033
- Table 22: Italy Automated Vehicle Bottom Scanner Revenue (undefined) Forecast, by Application 2020 & 2033
- Table 23: Spain Automated Vehicle Bottom Scanner Revenue (undefined) Forecast, by Application 2020 & 2033
- Table 24: Russia Automated Vehicle Bottom Scanner Revenue (undefined) Forecast, by Application 2020 & 2033
- Table 25: Benelux Automated Vehicle Bottom Scanner Revenue (undefined) Forecast, by Application 2020 & 2033
- Table 26: Nordics Automated Vehicle Bottom Scanner Revenue (undefined) Forecast, by Application 2020 & 2033
- Table 27: Rest of Europe Automated Vehicle Bottom Scanner Revenue (undefined) Forecast, by Application 2020 & 2033
- Table 28: Global Automated Vehicle Bottom Scanner Revenue undefined Forecast, by Application 2020 & 2033
- Table 29: Global Automated Vehicle Bottom Scanner Revenue undefined Forecast, by Types 2020 & 2033
- Table 30: Global Automated Vehicle Bottom Scanner Revenue undefined Forecast, by Country 2020 & 2033
- Table 31: Turkey Automated Vehicle Bottom Scanner Revenue (undefined) Forecast, by Application 2020 & 2033
- Table 32: Israel Automated Vehicle Bottom Scanner Revenue (undefined) Forecast, by Application 2020 & 2033
- Table 33: GCC Automated Vehicle Bottom Scanner Revenue (undefined) Forecast, by Application 2020 & 2033
- Table 34: North Africa Automated Vehicle Bottom Scanner Revenue (undefined) Forecast, by Application 2020 & 2033
- Table 35: South Africa Automated Vehicle Bottom Scanner Revenue (undefined) Forecast, by Application 2020 & 2033
- Table 36: Rest of Middle East & Africa Automated Vehicle Bottom Scanner Revenue (undefined) Forecast, by Application 2020 & 2033
- Table 37: Global Automated Vehicle Bottom Scanner Revenue undefined Forecast, by Application 2020 & 2033
- Table 38: Global Automated Vehicle Bottom Scanner Revenue undefined Forecast, by Types 2020 & 2033
- Table 39: Global Automated Vehicle Bottom Scanner Revenue undefined Forecast, by Country 2020 & 2033
- Table 40: China Automated Vehicle Bottom Scanner Revenue (undefined) Forecast, by Application 2020 & 2033
- Table 41: India Automated Vehicle Bottom Scanner Revenue (undefined) Forecast, by Application 2020 & 2033
- Table 42: Japan Automated Vehicle Bottom Scanner Revenue (undefined) Forecast, by Application 2020 & 2033
- Table 43: South Korea Automated Vehicle Bottom Scanner Revenue (undefined) Forecast, by Application 2020 & 2033
- Table 44: ASEAN Automated Vehicle Bottom Scanner Revenue (undefined) Forecast, by Application 2020 & 2033
- Table 45: Oceania Automated Vehicle Bottom Scanner Revenue (undefined) Forecast, by Application 2020 & 2033
- Table 46: Rest of Asia Pacific Automated Vehicle Bottom Scanner Revenue (undefined) Forecast, by Application 2020 & 2033
Frequently Asked Questions
1. What is the projected Compound Annual Growth Rate (CAGR) of the Automated Vehicle Bottom Scanner?
The projected CAGR is approximately 14.07%.
2. Which companies are prominent players in the Automated Vehicle Bottom Scanner?
Key companies in the market include A2 Technology, Comm Port, EL-GO, Gatekeeper, Hikvision, Matrix Security, SafeAgle, SECOM, SecuScan, Ulgen, UVIScan, Vehant, Westminster, ZKTeco Co, ZOAN GAOKE, Advanced Detection Technology, Nestor Technologies.
3. What are the main segments of the Automated Vehicle Bottom Scanner?
The market segments include Application, Types.
4. Can you provide details about the market size?
The market size is estimated to be USD XXX N/A as of 2022.
5. What are some drivers contributing to market growth?
N/A
6. What are the notable trends driving market growth?
N/A
7. Are there any restraints impacting market growth?
N/A
8. Can you provide examples of recent developments in the market?
N/A
9. What pricing options are available for accessing the report?
Pricing options include single-user, multi-user, and enterprise licenses priced at USD 2900.00, USD 4350.00, and USD 5800.00 respectively.
10. Is the market size provided in terms of value or volume?
The market size is provided in terms of value, measured in N/A.
11. Are there any specific market keywords associated with the report?
Yes, the market keyword associated with the report is "Automated Vehicle Bottom Scanner," which aids in identifying and referencing the specific market segment covered.
12. How do I determine which pricing option suits my needs best?
The pricing options vary based on user requirements and access needs. Individual users may opt for single-user licenses, while businesses requiring broader access may choose multi-user or enterprise licenses for cost-effective access to the report.
13. Are there any additional resources or data provided in the Automated Vehicle Bottom Scanner report?
While the report offers comprehensive insights, it's advisable to review the specific contents or supplementary materials provided to ascertain if additional resources or data are available.
14. How can I stay updated on further developments or reports in the Automated Vehicle Bottom Scanner?
To stay informed about further developments, trends, and reports in the Automated Vehicle Bottom Scanner, consider subscribing to industry newsletters, following relevant companies and organizations, or regularly checking reputable industry news sources and publications.
Methodology
Step 1 - Identification of Relevant Samples Size from Population Database


Step 2 - Approaches for Defining Global Market Size (Value, Volume* & Price*)

Note*: In applicable scenarios
Step 3 - Data Sources
Primary Research
- Web Analytics
- Survey Reports
- Research Institute
- Latest Research Reports
- Opinion Leaders
Secondary Research
- Annual Reports
- White Paper
- Latest Press Release
- Industry Association
- Paid Database
- Investor Presentations

Step 4 - Data Triangulation
Involves using different sources of information in order to increase the validity of a study
These sources are likely to be stakeholders in a program - participants, other researchers, program staff, other community members, and so on.
Then we put all data in single framework & apply various statistical tools to find out the dynamic on the market.
During the analysis stage, feedback from the stakeholder groups would be compared to determine areas of agreement as well as areas of divergence