

Key Insights
The Asia-Pacific Demand Response (DR) market is poised for substantial expansion, driven by escalating electricity demand, rising energy costs, and a strong emphasis on grid stability and renewable energy integration. Supportive government initiatives promoting energy efficiency and smart grid development across the region's diverse energy landscape are key growth catalysts. The market is projected to achieve a CAGR of 17.7%, growing from an estimated 5.9 billion in the base year 2025 to reach significant valuations by 2033. Key market segments include Conventional and Automated DR, with the Commercial and Industrial sectors anticipated to lead market share due to their higher energy consumption and greater cost-saving potential through DR participation.
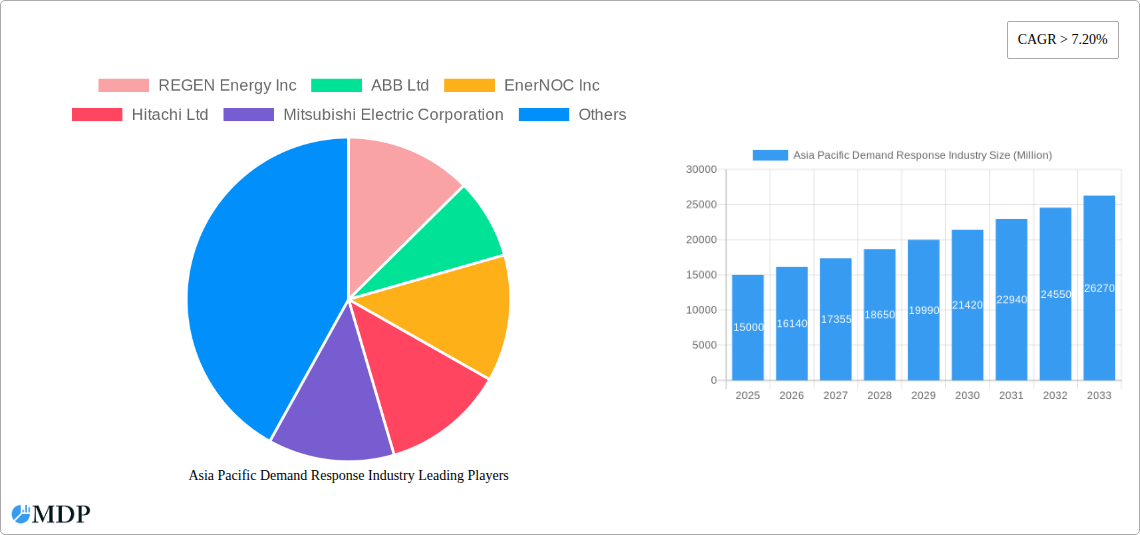
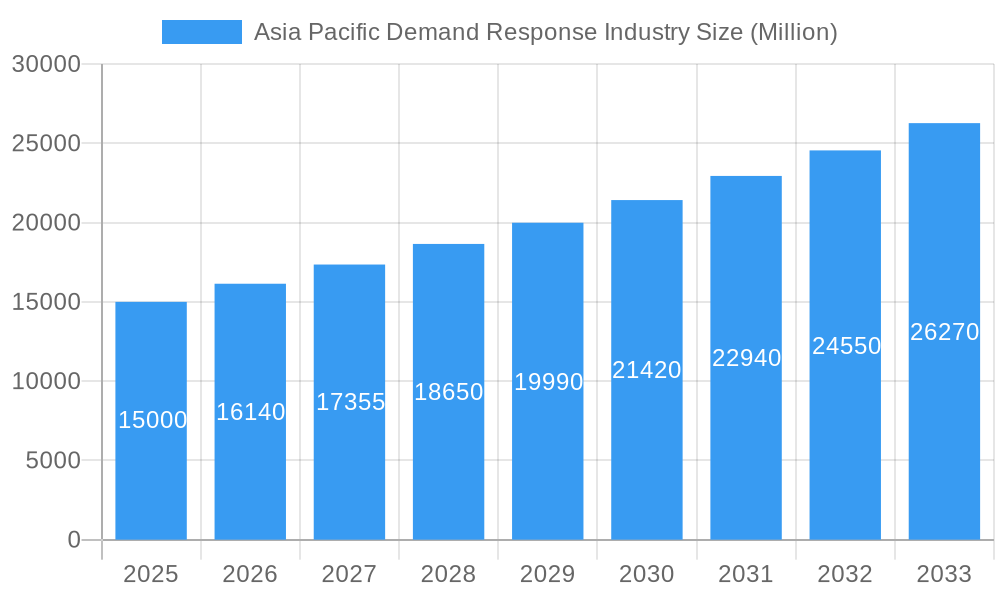
Asia Pacific Demand Response Industry Market Size (In Billion)
Major economies such as China, Japan, India, and South Korea are pivotal to market growth, underpinned by their advanced energy infrastructure and proactive government policies. Opportunities for enhanced market penetration lie in increasing consumer awareness and accelerating technological advancements for automated DR systems, particularly in the residential sector, alongside addressing regulatory complexities in select markets.
Asia Pacific Demand Response Industry Company Market Share
Market expansion is further propelled by escalating investments in smart grid technologies, the widespread adoption of advanced metering infrastructure (AMI), and the increasing integration of renewable energy sources. These trends necessitate robust DR strategies for managing intermittent renewable generation and ensuring grid reliability. Rapid economic development and urbanization in the Asia-Pacific region contribute to growing electricity demand, making DR solutions indispensable for efficient energy management. While the industrial sector currently holds a dominant market position, the residential sector presents significant untapped potential for future growth. Leading companies and strategic collaborations are driving innovation and market consolidation. Future growth trajectories will be shaped by the establishment of comprehensive regulatory frameworks, mitigation of cybersecurity concerns, and the successful promotion of widespread consumer adoption of DR technologies and programs.
Asia Pacific Demand Response Industry Market Report: 2019-2033
Uncover the lucrative opportunities and challenges shaping the future of the Asia Pacific demand response market. This comprehensive report provides a detailed analysis of the industry's dynamics, trends, leading players, and future outlook from 2019 to 2033. Benefit from actionable insights to navigate this rapidly evolving landscape.
Download this insightful report to gain a competitive edge and make informed business decisions. The report uses 2025 as the base year and provides forecasts until 2033, covering historical data from 2019-2024. The market size is projected to reach xx Million by 2033.
Asia Pacific Demand Response Industry Market Dynamics & Concentration
The Asia Pacific demand response market is experiencing significant growth driven by increasing electricity prices, stringent environmental regulations, and the integration of renewable energy sources. Market concentration is relatively moderate, with several major players holding substantial market share, but a fragmented landscape exists, especially in emerging markets. Key innovation drivers include advancements in smart grid technologies, artificial intelligence (AI), and the Internet of Things (IoT). Regulatory frameworks are evolving, with varying policies across different countries, influencing market penetration rates. Product substitutes, such as energy storage solutions, pose a competitive challenge. End-user trends favor automated demand response systems, particularly in the commercial and industrial sectors. Mergers and acquisitions (M&A) activity has been moderate, with approximately xx M&A deals recorded during the historical period (2019-2024), leading to consolidation among some key players.
- Market Share: Leading companies like ABB Ltd, Siemens AG, and Schneider Electric SE hold significant market share, estimated at xx%, xx%, and xx% respectively in 2025. However, smaller players are gaining traction in niche segments.
- M&A Activity: The forecast period (2025-2033) is predicted to see an increase in M&A activity, with an estimated xx deals, driven by strategic expansion and technological consolidation.
- Innovation Drivers: Advancements in AI-powered predictive analytics and IoT-enabled devices are pushing market innovation.
- Regulatory Landscape: Government initiatives promoting energy efficiency and renewable energy integration are key drivers, though inconsistencies across the region create challenges.
Asia Pacific Demand Response Industry Industry Trends & Analysis
The Asia Pacific demand response market is characterized by a robust Compound Annual Growth Rate (CAGR) of xx% during the forecast period (2025-2033). Market growth is primarily driven by increasing energy demand, rising electricity prices, and government initiatives promoting energy efficiency. Technological disruptions, such as the widespread adoption of smart meters and advanced analytics, are accelerating market penetration. Consumer preferences are shifting towards automated and intelligent demand response solutions that offer greater convenience and cost savings. Competitive dynamics are intense, with both established players and new entrants vying for market share. Market penetration for automated demand response systems is projected to reach xx% by 2033, primarily driven by commercial and industrial segments.
Leading Markets & Segments in Asia Pacific Demand Response Industry
China, Japan, and India are the dominant markets in the Asia Pacific demand response industry, accounting for approximately xx% of the total market value in 2025. The commercial and industrial segments represent the largest end-use applications, driven by higher energy consumption and cost-saving opportunities. Automated demand response systems are gaining significant traction compared to conventional methods.
Key Drivers:
- China: Strong government support for energy efficiency programs and rapid industrialization.
- Japan: High energy costs and advanced technological capabilities.
- India: Growing energy demand and increasing focus on renewable energy integration.
- Commercial & Industrial Segments: Higher energy consumption and cost-saving potential.
- Automated Demand Response: Technological advancements and improved efficiency compared to conventional methods.
Dominance Analysis: China's large industrial base and supportive policies contribute significantly to its market dominance. Japan’s technological expertise and high energy prices propel its growth, while India's substantial energy demand and expanding economy fuel its market expansion.
Asia Pacific Demand Response Industry Product Developments
Recent product innovations focus on enhancing the capabilities of automated demand response systems, including AI-powered predictive analytics for optimized energy consumption, integration with renewable energy sources, and improved user interfaces for greater convenience. The adoption of advanced communication technologies such as 5G and IoT are improving system performance and reliability. These developments improve overall market fit by providing more efficient and cost-effective solutions for consumers.
Key Drivers of Asia Pacific Demand Response Industry Growth
Technological advancements, supportive government policies, and increasing awareness of energy efficiency are the primary drivers of growth. AI-powered analytics and IoT-enabled devices are optimizing energy consumption and reducing costs. Government initiatives promoting renewable energy integration and energy efficiency targets are incentivizing the adoption of demand response technologies. The rising cost of electricity is also pushing businesses and consumers to adopt cost-saving solutions.
Challenges in the Asia Pacific Demand Response Industry Market
Regulatory inconsistencies across different countries present a challenge to market standardization and expansion. Supply chain disruptions, particularly in the procurement of critical components, can impact market growth. The intense competition among established players and emerging startups poses a challenge for market entrants. Cybersecurity concerns associated with the increasing reliance on connected devices are also a significant barrier. The cost of implementation and integration for some automated solutions can deter some consumers from adopting the technology.
Emerging Opportunities in Asia Pacific Demand Response Industry
Technological breakthroughs in AI, machine learning, and blockchain offer significant growth opportunities. Strategic partnerships between energy providers, technology companies, and end-users are creating innovative solutions. Expansion into emerging markets with significant energy demand and untapped potential holds immense promise. Developing user-friendly interfaces and lowering implementation costs can open the market to a wider range of customers. Increasing integration with electric vehicle charging infrastructure presents a major opportunity for growth.
Leading Players in the Asia Pacific Demand Response Industry Sector
Key Milestones in Asia Pacific Demand Response Industry Industry
- 2020: Several governments in the region implemented new energy efficiency regulations.
- 2021: Significant investments in smart grid infrastructure were made across the region.
- 2022: Launch of several new AI-powered demand response platforms.
- 2023: Major M&A activity between key players in the industry.
- 2024: Several large-scale demand response pilot projects commenced.
Strategic Outlook for Asia Pacific Demand Response Industry Market
The Asia Pacific demand response market is poised for sustained growth, driven by technological advancements, supportive government policies, and increasing awareness of energy efficiency. The market presents significant opportunities for established players and new entrants. Strategic partnerships and investments in research and development will be crucial for success. A focus on providing user-friendly solutions and integrating with other energy technologies is vital for capturing a larger market share. The market is expected to continue its robust growth trajectory throughout the forecast period.
Asia Pacific Demand Response Industry Segmentation
-
1. Type
- 1.1. Conventional Demand Response
- 1.2. Automated Demand Response
-
2. Geography
- 2.1. Australia
- 2.2. China
- 2.3. India
- 2.4. Japan
- 2.5. Rest of Asia-Pacific
Asia Pacific Demand Response Industry Segmentation By Geography
- 1. Australia
- 2. China
- 3. India
- 4. Japan
- 5. Rest of Asia Pacific
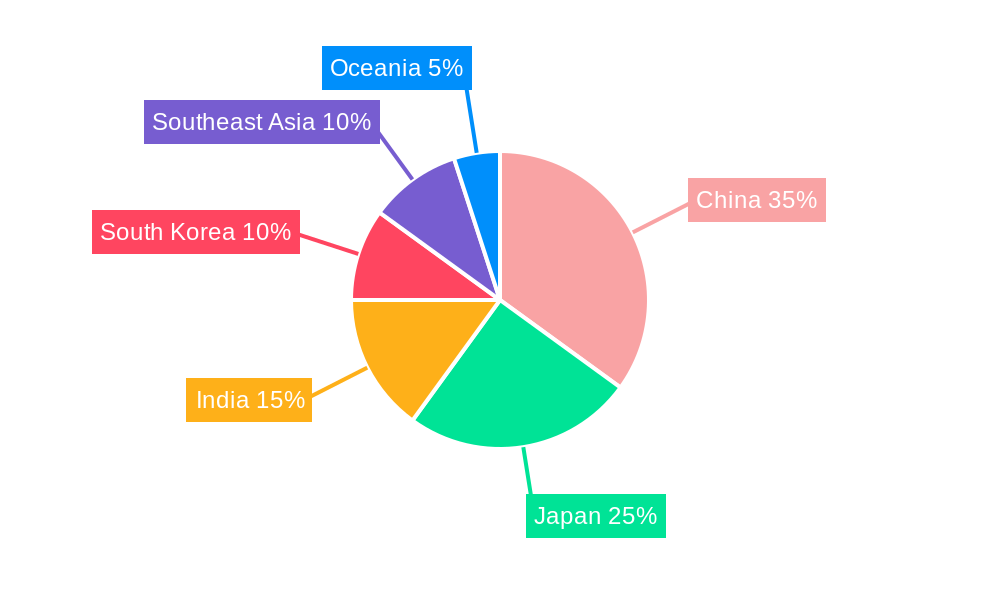
Asia Pacific Demand Response Industry Regional Market Share
Geographic Coverage of Asia Pacific Demand Response Industry
Asia Pacific Demand Response Industry REPORT HIGHLIGHTS
| Aspects | Details |
|---|---|
| Study Period | 2020-2034 |
| Base Year | 2025 |
| Estimated Year | 2026 |
| Forecast Period | 2026-2034 |
| Historical Period | 2020-2025 |
| Growth Rate | CAGR of 17.7% from 2020-2034 |
| Segmentation |
|
Table of Contents
- 1. Introduction
- 1.1. Research Scope
- 1.2. Market Segmentation
- 1.3. Research Methodology
- 1.4. Definitions and Assumptions
- 2. Executive Summary
- 2.1. Introduction
- 3. Market Dynamics
- 3.1. Introduction
- 3.2. Market Drivers
- 3.2.1. 4.; Growing Demand for Energy As A Service4.; Increasing Adoption of Distributed Energy Generation in Commercial and Industrial Sectors
- 3.3. Market Restrains
- 3.3.1. 4.; Lack of Awareness in Developing Economies and High Technological Costs
- 3.4. Market Trends
- 3.4.1. Automated Demand Response System Likely To Drive The Market
- 4. Market Factor Analysis
- 4.1. Porters Five Forces
- 4.2. Supply/Value Chain
- 4.3. PESTEL analysis
- 4.4. Market Entropy
- 4.5. Patent/Trademark Analysis
- 5. Asia Pacific Demand Response Industry Analysis, Insights and Forecast, 2020-2032
- 5.1. Market Analysis, Insights and Forecast - by Type
- 5.1.1. Conventional Demand Response
- 5.1.2. Automated Demand Response
- 5.2. Market Analysis, Insights and Forecast - by Geography
- 5.2.1. Australia
- 5.2.2. China
- 5.2.3. India
- 5.2.4. Japan
- 5.2.5. Rest of Asia-Pacific
- 5.3. Market Analysis, Insights and Forecast - by Region
- 5.3.1. Australia
- 5.3.2. China
- 5.3.3. India
- 5.3.4. Japan
- 5.3.5. Rest of Asia Pacific
- 5.1. Market Analysis, Insights and Forecast - by Type
- 6. Australia Asia Pacific Demand Response Industry Analysis, Insights and Forecast, 2020-2032
- 6.1. Market Analysis, Insights and Forecast - by Type
- 6.1.1. Conventional Demand Response
- 6.1.2. Automated Demand Response
- 6.2. Market Analysis, Insights and Forecast - by Geography
- 6.2.1. Australia
- 6.2.2. China
- 6.2.3. India
- 6.2.4. Japan
- 6.2.5. Rest of Asia-Pacific
- 6.1. Market Analysis, Insights and Forecast - by Type
- 7. China Asia Pacific Demand Response Industry Analysis, Insights and Forecast, 2020-2032
- 7.1. Market Analysis, Insights and Forecast - by Type
- 7.1.1. Conventional Demand Response
- 7.1.2. Automated Demand Response
- 7.2. Market Analysis, Insights and Forecast - by Geography
- 7.2.1. Australia
- 7.2.2. China
- 7.2.3. India
- 7.2.4. Japan
- 7.2.5. Rest of Asia-Pacific
- 7.1. Market Analysis, Insights and Forecast - by Type
- 8. India Asia Pacific Demand Response Industry Analysis, Insights and Forecast, 2020-2032
- 8.1. Market Analysis, Insights and Forecast - by Type
- 8.1.1. Conventional Demand Response
- 8.1.2. Automated Demand Response
- 8.2. Market Analysis, Insights and Forecast - by Geography
- 8.2.1. Australia
- 8.2.2. China
- 8.2.3. India
- 8.2.4. Japan
- 8.2.5. Rest of Asia-Pacific
- 8.1. Market Analysis, Insights and Forecast - by Type
- 9. Japan Asia Pacific Demand Response Industry Analysis, Insights and Forecast, 2020-2032
- 9.1. Market Analysis, Insights and Forecast - by Type
- 9.1.1. Conventional Demand Response
- 9.1.2. Automated Demand Response
- 9.2. Market Analysis, Insights and Forecast - by Geography
- 9.2.1. Australia
- 9.2.2. China
- 9.2.3. India
- 9.2.4. Japan
- 9.2.5. Rest of Asia-Pacific
- 9.1. Market Analysis, Insights and Forecast - by Type
- 10. Rest of Asia Pacific Asia Pacific Demand Response Industry Analysis, Insights and Forecast, 2020-2032
- 10.1. Market Analysis, Insights and Forecast - by Type
- 10.1.1. Conventional Demand Response
- 10.1.2. Automated Demand Response
- 10.2. Market Analysis, Insights and Forecast - by Geography
- 10.2.1. Australia
- 10.2.2. China
- 10.2.3. India
- 10.2.4. Japan
- 10.2.5. Rest of Asia-Pacific
- 10.1. Market Analysis, Insights and Forecast - by Type
- 11. Competitive Analysis
- 11.1. Market Share Analysis 2025
- 11.2. Company Profiles
- 11.2.1 REGEN Energy Inc
- 11.2.1.1. Overview
- 11.2.1.2. Products
- 11.2.1.3. SWOT Analysis
- 11.2.1.4. Recent Developments
- 11.2.1.5. Financials (Based on Availability)
- 11.2.2 ABB Ltd
- 11.2.2.1. Overview
- 11.2.2.2. Products
- 11.2.2.3. SWOT Analysis
- 11.2.2.4. Recent Developments
- 11.2.2.5. Financials (Based on Availability)
- 11.2.3 EnerNOC Inc
- 11.2.3.1. Overview
- 11.2.3.2. Products
- 11.2.3.3. SWOT Analysis
- 11.2.3.4. Recent Developments
- 11.2.3.5. Financials (Based on Availability)
- 11.2.4 Hitachi Ltd
- 11.2.4.1. Overview
- 11.2.4.2. Products
- 11.2.4.3. SWOT Analysis
- 11.2.4.4. Recent Developments
- 11.2.4.5. Financials (Based on Availability)
- 11.2.5 Mitsubishi Electric Corporation
- 11.2.5.1. Overview
- 11.2.5.2. Products
- 11.2.5.3. SWOT Analysis
- 11.2.5.4. Recent Developments
- 11.2.5.5. Financials (Based on Availability)
- 11.2.6 Siemens AG
- 11.2.6.1. Overview
- 11.2.6.2. Products
- 11.2.6.3. SWOT Analysis
- 11.2.6.4. Recent Developments
- 11.2.6.5. Financials (Based on Availability)
- 11.2.7 Schneider Electric SE
- 11.2.7.1. Overview
- 11.2.7.2. Products
- 11.2.7.3. SWOT Analysis
- 11.2.7.4. Recent Developments
- 11.2.7.5. Financials (Based on Availability)
- 11.2.8 Eaton Corporation PLC
- 11.2.8.1. Overview
- 11.2.8.2. Products
- 11.2.8.3. SWOT Analysis
- 11.2.8.4. Recent Developments
- 11.2.8.5. Financials (Based on Availability)
- 11.2.9 Alstom Inc
- 11.2.9.1. Overview
- 11.2.9.2. Products
- 11.2.9.3. SWOT Analysis
- 11.2.9.4. Recent Developments
- 11.2.9.5. Financials (Based on Availability)
- 11.2.10 General Electric Company
- 11.2.10.1. Overview
- 11.2.10.2. Products
- 11.2.10.3. SWOT Analysis
- 11.2.10.4. Recent Developments
- 11.2.10.5. Financials (Based on Availability)
- 11.2.11 Silver Spring Networks
- 11.2.11.1. Overview
- 11.2.11.2. Products
- 11.2.11.3. SWOT Analysis
- 11.2.11.4. Recent Developments
- 11.2.11.5. Financials (Based on Availability)
- 11.2.12 Autogrid Systems Inc
- 11.2.12.1. Overview
- 11.2.12.2. Products
- 11.2.12.3. SWOT Analysis
- 11.2.12.4. Recent Developments
- 11.2.12.5. Financials (Based on Availability)
- 11.2.1 REGEN Energy Inc
List of Figures
- Figure 1: Asia Pacific Demand Response Industry Revenue Breakdown (billion, %) by Product 2025 & 2033
- Figure 2: Asia Pacific Demand Response Industry Share (%) by Company 2025
List of Tables
- Table 1: Asia Pacific Demand Response Industry Revenue billion Forecast, by Type 2020 & 2033
- Table 2: Asia Pacific Demand Response Industry Revenue billion Forecast, by Geography 2020 & 2033
- Table 3: Asia Pacific Demand Response Industry Revenue billion Forecast, by Region 2020 & 2033
- Table 4: Asia Pacific Demand Response Industry Revenue billion Forecast, by Type 2020 & 2033
- Table 5: Asia Pacific Demand Response Industry Revenue billion Forecast, by Geography 2020 & 2033
- Table 6: Asia Pacific Demand Response Industry Revenue billion Forecast, by Country 2020 & 2033
- Table 7: Asia Pacific Demand Response Industry Revenue billion Forecast, by Type 2020 & 2033
- Table 8: Asia Pacific Demand Response Industry Revenue billion Forecast, by Geography 2020 & 2033
- Table 9: Asia Pacific Demand Response Industry Revenue billion Forecast, by Country 2020 & 2033
- Table 10: Asia Pacific Demand Response Industry Revenue billion Forecast, by Type 2020 & 2033
- Table 11: Asia Pacific Demand Response Industry Revenue billion Forecast, by Geography 2020 & 2033
- Table 12: Asia Pacific Demand Response Industry Revenue billion Forecast, by Country 2020 & 2033
- Table 13: Asia Pacific Demand Response Industry Revenue billion Forecast, by Type 2020 & 2033
- Table 14: Asia Pacific Demand Response Industry Revenue billion Forecast, by Geography 2020 & 2033
- Table 15: Asia Pacific Demand Response Industry Revenue billion Forecast, by Country 2020 & 2033
- Table 16: Asia Pacific Demand Response Industry Revenue billion Forecast, by Type 2020 & 2033
- Table 17: Asia Pacific Demand Response Industry Revenue billion Forecast, by Geography 2020 & 2033
- Table 18: Asia Pacific Demand Response Industry Revenue billion Forecast, by Country 2020 & 2033
Frequently Asked Questions
1. What is the projected Compound Annual Growth Rate (CAGR) of the Asia Pacific Demand Response Industry?
The projected CAGR is approximately 17.7%.
2. Which companies are prominent players in the Asia Pacific Demand Response Industry?
Key companies in the market include REGEN Energy Inc, ABB Ltd, EnerNOC Inc, Hitachi Ltd, Mitsubishi Electric Corporation, Siemens AG, Schneider Electric SE, Eaton Corporation PLC, Alstom Inc, General Electric Company, Silver Spring Networks, Autogrid Systems Inc.
3. What are the main segments of the Asia Pacific Demand Response Industry?
The market segments include Type, Geography.
4. Can you provide details about the market size?
The market size is estimated to be USD 5.9 billion as of 2022.
5. What are some drivers contributing to market growth?
4.; Growing Demand for Energy As A Service4.; Increasing Adoption of Distributed Energy Generation in Commercial and Industrial Sectors.
6. What are the notable trends driving market growth?
Automated Demand Response System Likely To Drive The Market.
7. Are there any restraints impacting market growth?
4.; Lack of Awareness in Developing Economies and High Technological Costs.
8. Can you provide examples of recent developments in the market?
N/A
9. What pricing options are available for accessing the report?
Pricing options include single-user, multi-user, and enterprise licenses priced at USD 4750, USD 5250, and USD 8750 respectively.
10. Is the market size provided in terms of value or volume?
The market size is provided in terms of value, measured in billion.
11. Are there any specific market keywords associated with the report?
Yes, the market keyword associated with the report is "Asia Pacific Demand Response Industry," which aids in identifying and referencing the specific market segment covered.
12. How do I determine which pricing option suits my needs best?
The pricing options vary based on user requirements and access needs. Individual users may opt for single-user licenses, while businesses requiring broader access may choose multi-user or enterprise licenses for cost-effective access to the report.
13. Are there any additional resources or data provided in the Asia Pacific Demand Response Industry report?
While the report offers comprehensive insights, it's advisable to review the specific contents or supplementary materials provided to ascertain if additional resources or data are available.
14. How can I stay updated on further developments or reports in the Asia Pacific Demand Response Industry?
To stay informed about further developments, trends, and reports in the Asia Pacific Demand Response Industry, consider subscribing to industry newsletters, following relevant companies and organizations, or regularly checking reputable industry news sources and publications.
Methodology
Step 1 - Identification of Relevant Samples Size from Population Database


Step 2 - Approaches for Defining Global Market Size (Value, Volume* & Price*)

Note*: In applicable scenarios
Step 3 - Data Sources
Primary Research
- Web Analytics
- Survey Reports
- Research Institute
- Latest Research Reports
- Opinion Leaders
Secondary Research
- Annual Reports
- White Paper
- Latest Press Release
- Industry Association
- Paid Database
- Investor Presentations

Step 4 - Data Triangulation
Involves using different sources of information in order to increase the validity of a study
These sources are likely to be stakeholders in a program - participants, other researchers, program staff, other community members, and so on.
Then we put all data in single framework & apply various statistical tools to find out the dynamic on the market.
During the analysis stage, feedback from the stakeholder groups would be compared to determine areas of agreement as well as areas of divergence