

Key Insights
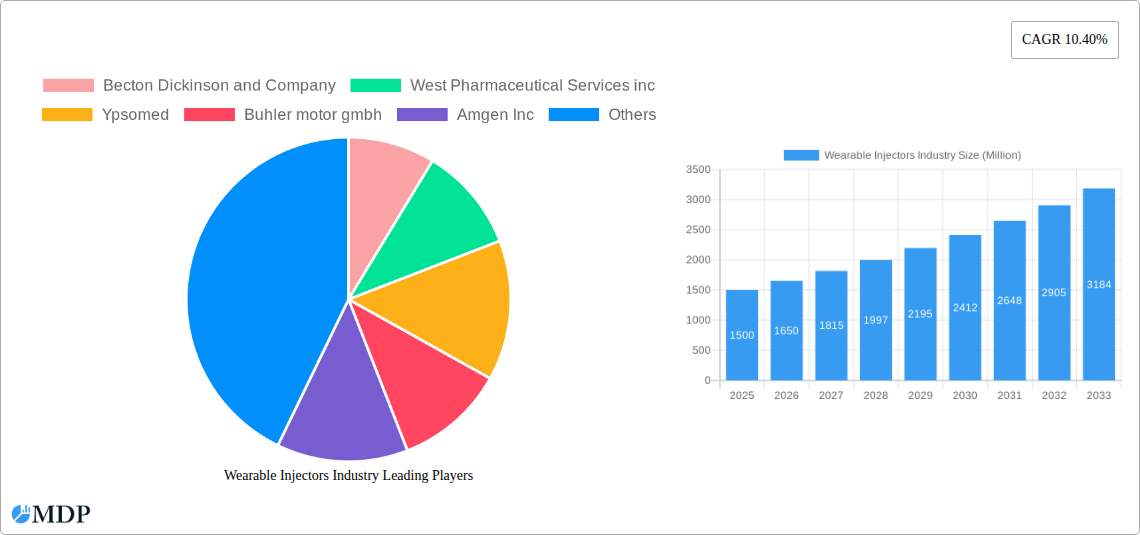
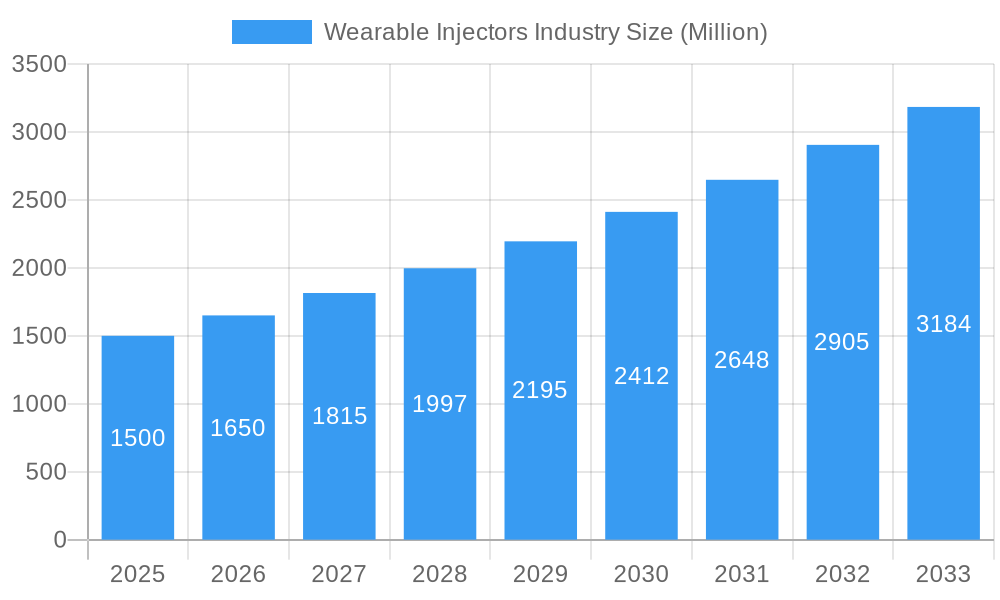
The global wearable injectors market is experiencing significant expansion, propelled by the rising incidence of chronic conditions necessitating frequent administration and a growing preference for convenient, patient-centric drug delivery solutions. This market is projected to witness a Compound Annual Growth Rate (CAGR) of 10.6%, reaching a market size of $10.1 billion by 2024. Key growth drivers include the increasing adoption of self-administered therapies for diabetes, autoimmune disorders, and oncology, where wearable injectors enhance patient compliance and convenience. Technological innovations in miniaturization, smart functionalities (e.g., data logging, remote monitoring), and advanced needle designs further stimulate market growth. While on-body injectors currently lead due to their discreet and continuous delivery capabilities, off-body injectors are poised for growth with larger drug reservoirs and easier refilling potential. North America and Europe dominate the market, supported by high healthcare spending and robust medical infrastructure. However, the Asia-Pacific region is expected to exhibit substantial growth, driven by rising disposable incomes, improved healthcare access, and a higher prevalence of chronic diseases. Market segmentation across therapeutic areas like oncology, autoimmune diseases, diabetes, and cardiovascular diseases underscores the broad applicability and dynamic nature of this sector. Intense competition among key players such as Becton Dickinson, West Pharmaceutical Services, and Ypsomed fosters continuous innovation in wearable injector technologies.
Wearable Injectors Industry Market Size (In Billion)
Challenges such as high initial device costs and the requirement for specialized training for patients and healthcare professionals may impede market penetration, particularly in emerging economies. Stringent regulatory pathways and approval processes also present hurdles. Nevertheless, ongoing technological advancements, strategic partnerships between pharmaceutical and device manufacturers, and heightened patient awareness are anticipated to overcome these obstacles. The wearable injectors market holds a promising future, with anticipated growth across diverse therapies and regions, ultimately improving patient outcomes and the quality of life for individuals managing chronic conditions.
Wearable Injectors Industry Company Market Share
Wearable Injectors Industry: Market Analysis & Forecast Report (2019-2033)
This comprehensive report provides an in-depth analysis of the global Wearable Injectors industry, offering invaluable insights for stakeholders, investors, and industry professionals. With a meticulous study period spanning 2019-2033, a base year of 2025, and a forecast period extending to 2033, this report delivers actionable intelligence for strategic decision-making. The market is segmented by type (On-Body Injectors, Off-Body Injectors), therapy (Oncology, Autoimmune Disease, Diabetes, Cardiovascular Disease, Others), and end-user (Hospitals and Clinics, Home Care, Others). Key players analyzed include Becton Dickinson and Company, West Pharmaceutical Services Inc., Ypsomed, Buhler Motor GmbH, Amgen Inc., Sensile Medical, Dexcom Inc., Insulet Corporation, Tandem Diabetes Care Inc., Eitan Medical, Stevanato Group, Enable Injections, and United Therapeutics (Steadymed Therapeutics). The report projects a market size exceeding xx Million by 2033.
Wearable Injectors Industry Market Dynamics & Concentration
The Wearable Injectors market is characterized by a moderately concentrated landscape, with a few dominant players holding significant market share. However, the presence of several innovative startups and the influx of funding indicate a potential shift toward a more competitive environment. Innovation is a key driver, fueled by advancements in microelectronics, drug delivery systems, and materials science. Stringent regulatory frameworks, particularly regarding safety and efficacy, shape the industry's development. Product substitutes, such as traditional injection methods, pose a challenge, but the convenience and patient compliance advantages of wearable injectors are driving adoption. End-user trends reveal a preference for minimally invasive, self-administered solutions, particularly among patients managing chronic conditions. Mergers and acquisitions (M&A) activity has been significant, with xx major deals recorded between 2019 and 2024, indicating strategic consolidation and expansion within the industry. The combined market share of the top three players is estimated at approximately xx%.
Wearable Injectors Industry Industry Trends & Analysis
The global wearable injectors market is experiencing robust growth, driven by several key factors. The rising prevalence of chronic diseases like diabetes and autoimmune disorders is a primary growth catalyst. Technological advancements, such as improved sensor technology and miniaturization of devices, are enhancing the efficacy and convenience of wearable injectors, thereby increasing their adoption. The CAGR during the forecast period (2025-2033) is projected to be xx%, with market penetration expected to reach xx% by 2033. Consumer preferences are increasingly shifting toward self-administration and remote monitoring capabilities, prompting manufacturers to incorporate connected health features and user-friendly interfaces. Competitive dynamics are intensifying, with established players and new entrants vying for market share through product differentiation, strategic partnerships, and technological innovation. This competitive landscape is pushing innovation and accelerating the pace of market development.
Leading Markets & Segments in Wearable Injectors Industry
The North American market currently holds the largest share in the global wearable injectors market, driven by high healthcare expenditure, a large patient population with chronic diseases, and robust regulatory support. Within the product segments, On-Body Injectors currently dominate, owing to their enhanced convenience and ease of use. In terms of therapeutic applications, the Diabetes segment shows the highest growth, fuelled by the increasing prevalence of diabetes globally.
Key Drivers for North America:
- High healthcare expenditure
- Strong regulatory framework encouraging innovation
- High prevalence of chronic diseases
- Early adoption of advanced medical technologies
Key Drivers for On-Body Injectors:
- Enhanced convenience and ease of use for patients.
- Improved patient compliance compared to other methods.
Key Drivers for Diabetes Therapy Segment:
- Increasing prevalence of diabetes worldwide.
- Rising demand for convenient and effective self-management solutions.
While the European and Asia-Pacific markets are also showing significant growth, the North American market maintains its leading position due to a combination of factors. This dominance is likely to continue in the forecast period, albeit with growing competition from other regions.
Wearable Injectors Industry Product Developments
Recent innovations in wearable injectors have focused on miniaturization, improved usability, and integration of smart features. Companies are developing devices with enhanced pain management, improved drug delivery precision, and remote monitoring capabilities. The market is witnessing a shift towards connected devices, allowing for data sharing and remote patient monitoring. These developments are enhancing patient compliance, optimizing treatment regimens, and improving overall healthcare outcomes. This focus on technological advancement is driving the market's growth and attracting new players.
Key Drivers of Wearable Injectors Industry Growth
Several factors are driving the growth of the wearable injectors market. The rising prevalence of chronic diseases requiring regular injections is a major driver. Technological advancements leading to smaller, more user-friendly devices are also crucial. Favorable regulatory environments in many countries are accelerating market adoption. Furthermore, increasing healthcare expenditure and improved reimbursement policies are providing further impetus to market expansion. Finally, strategic partnerships and collaborations among pharmaceutical companies, device manufacturers, and technology providers are facilitating innovation and market penetration.
Challenges in the Wearable Injectors Industry Market
The Wearable Injectors market faces challenges including stringent regulatory requirements, which can increase time and cost for product approvals. Supply chain complexities, particularly regarding the sourcing of specialized components, can lead to production delays and cost increases. Intense competition among existing players and the emergence of new entrants pose a constant threat. These factors collectively can impede market growth, potentially impacting profitability and market share for companies in the industry. For instance, delays in regulatory approvals can delay product launches, resulting in a loss of revenue.
Emerging Opportunities in Wearable Injectors Industry
The Wearable Injectors market offers significant long-term growth opportunities. Advancements in drug delivery technologies, such as implantable devices and micro-needle arrays, present promising avenues for future innovation. Strategic partnerships and collaborations can accelerate the development of new products and expand market reach. Expansion into emerging markets, particularly in Asia-Pacific and Latin America, presents significant untapped potential. These factors collectively contribute to a positive outlook for continued growth and expansion within the Wearable Injectors sector.
Leading Players in the Wearable Injectors Industry Sector
- Becton Dickinson and Company
- West Pharmaceutical Services Inc.
- Ypsomed
- Buhler motor gmbh
- Amgen Inc.
- Sensile Medical
- Dexcom Inc.
- Insulet Corporation
- Tandem Diabetes Care Inc.
- Eitan Medical
- Stevanato Group
- Enable Injections
- United Therapeutics (Steadymed Therapeutics)
Key Milestones in Wearable Injectors Industry Industry
- February 2022: Enable Injections raised a USD 215 Million round to fund work on the subcutaneous drug delivery system enFuse.
- June 2022: AbbVie received US FDA approval for SKYRIZI (risankizumab-rzaa), self-administered via subcutaneous injection with an On-Body Injector (OBI).
Strategic Outlook for Wearable Injectors Industry Market
The future of the wearable injectors market is bright, with significant growth potential driven by technological innovations, increasing prevalence of chronic diseases, and expanding market access. Strategic partnerships, focused research and development, and expansion into new therapeutic areas will be key success factors. Companies that effectively leverage these opportunities will be well-positioned to capitalize on the significant growth potential of this rapidly evolving market. The focus on personalized medicine and improved patient outcomes will continue to drive demand for innovative wearable injector technologies.
Wearable Injectors Industry Segmentation
-
1. Type
- 1.1. On-Body Injectors
- 1.2. Off-Body Injectors
-
2. Therapy
- 2.1. Oncology
- 2.2. Autoimmune Disease
- 2.3. Diabetes
- 2.4. Cardiovascular Disease
- 2.5. Others
-
3. End User
- 3.1. Hospitals and Clinics
- 3.2. Home Care
- 3.3. Others
Wearable Injectors Industry Segmentation By Geography
-
1. North America
- 1.1. United States
- 1.2. Canada
- 1.3. Mexico
-
2. Europe
- 2.1. Germany
- 2.2. United Kingdom
- 2.3. France
- 2.4. Italy
- 2.5. Spain
- 2.6. Rest of Europe
-
3. Asia Pacific
- 3.1. China
- 3.2. Japan
- 3.3. India
- 3.4. Australia
- 3.5. South Korea
- 3.6. Rest of Asia Pacific
-
4. Middle East and Africa
- 4.1. GCC
- 4.2. South Africa
- 4.3. Rest of Middle East and Africa
-
5. South America
- 5.1. Brazil
- 5.2. Argentina
- 5.3. Rest of South America
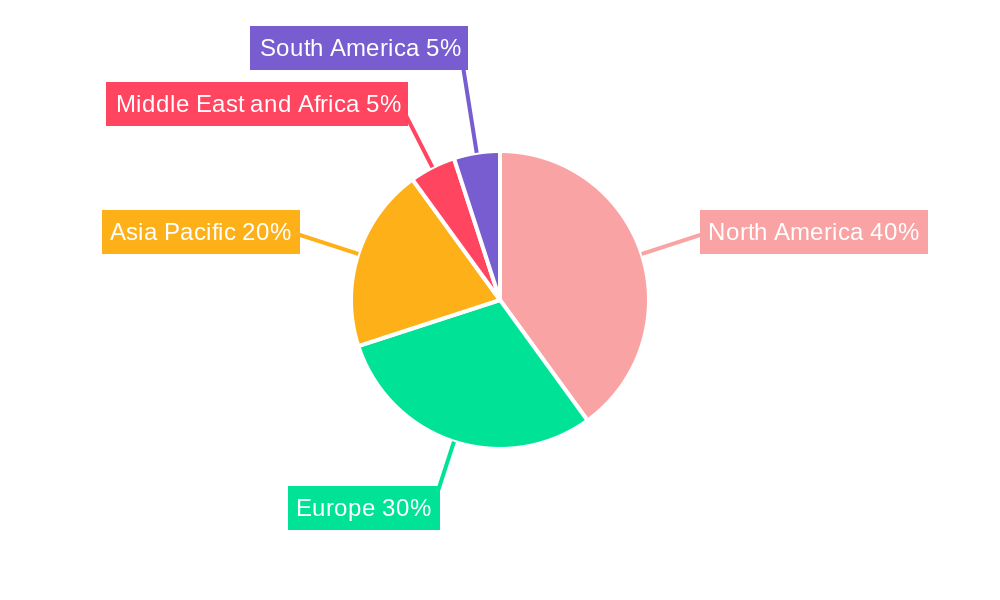
Wearable Injectors Industry Regional Market Share
Geographic Coverage of Wearable Injectors Industry
Wearable Injectors Industry REPORT HIGHLIGHTS
| Aspects | Details |
|---|---|
| Study Period | 2020-2034 |
| Base Year | 2025 |
| Estimated Year | 2026 |
| Forecast Period | 2026-2034 |
| Historical Period | 2020-2025 |
| Growth Rate | CAGR of 10.6% from 2020-2034 |
| Segmentation |
|
Table of Contents
- 1. Introduction
- 1.1. Research Scope
- 1.2. Market Segmentation
- 1.3. Research Methodology
- 1.4. Definitions and Assumptions
- 2. Executive Summary
- 2.1. Introduction
- 3. Market Dynamics
- 3.1. Introduction
- 3.2. Market Drivers
- 3.2.1. Growing Prevalence of Chronic Diseases; Technological Advancements; Increasing Concern over the Hazards and Limitations Related to Needle stick
- 3.3. Market Restrains
- 3.3.1. Preference for Alternative Drug Delivery Modes; Unfavorable Reimbursement Structure in Developing Countries
- 3.4. Market Trends
- 3.4.1. Oncology Segment is Expected to Hold Significant Market Share Over the Forecast Period
- 4. Market Factor Analysis
- 4.1. Porters Five Forces
- 4.2. Supply/Value Chain
- 4.3. PESTEL analysis
- 4.4. Market Entropy
- 4.5. Patent/Trademark Analysis
- 5. Global Wearable Injectors Industry Analysis, Insights and Forecast, 2020-2032
- 5.1. Market Analysis, Insights and Forecast - by Type
- 5.1.1. On-Body Injectors
- 5.1.2. Off-Body Injectors
- 5.2. Market Analysis, Insights and Forecast - by Therapy
- 5.2.1. Oncology
- 5.2.2. Autoimmune Disease
- 5.2.3. Diabetes
- 5.2.4. Cardiovascular Disease
- 5.2.5. Others
- 5.3. Market Analysis, Insights and Forecast - by End User
- 5.3.1. Hospitals and Clinics
- 5.3.2. Home Care
- 5.3.3. Others
- 5.4. Market Analysis, Insights and Forecast - by Region
- 5.4.1. North America
- 5.4.2. Europe
- 5.4.3. Asia Pacific
- 5.4.4. Middle East and Africa
- 5.4.5. South America
- 5.1. Market Analysis, Insights and Forecast - by Type
- 6. North America Wearable Injectors Industry Analysis, Insights and Forecast, 2020-2032
- 6.1. Market Analysis, Insights and Forecast - by Type
- 6.1.1. On-Body Injectors
- 6.1.2. Off-Body Injectors
- 6.2. Market Analysis, Insights and Forecast - by Therapy
- 6.2.1. Oncology
- 6.2.2. Autoimmune Disease
- 6.2.3. Diabetes
- 6.2.4. Cardiovascular Disease
- 6.2.5. Others
- 6.3. Market Analysis, Insights and Forecast - by End User
- 6.3.1. Hospitals and Clinics
- 6.3.2. Home Care
- 6.3.3. Others
- 6.1. Market Analysis, Insights and Forecast - by Type
- 7. Europe Wearable Injectors Industry Analysis, Insights and Forecast, 2020-2032
- 7.1. Market Analysis, Insights and Forecast - by Type
- 7.1.1. On-Body Injectors
- 7.1.2. Off-Body Injectors
- 7.2. Market Analysis, Insights and Forecast - by Therapy
- 7.2.1. Oncology
- 7.2.2. Autoimmune Disease
- 7.2.3. Diabetes
- 7.2.4. Cardiovascular Disease
- 7.2.5. Others
- 7.3. Market Analysis, Insights and Forecast - by End User
- 7.3.1. Hospitals and Clinics
- 7.3.2. Home Care
- 7.3.3. Others
- 7.1. Market Analysis, Insights and Forecast - by Type
- 8. Asia Pacific Wearable Injectors Industry Analysis, Insights and Forecast, 2020-2032
- 8.1. Market Analysis, Insights and Forecast - by Type
- 8.1.1. On-Body Injectors
- 8.1.2. Off-Body Injectors
- 8.2. Market Analysis, Insights and Forecast - by Therapy
- 8.2.1. Oncology
- 8.2.2. Autoimmune Disease
- 8.2.3. Diabetes
- 8.2.4. Cardiovascular Disease
- 8.2.5. Others
- 8.3. Market Analysis, Insights and Forecast - by End User
- 8.3.1. Hospitals and Clinics
- 8.3.2. Home Care
- 8.3.3. Others
- 8.1. Market Analysis, Insights and Forecast - by Type
- 9. Middle East and Africa Wearable Injectors Industry Analysis, Insights and Forecast, 2020-2032
- 9.1. Market Analysis, Insights and Forecast - by Type
- 9.1.1. On-Body Injectors
- 9.1.2. Off-Body Injectors
- 9.2. Market Analysis, Insights and Forecast - by Therapy
- 9.2.1. Oncology
- 9.2.2. Autoimmune Disease
- 9.2.3. Diabetes
- 9.2.4. Cardiovascular Disease
- 9.2.5. Others
- 9.3. Market Analysis, Insights and Forecast - by End User
- 9.3.1. Hospitals and Clinics
- 9.3.2. Home Care
- 9.3.3. Others
- 9.1. Market Analysis, Insights and Forecast - by Type
- 10. South America Wearable Injectors Industry Analysis, Insights and Forecast, 2020-2032
- 10.1. Market Analysis, Insights and Forecast - by Type
- 10.1.1. On-Body Injectors
- 10.1.2. Off-Body Injectors
- 10.2. Market Analysis, Insights and Forecast - by Therapy
- 10.2.1. Oncology
- 10.2.2. Autoimmune Disease
- 10.2.3. Diabetes
- 10.2.4. Cardiovascular Disease
- 10.2.5. Others
- 10.3. Market Analysis, Insights and Forecast - by End User
- 10.3.1. Hospitals and Clinics
- 10.3.2. Home Care
- 10.3.3. Others
- 10.1. Market Analysis, Insights and Forecast - by Type
- 11. Competitive Analysis
- 11.1. Global Market Share Analysis 2025
- 11.2. Company Profiles
- 11.2.1 Becton Dickinson and Company
- 11.2.1.1. Overview
- 11.2.1.2. Products
- 11.2.1.3. SWOT Analysis
- 11.2.1.4. Recent Developments
- 11.2.1.5. Financials (Based on Availability)
- 11.2.2 West Pharmaceutical Services inc
- 11.2.2.1. Overview
- 11.2.2.2. Products
- 11.2.2.3. SWOT Analysis
- 11.2.2.4. Recent Developments
- 11.2.2.5. Financials (Based on Availability)
- 11.2.3 Ypsomed
- 11.2.3.1. Overview
- 11.2.3.2. Products
- 11.2.3.3. SWOT Analysis
- 11.2.3.4. Recent Developments
- 11.2.3.5. Financials (Based on Availability)
- 11.2.4 Buhler motor gmbh
- 11.2.4.1. Overview
- 11.2.4.2. Products
- 11.2.4.3. SWOT Analysis
- 11.2.4.4. Recent Developments
- 11.2.4.5. Financials (Based on Availability)
- 11.2.5 Amgen Inc
- 11.2.5.1. Overview
- 11.2.5.2. Products
- 11.2.5.3. SWOT Analysis
- 11.2.5.4. Recent Developments
- 11.2.5.5. Financials (Based on Availability)
- 11.2.6 Sensile Medical
- 11.2.6.1. Overview
- 11.2.6.2. Products
- 11.2.6.3. SWOT Analysis
- 11.2.6.4. Recent Developments
- 11.2.6.5. Financials (Based on Availability)
- 11.2.7 Dexcom Inc
- 11.2.7.1. Overview
- 11.2.7.2. Products
- 11.2.7.3. SWOT Analysis
- 11.2.7.4. Recent Developments
- 11.2.7.5. Financials (Based on Availability)
- 11.2.8 Insulet Corporation
- 11.2.8.1. Overview
- 11.2.8.2. Products
- 11.2.8.3. SWOT Analysis
- 11.2.8.4. Recent Developments
- 11.2.8.5. Financials (Based on Availability)
- 11.2.9 Tandem Diabetes Care Inc
- 11.2.9.1. Overview
- 11.2.9.2. Products
- 11.2.9.3. SWOT Analysis
- 11.2.9.4. Recent Developments
- 11.2.9.5. Financials (Based on Availability)
- 11.2.10 Eitan Medical
- 11.2.10.1. Overview
- 11.2.10.2. Products
- 11.2.10.3. SWOT Analysis
- 11.2.10.4. Recent Developments
- 11.2.10.5. Financials (Based on Availability)
- 11.2.11 Stevanato Group
- 11.2.11.1. Overview
- 11.2.11.2. Products
- 11.2.11.3. SWOT Analysis
- 11.2.11.4. Recent Developments
- 11.2.11.5. Financials (Based on Availability)
- 11.2.12 Enable Injections
- 11.2.12.1. Overview
- 11.2.12.2. Products
- 11.2.12.3. SWOT Analysis
- 11.2.12.4. Recent Developments
- 11.2.12.5. Financials (Based on Availability)
- 11.2.13 United Therapeutics (Steadymed Therapeutics)
- 11.2.13.1. Overview
- 11.2.13.2. Products
- 11.2.13.3. SWOT Analysis
- 11.2.13.4. Recent Developments
- 11.2.13.5. Financials (Based on Availability)
- 11.2.1 Becton Dickinson and Company
List of Figures
- Figure 1: Global Wearable Injectors Industry Revenue Breakdown (billion, %) by Region 2025 & 2033
- Figure 2: Global Wearable Injectors Industry Volume Breakdown (K Unit, %) by Region 2025 & 2033
- Figure 3: North America Wearable Injectors Industry Revenue (billion), by Type 2025 & 2033
- Figure 4: North America Wearable Injectors Industry Volume (K Unit), by Type 2025 & 2033
- Figure 5: North America Wearable Injectors Industry Revenue Share (%), by Type 2025 & 2033
- Figure 6: North America Wearable Injectors Industry Volume Share (%), by Type 2025 & 2033
- Figure 7: North America Wearable Injectors Industry Revenue (billion), by Therapy 2025 & 2033
- Figure 8: North America Wearable Injectors Industry Volume (K Unit), by Therapy 2025 & 2033
- Figure 9: North America Wearable Injectors Industry Revenue Share (%), by Therapy 2025 & 2033
- Figure 10: North America Wearable Injectors Industry Volume Share (%), by Therapy 2025 & 2033
- Figure 11: North America Wearable Injectors Industry Revenue (billion), by End User 2025 & 2033
- Figure 12: North America Wearable Injectors Industry Volume (K Unit), by End User 2025 & 2033
- Figure 13: North America Wearable Injectors Industry Revenue Share (%), by End User 2025 & 2033
- Figure 14: North America Wearable Injectors Industry Volume Share (%), by End User 2025 & 2033
- Figure 15: North America Wearable Injectors Industry Revenue (billion), by Country 2025 & 2033
- Figure 16: North America Wearable Injectors Industry Volume (K Unit), by Country 2025 & 2033
- Figure 17: North America Wearable Injectors Industry Revenue Share (%), by Country 2025 & 2033
- Figure 18: North America Wearable Injectors Industry Volume Share (%), by Country 2025 & 2033
- Figure 19: Europe Wearable Injectors Industry Revenue (billion), by Type 2025 & 2033
- Figure 20: Europe Wearable Injectors Industry Volume (K Unit), by Type 2025 & 2033
- Figure 21: Europe Wearable Injectors Industry Revenue Share (%), by Type 2025 & 2033
- Figure 22: Europe Wearable Injectors Industry Volume Share (%), by Type 2025 & 2033
- Figure 23: Europe Wearable Injectors Industry Revenue (billion), by Therapy 2025 & 2033
- Figure 24: Europe Wearable Injectors Industry Volume (K Unit), by Therapy 2025 & 2033
- Figure 25: Europe Wearable Injectors Industry Revenue Share (%), by Therapy 2025 & 2033
- Figure 26: Europe Wearable Injectors Industry Volume Share (%), by Therapy 2025 & 2033
- Figure 27: Europe Wearable Injectors Industry Revenue (billion), by End User 2025 & 2033
- Figure 28: Europe Wearable Injectors Industry Volume (K Unit), by End User 2025 & 2033
- Figure 29: Europe Wearable Injectors Industry Revenue Share (%), by End User 2025 & 2033
- Figure 30: Europe Wearable Injectors Industry Volume Share (%), by End User 2025 & 2033
- Figure 31: Europe Wearable Injectors Industry Revenue (billion), by Country 2025 & 2033
- Figure 32: Europe Wearable Injectors Industry Volume (K Unit), by Country 2025 & 2033
- Figure 33: Europe Wearable Injectors Industry Revenue Share (%), by Country 2025 & 2033
- Figure 34: Europe Wearable Injectors Industry Volume Share (%), by Country 2025 & 2033
- Figure 35: Asia Pacific Wearable Injectors Industry Revenue (billion), by Type 2025 & 2033
- Figure 36: Asia Pacific Wearable Injectors Industry Volume (K Unit), by Type 2025 & 2033
- Figure 37: Asia Pacific Wearable Injectors Industry Revenue Share (%), by Type 2025 & 2033
- Figure 38: Asia Pacific Wearable Injectors Industry Volume Share (%), by Type 2025 & 2033
- Figure 39: Asia Pacific Wearable Injectors Industry Revenue (billion), by Therapy 2025 & 2033
- Figure 40: Asia Pacific Wearable Injectors Industry Volume (K Unit), by Therapy 2025 & 2033
- Figure 41: Asia Pacific Wearable Injectors Industry Revenue Share (%), by Therapy 2025 & 2033
- Figure 42: Asia Pacific Wearable Injectors Industry Volume Share (%), by Therapy 2025 & 2033
- Figure 43: Asia Pacific Wearable Injectors Industry Revenue (billion), by End User 2025 & 2033
- Figure 44: Asia Pacific Wearable Injectors Industry Volume (K Unit), by End User 2025 & 2033
- Figure 45: Asia Pacific Wearable Injectors Industry Revenue Share (%), by End User 2025 & 2033
- Figure 46: Asia Pacific Wearable Injectors Industry Volume Share (%), by End User 2025 & 2033
- Figure 47: Asia Pacific Wearable Injectors Industry Revenue (billion), by Country 2025 & 2033
- Figure 48: Asia Pacific Wearable Injectors Industry Volume (K Unit), by Country 2025 & 2033
- Figure 49: Asia Pacific Wearable Injectors Industry Revenue Share (%), by Country 2025 & 2033
- Figure 50: Asia Pacific Wearable Injectors Industry Volume Share (%), by Country 2025 & 2033
- Figure 51: Middle East and Africa Wearable Injectors Industry Revenue (billion), by Type 2025 & 2033
- Figure 52: Middle East and Africa Wearable Injectors Industry Volume (K Unit), by Type 2025 & 2033
- Figure 53: Middle East and Africa Wearable Injectors Industry Revenue Share (%), by Type 2025 & 2033
- Figure 54: Middle East and Africa Wearable Injectors Industry Volume Share (%), by Type 2025 & 2033
- Figure 55: Middle East and Africa Wearable Injectors Industry Revenue (billion), by Therapy 2025 & 2033
- Figure 56: Middle East and Africa Wearable Injectors Industry Volume (K Unit), by Therapy 2025 & 2033
- Figure 57: Middle East and Africa Wearable Injectors Industry Revenue Share (%), by Therapy 2025 & 2033
- Figure 58: Middle East and Africa Wearable Injectors Industry Volume Share (%), by Therapy 2025 & 2033
- Figure 59: Middle East and Africa Wearable Injectors Industry Revenue (billion), by End User 2025 & 2033
- Figure 60: Middle East and Africa Wearable Injectors Industry Volume (K Unit), by End User 2025 & 2033
- Figure 61: Middle East and Africa Wearable Injectors Industry Revenue Share (%), by End User 2025 & 2033
- Figure 62: Middle East and Africa Wearable Injectors Industry Volume Share (%), by End User 2025 & 2033
- Figure 63: Middle East and Africa Wearable Injectors Industry Revenue (billion), by Country 2025 & 2033
- Figure 64: Middle East and Africa Wearable Injectors Industry Volume (K Unit), by Country 2025 & 2033
- Figure 65: Middle East and Africa Wearable Injectors Industry Revenue Share (%), by Country 2025 & 2033
- Figure 66: Middle East and Africa Wearable Injectors Industry Volume Share (%), by Country 2025 & 2033
- Figure 67: South America Wearable Injectors Industry Revenue (billion), by Type 2025 & 2033
- Figure 68: South America Wearable Injectors Industry Volume (K Unit), by Type 2025 & 2033
- Figure 69: South America Wearable Injectors Industry Revenue Share (%), by Type 2025 & 2033
- Figure 70: South America Wearable Injectors Industry Volume Share (%), by Type 2025 & 2033
- Figure 71: South America Wearable Injectors Industry Revenue (billion), by Therapy 2025 & 2033
- Figure 72: South America Wearable Injectors Industry Volume (K Unit), by Therapy 2025 & 2033
- Figure 73: South America Wearable Injectors Industry Revenue Share (%), by Therapy 2025 & 2033
- Figure 74: South America Wearable Injectors Industry Volume Share (%), by Therapy 2025 & 2033
- Figure 75: South America Wearable Injectors Industry Revenue (billion), by End User 2025 & 2033
- Figure 76: South America Wearable Injectors Industry Volume (K Unit), by End User 2025 & 2033
- Figure 77: South America Wearable Injectors Industry Revenue Share (%), by End User 2025 & 2033
- Figure 78: South America Wearable Injectors Industry Volume Share (%), by End User 2025 & 2033
- Figure 79: South America Wearable Injectors Industry Revenue (billion), by Country 2025 & 2033
- Figure 80: South America Wearable Injectors Industry Volume (K Unit), by Country 2025 & 2033
- Figure 81: South America Wearable Injectors Industry Revenue Share (%), by Country 2025 & 2033
- Figure 82: South America Wearable Injectors Industry Volume Share (%), by Country 2025 & 2033
List of Tables
- Table 1: Global Wearable Injectors Industry Revenue billion Forecast, by Type 2020 & 2033
- Table 2: Global Wearable Injectors Industry Volume K Unit Forecast, by Type 2020 & 2033
- Table 3: Global Wearable Injectors Industry Revenue billion Forecast, by Therapy 2020 & 2033
- Table 4: Global Wearable Injectors Industry Volume K Unit Forecast, by Therapy 2020 & 2033
- Table 5: Global Wearable Injectors Industry Revenue billion Forecast, by End User 2020 & 2033
- Table 6: Global Wearable Injectors Industry Volume K Unit Forecast, by End User 2020 & 2033
- Table 7: Global Wearable Injectors Industry Revenue billion Forecast, by Region 2020 & 2033
- Table 8: Global Wearable Injectors Industry Volume K Unit Forecast, by Region 2020 & 2033
- Table 9: Global Wearable Injectors Industry Revenue billion Forecast, by Type 2020 & 2033
- Table 10: Global Wearable Injectors Industry Volume K Unit Forecast, by Type 2020 & 2033
- Table 11: Global Wearable Injectors Industry Revenue billion Forecast, by Therapy 2020 & 2033
- Table 12: Global Wearable Injectors Industry Volume K Unit Forecast, by Therapy 2020 & 2033
- Table 13: Global Wearable Injectors Industry Revenue billion Forecast, by End User 2020 & 2033
- Table 14: Global Wearable Injectors Industry Volume K Unit Forecast, by End User 2020 & 2033
- Table 15: Global Wearable Injectors Industry Revenue billion Forecast, by Country 2020 & 2033
- Table 16: Global Wearable Injectors Industry Volume K Unit Forecast, by Country 2020 & 2033
- Table 17: United States Wearable Injectors Industry Revenue (billion) Forecast, by Application 2020 & 2033
- Table 18: United States Wearable Injectors Industry Volume (K Unit) Forecast, by Application 2020 & 2033
- Table 19: Canada Wearable Injectors Industry Revenue (billion) Forecast, by Application 2020 & 2033
- Table 20: Canada Wearable Injectors Industry Volume (K Unit) Forecast, by Application 2020 & 2033
- Table 21: Mexico Wearable Injectors Industry Revenue (billion) Forecast, by Application 2020 & 2033
- Table 22: Mexico Wearable Injectors Industry Volume (K Unit) Forecast, by Application 2020 & 2033
- Table 23: Global Wearable Injectors Industry Revenue billion Forecast, by Type 2020 & 2033
- Table 24: Global Wearable Injectors Industry Volume K Unit Forecast, by Type 2020 & 2033
- Table 25: Global Wearable Injectors Industry Revenue billion Forecast, by Therapy 2020 & 2033
- Table 26: Global Wearable Injectors Industry Volume K Unit Forecast, by Therapy 2020 & 2033
- Table 27: Global Wearable Injectors Industry Revenue billion Forecast, by End User 2020 & 2033
- Table 28: Global Wearable Injectors Industry Volume K Unit Forecast, by End User 2020 & 2033
- Table 29: Global Wearable Injectors Industry Revenue billion Forecast, by Country 2020 & 2033
- Table 30: Global Wearable Injectors Industry Volume K Unit Forecast, by Country 2020 & 2033
- Table 31: Germany Wearable Injectors Industry Revenue (billion) Forecast, by Application 2020 & 2033
- Table 32: Germany Wearable Injectors Industry Volume (K Unit) Forecast, by Application 2020 & 2033
- Table 33: United Kingdom Wearable Injectors Industry Revenue (billion) Forecast, by Application 2020 & 2033
- Table 34: United Kingdom Wearable Injectors Industry Volume (K Unit) Forecast, by Application 2020 & 2033
- Table 35: France Wearable Injectors Industry Revenue (billion) Forecast, by Application 2020 & 2033
- Table 36: France Wearable Injectors Industry Volume (K Unit) Forecast, by Application 2020 & 2033
- Table 37: Italy Wearable Injectors Industry Revenue (billion) Forecast, by Application 2020 & 2033
- Table 38: Italy Wearable Injectors Industry Volume (K Unit) Forecast, by Application 2020 & 2033
- Table 39: Spain Wearable Injectors Industry Revenue (billion) Forecast, by Application 2020 & 2033
- Table 40: Spain Wearable Injectors Industry Volume (K Unit) Forecast, by Application 2020 & 2033
- Table 41: Rest of Europe Wearable Injectors Industry Revenue (billion) Forecast, by Application 2020 & 2033
- Table 42: Rest of Europe Wearable Injectors Industry Volume (K Unit) Forecast, by Application 2020 & 2033
- Table 43: Global Wearable Injectors Industry Revenue billion Forecast, by Type 2020 & 2033
- Table 44: Global Wearable Injectors Industry Volume K Unit Forecast, by Type 2020 & 2033
- Table 45: Global Wearable Injectors Industry Revenue billion Forecast, by Therapy 2020 & 2033
- Table 46: Global Wearable Injectors Industry Volume K Unit Forecast, by Therapy 2020 & 2033
- Table 47: Global Wearable Injectors Industry Revenue billion Forecast, by End User 2020 & 2033
- Table 48: Global Wearable Injectors Industry Volume K Unit Forecast, by End User 2020 & 2033
- Table 49: Global Wearable Injectors Industry Revenue billion Forecast, by Country 2020 & 2033
- Table 50: Global Wearable Injectors Industry Volume K Unit Forecast, by Country 2020 & 2033
- Table 51: China Wearable Injectors Industry Revenue (billion) Forecast, by Application 2020 & 2033
- Table 52: China Wearable Injectors Industry Volume (K Unit) Forecast, by Application 2020 & 2033
- Table 53: Japan Wearable Injectors Industry Revenue (billion) Forecast, by Application 2020 & 2033
- Table 54: Japan Wearable Injectors Industry Volume (K Unit) Forecast, by Application 2020 & 2033
- Table 55: India Wearable Injectors Industry Revenue (billion) Forecast, by Application 2020 & 2033
- Table 56: India Wearable Injectors Industry Volume (K Unit) Forecast, by Application 2020 & 2033
- Table 57: Australia Wearable Injectors Industry Revenue (billion) Forecast, by Application 2020 & 2033
- Table 58: Australia Wearable Injectors Industry Volume (K Unit) Forecast, by Application 2020 & 2033
- Table 59: South Korea Wearable Injectors Industry Revenue (billion) Forecast, by Application 2020 & 2033
- Table 60: South Korea Wearable Injectors Industry Volume (K Unit) Forecast, by Application 2020 & 2033
- Table 61: Rest of Asia Pacific Wearable Injectors Industry Revenue (billion) Forecast, by Application 2020 & 2033
- Table 62: Rest of Asia Pacific Wearable Injectors Industry Volume (K Unit) Forecast, by Application 2020 & 2033
- Table 63: Global Wearable Injectors Industry Revenue billion Forecast, by Type 2020 & 2033
- Table 64: Global Wearable Injectors Industry Volume K Unit Forecast, by Type 2020 & 2033
- Table 65: Global Wearable Injectors Industry Revenue billion Forecast, by Therapy 2020 & 2033
- Table 66: Global Wearable Injectors Industry Volume K Unit Forecast, by Therapy 2020 & 2033
- Table 67: Global Wearable Injectors Industry Revenue billion Forecast, by End User 2020 & 2033
- Table 68: Global Wearable Injectors Industry Volume K Unit Forecast, by End User 2020 & 2033
- Table 69: Global Wearable Injectors Industry Revenue billion Forecast, by Country 2020 & 2033
- Table 70: Global Wearable Injectors Industry Volume K Unit Forecast, by Country 2020 & 2033
- Table 71: GCC Wearable Injectors Industry Revenue (billion) Forecast, by Application 2020 & 2033
- Table 72: GCC Wearable Injectors Industry Volume (K Unit) Forecast, by Application 2020 & 2033
- Table 73: South Africa Wearable Injectors Industry Revenue (billion) Forecast, by Application 2020 & 2033
- Table 74: South Africa Wearable Injectors Industry Volume (K Unit) Forecast, by Application 2020 & 2033
- Table 75: Rest of Middle East and Africa Wearable Injectors Industry Revenue (billion) Forecast, by Application 2020 & 2033
- Table 76: Rest of Middle East and Africa Wearable Injectors Industry Volume (K Unit) Forecast, by Application 2020 & 2033
- Table 77: Global Wearable Injectors Industry Revenue billion Forecast, by Type 2020 & 2033
- Table 78: Global Wearable Injectors Industry Volume K Unit Forecast, by Type 2020 & 2033
- Table 79: Global Wearable Injectors Industry Revenue billion Forecast, by Therapy 2020 & 2033
- Table 80: Global Wearable Injectors Industry Volume K Unit Forecast, by Therapy 2020 & 2033
- Table 81: Global Wearable Injectors Industry Revenue billion Forecast, by End User 2020 & 2033
- Table 82: Global Wearable Injectors Industry Volume K Unit Forecast, by End User 2020 & 2033
- Table 83: Global Wearable Injectors Industry Revenue billion Forecast, by Country 2020 & 2033
- Table 84: Global Wearable Injectors Industry Volume K Unit Forecast, by Country 2020 & 2033
- Table 85: Brazil Wearable Injectors Industry Revenue (billion) Forecast, by Application 2020 & 2033
- Table 86: Brazil Wearable Injectors Industry Volume (K Unit) Forecast, by Application 2020 & 2033
- Table 87: Argentina Wearable Injectors Industry Revenue (billion) Forecast, by Application 2020 & 2033
- Table 88: Argentina Wearable Injectors Industry Volume (K Unit) Forecast, by Application 2020 & 2033
- Table 89: Rest of South America Wearable Injectors Industry Revenue (billion) Forecast, by Application 2020 & 2033
- Table 90: Rest of South America Wearable Injectors Industry Volume (K Unit) Forecast, by Application 2020 & 2033
Frequently Asked Questions
1. What is the projected Compound Annual Growth Rate (CAGR) of the Wearable Injectors Industry?
The projected CAGR is approximately 10.6%.
2. Which companies are prominent players in the Wearable Injectors Industry?
Key companies in the market include Becton Dickinson and Company, West Pharmaceutical Services inc, Ypsomed, Buhler motor gmbh, Amgen Inc, Sensile Medical, Dexcom Inc, Insulet Corporation, Tandem Diabetes Care Inc, Eitan Medical, Stevanato Group, Enable Injections, United Therapeutics (Steadymed Therapeutics).
3. What are the main segments of the Wearable Injectors Industry?
The market segments include Type, Therapy, End User.
4. Can you provide details about the market size?
The market size is estimated to be USD 10.1 billion as of 2022.
5. What are some drivers contributing to market growth?
Growing Prevalence of Chronic Diseases; Technological Advancements; Increasing Concern over the Hazards and Limitations Related to Needle stick.
6. What are the notable trends driving market growth?
Oncology Segment is Expected to Hold Significant Market Share Over the Forecast Period.
7. Are there any restraints impacting market growth?
Preference for Alternative Drug Delivery Modes; Unfavorable Reimbursement Structure in Developing Countries.
8. Can you provide examples of recent developments in the market?
June 2022: AbbVie received US FDA approval for SKYRIZI (risankizumab-rzaa) as the first and only specific interleukin-23 (IL-23) inhibitor for the treatment of adults with moderately to severely active Crohn's disease (CD). It can be self-administered by Subcutaneous Injection (SC) with an On-Body Injector (OBI).
9. What pricing options are available for accessing the report?
Pricing options include single-user, multi-user, and enterprise licenses priced at USD 4750, USD 5250, and USD 8750 respectively.
10. Is the market size provided in terms of value or volume?
The market size is provided in terms of value, measured in billion and volume, measured in K Unit.
11. Are there any specific market keywords associated with the report?
Yes, the market keyword associated with the report is "Wearable Injectors Industry," which aids in identifying and referencing the specific market segment covered.
12. How do I determine which pricing option suits my needs best?
The pricing options vary based on user requirements and access needs. Individual users may opt for single-user licenses, while businesses requiring broader access may choose multi-user or enterprise licenses for cost-effective access to the report.
13. Are there any additional resources or data provided in the Wearable Injectors Industry report?
While the report offers comprehensive insights, it's advisable to review the specific contents or supplementary materials provided to ascertain if additional resources or data are available.
14. How can I stay updated on further developments or reports in the Wearable Injectors Industry?
To stay informed about further developments, trends, and reports in the Wearable Injectors Industry, consider subscribing to industry newsletters, following relevant companies and organizations, or regularly checking reputable industry news sources and publications.
Methodology
Step 1 - Identification of Relevant Samples Size from Population Database


Step 2 - Approaches for Defining Global Market Size (Value, Volume* & Price*)

Note*: In applicable scenarios
Step 3 - Data Sources
Primary Research
- Web Analytics
- Survey Reports
- Research Institute
- Latest Research Reports
- Opinion Leaders
Secondary Research
- Annual Reports
- White Paper
- Latest Press Release
- Industry Association
- Paid Database
- Investor Presentations

Step 4 - Data Triangulation
Involves using different sources of information in order to increase the validity of a study
These sources are likely to be stakeholders in a program - participants, other researchers, program staff, other community members, and so on.
Then we put all data in single framework & apply various statistical tools to find out the dynamic on the market.
During the analysis stage, feedback from the stakeholder groups would be compared to determine areas of agreement as well as areas of divergence