

Key Insights
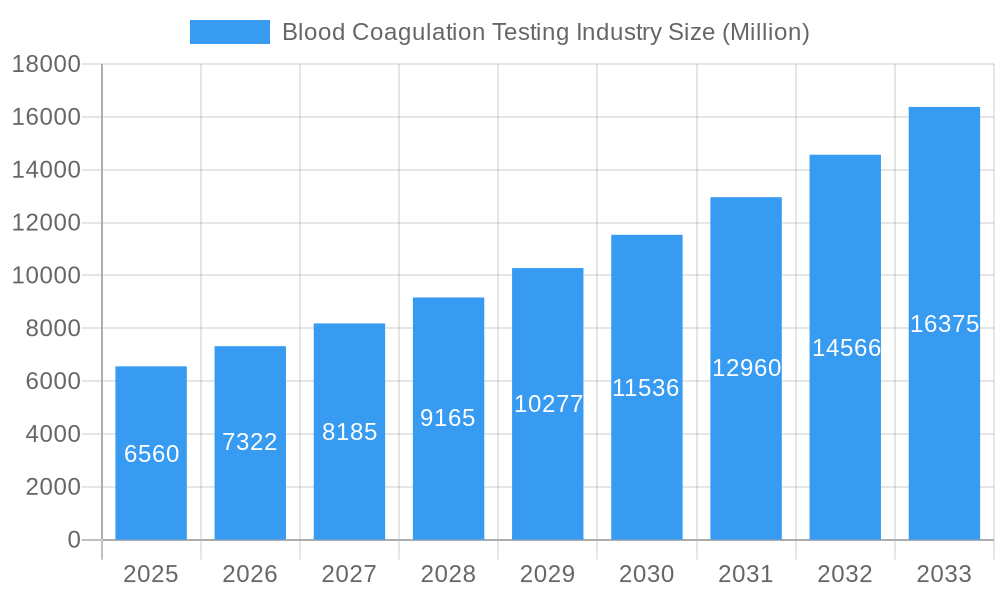
The global Blood Coagulation Testing market is poised for significant expansion, projected to reach an estimated USD 6.56 billion by 2025. This robust growth is underpinned by a compelling CAGR of 11.6% throughout the forecast period of 2025-2033. Several critical factors are driving this upward trajectory, including the increasing prevalence of cardiovascular diseases and bleeding disorders, a growing aging population susceptible to these conditions, and advancements in diagnostic technologies leading to more accurate and rapid testing. The rising awareness among healthcare professionals and patients regarding the importance of early detection and management of coagulation disorders further fuels market demand. Moreover, the expanding adoption of point-of-care testing (POCT) systems, offering convenience and faster results, is a significant catalyst for market penetration, particularly in decentralized healthcare settings.
Blood Coagulation Testing Industry Market Size (In Billion)
The market is characterized by a diverse range of applications, with Laboratory Analyzers, especially automated systems, dominating the product segment due to their high throughput and precision. Point-of-Care Testing Systems are witnessing rapid adoption, driven by the need for immediate patient management. Key tests like Activated Partial Thromboplastin Time (aPTT), D-Dimer, Fibrinogen, and Prothrombin Time (PT) are integral to diagnosing and monitoring a spectrum of coagulation-related conditions. Hospitals and diagnostic centers represent the largest end-user segments, leveraging these tests for patient care and clinical decision-making. Geographically, North America is expected to lead the market, followed by Europe and the rapidly growing Asia Pacific region, which benefits from increasing healthcare investments and an expanding patient base. Restraints such as stringent regulatory approvals and the high cost of advanced instrumentation are present, but the overriding drivers of technological innovation and growing healthcare needs are expected to propel the market forward.
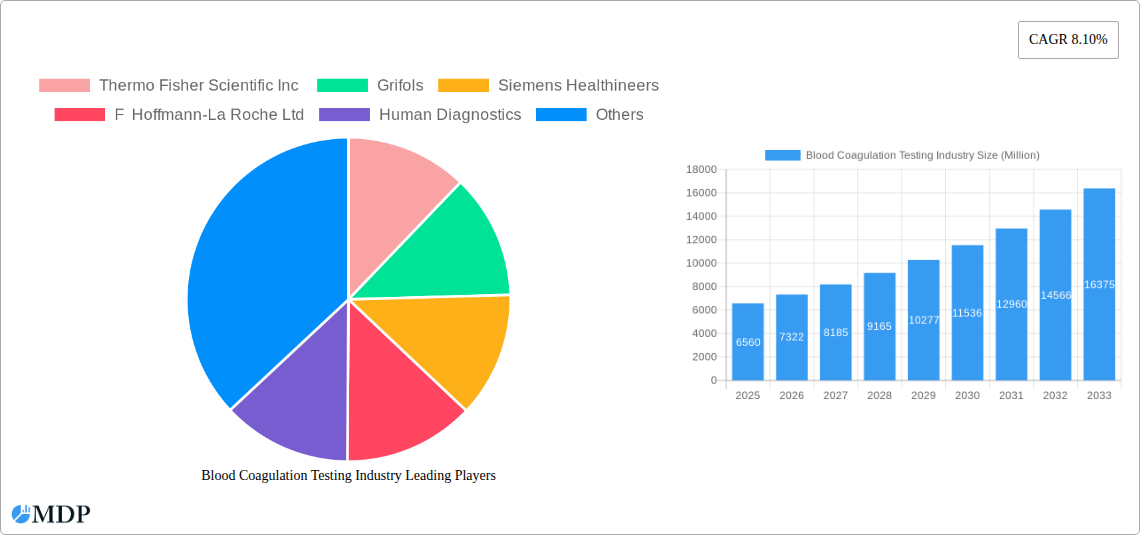
Blood Coagulation Testing Industry Company Market Share
Blood Coagulation Testing Industry: Market Analysis, Trends, and Growth Opportunities (2019-2033)
This comprehensive report provides an in-depth analysis of the global blood coagulation testing market, a critical segment within the in-vitro diagnostics (IVD) industry. Covering the historical period from 2019 to 2024 and projecting forward to 2033, with a base year of 2025, this study offers unparalleled insights into market dynamics, technological advancements, key players, and future growth trajectories. Discover how hemostasis testing, including PT/INR testing, D-dimer testing, and thrombophilia testing, is revolutionizing patient care across hospitals, diagnostic centers, and emerging point-of-care settings. With an estimated market size poised for significant expansion, this report is essential for stakeholders seeking to capitalize on the burgeoning opportunities in blood coagulation diagnostics.
Blood Coagulation Testing Industry Market Dynamics & Concentration
The global blood coagulation testing market is characterized by a moderate to high concentration, with key players like Thermo Fisher Scientific Inc., Grifols, Siemens Healthineers, F Hoffmann-La Roche Ltd, Abbott, and Sysmex Corporation dominating market share. In 2025, these leading companies are projected to collectively hold over 60% of the market. Innovation remains a primary driver, fueled by the ongoing demand for faster, more accurate, and user-friendly diagnostic solutions. Regulatory frameworks, particularly those from the FDA and EMA, play a significant role in shaping product development and market entry, ensuring patient safety and efficacy. While direct product substitutes are limited, advancements in alternative diagnostic methodologies could pose a long-term threat. End-user trends are shifting towards decentralized testing, with a growing preference for point-of-care solutions. Mergers and acquisitions (M&A) are strategic imperatives for market expansion and portfolio enhancement. The past three years have seen an average of 5-7 significant M&A deals annually, indicating a consolidating market landscape.
- Market Concentration: Moderate to high, with top 5 companies holding over 60% market share in 2025.
- Innovation Drivers: Demand for enhanced accuracy, speed, miniaturization, and automation in hemostasis testing.
- Regulatory Frameworks: Stringent approvals by FDA, EMA, and other regional bodies are critical for market access.
- Product Substitutes: Limited direct substitutes, but potential for emerging alternative diagnostic technologies.
- End-User Trends: Growing adoption of point-of-care testing (POCT) and home-based monitoring solutions.
- M&A Activities: Active consolidation through strategic acquisitions and partnerships to gain market share and technological expertise.
Blood Coagulation Testing Industry Industry Trends & Analysis
The blood coagulation testing industry is experiencing robust growth, driven by an increasing global prevalence of cardiovascular diseases, thromboembolic disorders, and bleeding disorders, estimated to contribute to an annual market growth rate (CAGR) of approximately 7.2% from 2025 to 2033. This expansion is further bolstered by the rising demand for rapid and accurate diagnostic tools, particularly in emergency settings and for chronic disease management. Technological disruptions are at the forefront, with the development of advanced hemostasis analyzers, including fully automated systems that offer higher throughput and reduced hands-on time. The penetration of these sophisticated laboratory analyzers is steadily increasing in hospitals and large diagnostic centers. Simultaneously, point-of-care testing (POCT) systems are gaining significant traction, enabling immediate diagnostic results at the patient's bedside or in physician offices, thereby improving patient outcomes and reducing healthcare costs. Consumer preferences are evolving, with a growing emphasis on convenience and accessibility, which is propelling the adoption of user-friendly POCT devices. Competitive dynamics within the industry are intense, characterized by continuous product innovation, strategic partnerships, and a focus on expanding market reach. The global market size for blood coagulation testing is projected to surpass USD 8 billion by 2025, with significant growth anticipated in the forecast period.
Leading Markets & Segments in Blood Coagulation Testing Industry
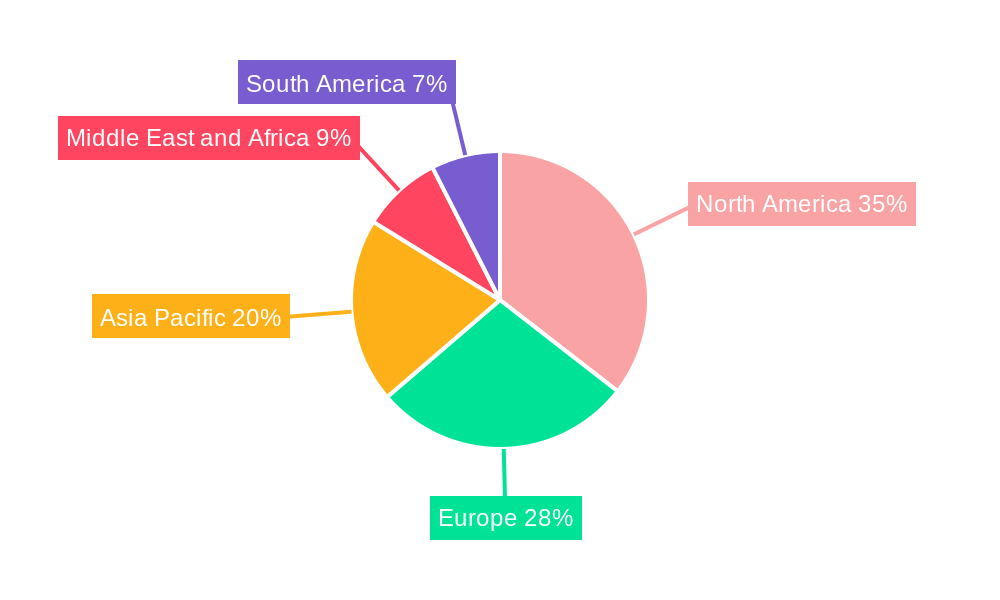
The North America region currently leads the blood coagulation testing market, projected to account for over 35% of the global market share in 2025. This dominance is attributed to a well-established healthcare infrastructure, high per capita healthcare spending, and a strong emphasis on advanced diagnostics. Within North America, the United States is the largest national market, driven by significant investments in R&D and a high prevalence of target diseases.
Product Segment Dominance:
- Laboratory Analyzers: This segment is the largest contributor, expected to hold over 65% of the market in 2025.
- Automated Systems: These represent the most significant sub-segment, driven by their high throughput, accuracy, and efficiency in high-volume laboratories within hospitals and large diagnostic centers.
- Semi-automated Systems: These cater to mid-sized laboratories and offer a balance of performance and cost-effectiveness.
- Manual Systems: While declining, these still hold a niche in smaller labs or for specific, less common tests.
- Point-of-Care Testing Systems: This segment is experiencing the fastest growth, with an anticipated CAGR of over 8.5% during the forecast period. The increasing demand for rapid diagnostics in emergency departments, ICUs, and for remote patient monitoring is fueling this growth.
Test Segment Dominance:
- Prothrombin Time (PT) Test (including INR): This remains the most widely performed coagulation test globally, essential for monitoring anticoagulant therapy and assessing the extrinsic pathway of coagulation. It is projected to hold the largest market share within the test segment.
- Activated Partial Thromboplastin Time (aPTT) Test: Crucial for monitoring unfractionated heparin therapy and assessing the intrinsic pathway, aPTT tests are also a significant revenue generator.
- D-Dimer Test: This test is critical for the diagnosis of deep vein thrombosis (DVT) and pulmonary embolism (PE), and its demand is steadily rising due to increasing incidence of these conditions.
- Fibrinogen Test: Important for assessing bleeding disorders and DIC, fibrinogen testing also contributes significantly to the market.
End User Segment Dominance:
- Hospitals: As the primary healthcare providers, hospitals constitute the largest end-user segment, accounting for over 50% of the market in 2025. They require a comprehensive range of coagulation testing solutions for inpatient and outpatient diagnostics.
- Diagnostic Centers: These independent laboratories are increasingly investing in advanced coagulation analyzers to meet the growing demand for specialized diagnostic services.
- Other End Users: This includes research institutions, clinics, and specialized healthcare facilities, which represent a smaller but growing segment.
Blood Coagulation Testing Industry Product Developments
Product development in the blood coagulation testing industry is rapidly advancing, focusing on enhancing diagnostic capabilities, improving ease of use, and enabling faster turnaround times. Innovations are centered around developing next-generation hemostasis analyzers with integrated software for advanced data analysis and connectivity. The introduction of novel reagents and cartridges is expanding the range of detectable biomarkers, allowing for more precise diagnosis and personalized treatment. For instance, the development of whole-blood analyzers that minimize pre-analytical errors and offer a wider array of clinical indications, like the HemoSonics Quantra Hemostasis System with QStat Cartridge, showcases a significant leap in point-of-care capabilities. These advancements aim to address unmet clinical needs in areas such as sepsis-associated coagulopathy and complex bleeding disorders, providing competitive advantages through superior performance and workflow efficiency.
Key Drivers of Blood Coagulation Testing Industry Growth
The blood coagulation testing industry is propelled by several key growth drivers. The escalating incidence of thrombotic and bleeding disorders, coupled with a growing aging population, significantly increases the demand for routine and specialized coagulation tests. Advances in in-vitro diagnostics (IVD) technology are enabling the development of more sensitive, specific, and rapid testing solutions. Furthermore, the increasing adoption of point-of-care testing (POCT) devices is expanding testing accessibility and improving patient management. Favorable reimbursement policies for diagnostic procedures in various regions also contribute to market expansion. Lastly, the rising awareness among healthcare professionals and patients regarding the importance of timely and accurate coagulation assessment for effective treatment and disease management plays a crucial role.
Challenges in the Blood Coagulation Testing Industry Market
Despite the robust growth, the blood coagulation testing industry faces several challenges. Stringent regulatory hurdles for new product approvals can lead to lengthy development cycles and increased costs. The high cost of advanced hemostasis analyzers and associated reagents can be a barrier to adoption, particularly for smaller laboratories and in price-sensitive emerging markets. Supply chain disruptions and the availability of skilled personnel to operate complex instrumentation also pose significant challenges. Intense competition among market players can lead to price pressures, impacting profitability. Furthermore, the need for continuous innovation and adaptation to evolving clinical guidelines requires significant ongoing investment.
Emerging Opportunities in Blood Coagulation Testing Industry
Emerging opportunities in the blood coagulation testing industry lie in several key areas. The expanding market for point-of-care diagnostics presents a significant growth avenue, driven by the demand for rapid, decentralized testing at the patient's bedside. The development of innovative diagnostic technologies, such as microfluidics and biosensors, promises more portable, cost-effective, and user-friendly testing solutions. Strategic partnerships and collaborations between diagnostic device manufacturers and pharmaceutical companies can accelerate the development of companion diagnostics and personalized medicine approaches. Furthermore, the growing focus on home-based testing for patients with chronic conditions, like hemophilia, opens up new market segments. Expansion into emerging economies with improving healthcare infrastructure also presents substantial long-term growth potential.
Leading Players in the Blood Coagulation Testing Industry Sector
- Thermo Fisher Scientific Inc.
- Grifols
- Siemens Healthineers
- F Hoffmann-La Roche Ltd
- Human Diagnostics
- GE Healthcare
- Danaher Corporation
- NIHON KOHDEN CORPORATION
- Abbott
- Bio-Rad Laboratories
- Sysmex Corporation
- Werfen
Key Milestones in Blood Coagulation Testing Industry Industry
- December 2022: HemoSonics received 510 (k) market clearance from the US FDA for its Quantra Hemostasis System with QStat Cartridge, significantly enhancing its diagnostic capabilities and covering the widest variety of clinical indications for any point-of-care hemostasis analyzer in the US.
- November 2022: Enzyre, a Dutch company, successfully raised USD 11.9 million (EUR 12 million) in Series A funding to develop ambulant diagnostic technology for blood coagulation testing, aiming to empower hemophilia patients with at-home testing solutions.
Strategic Outlook for Blood Coagulation Testing Industry Market
The strategic outlook for the blood coagulation testing industry is highly promising, driven by continuous technological innovation and increasing global demand for accurate hemostasis diagnostics. Key growth accelerators include the expanding adoption of automated and semi-automated laboratory analyzers, alongside the rapid proliferation of point-of-care testing systems, particularly in emerging markets. Strategic investments in research and development to create novel diagnostic assays and devices capable of detecting a wider spectrum of coagulation abnormalities will be crucial. Furthermore, forging strategic alliances and partnerships with healthcare providers, pharmaceutical companies, and research institutions will be vital for market penetration and product development. The trend towards personalized medicine and the increasing focus on early detection and management of thrombotic and bleeding disorders will continue to fuel market expansion, ensuring robust growth in the coming years.
Blood Coagulation Testing Industry Segmentation
-
1. Product
-
1.1. Laboratory Analyzers
- 1.1.1. Automated Systems
- 1.1.2. Semi-automated Systems
- 1.1.3. Manual Systems
- 1.2. Point-of-Care Testing Systems
-
1.1. Laboratory Analyzers
-
2. Test
- 2.1. Activated Partial Thromboplastin Time
- 2.2. D-Dimer Test
- 2.3. Fibrinogen Test
- 2.4. Prothrombin Time (PT) Test
- 2.5. Other Te
-
3. End User
- 3.1. Hospitals
- 3.2. Diagnostic Centers
- 3.3. Other En
Blood Coagulation Testing Industry Segmentation By Geography
-
1. North America
- 1.1. United States
- 1.2. Canada
- 1.3. Mexico
-
2. Europe
- 2.1. Germany
- 2.2. United Kingdom
- 2.3. France
- 2.4. Italy
- 2.5. Spain
- 2.6. Rest of Europe
-
3. Asia Pacific
- 3.1. China
- 3.2. Japan
- 3.3. India
- 3.4. Australia
- 3.5. South Korea
- 3.6. Rest of Asia Pacific
-
4. Middle East and Africa
- 4.1. GCC
- 4.2. South Africa
- 4.3. Rest of Middle East and Africa
-
5. South America
- 5.1. Brazil
- 5.2. Argentina
- 5.3. Rest of South America
Blood Coagulation Testing Industry Regional Market Share
Geographic Coverage of Blood Coagulation Testing Industry
Blood Coagulation Testing Industry REPORT HIGHLIGHTS
| Aspects | Details |
|---|---|
| Study Period | 2020-2034 |
| Base Year | 2025 |
| Estimated Year | 2026 |
| Forecast Period | 2026-2034 |
| Historical Period | 2020-2025 |
| Growth Rate | CAGR of 11.6% from 2020-2034 |
| Segmentation |
|
Table of Contents
- 1. Introduction
- 1.1. Research Scope
- 1.2. Market Segmentation
- 1.3. Research Methodology
- 1.4. Definitions and Assumptions
- 2. Executive Summary
- 2.1. Introduction
- 3. Market Dynamics
- 3.1. Introduction
- 3.2. Market Drivers
- 3.2.1. Rising Incidences of Blood Clotting Disorders; Technological Advancements for Medical Treatment; Rising Adoption of Automated Hemostasis Equipment
- 3.3. Market Restrains
- 3.3.1. Lack of Awareness in Developing Countries; Stringent Government Regulation
- 3.4. Market Trends
- 3.4.1. The Point-of-Care Testing Systems Segment is Expected to Hold a Significant Market Share Over The Forecast Period.
- 4. Market Factor Analysis
- 4.1. Porters Five Forces
- 4.2. Supply/Value Chain
- 4.3. PESTEL analysis
- 4.4. Market Entropy
- 4.5. Patent/Trademark Analysis
- 5. Global Blood Coagulation Testing Industry Analysis, Insights and Forecast, 2020-2032
- 5.1. Market Analysis, Insights and Forecast - by Product
- 5.1.1. Laboratory Analyzers
- 5.1.1.1. Automated Systems
- 5.1.1.2. Semi-automated Systems
- 5.1.1.3. Manual Systems
- 5.1.2. Point-of-Care Testing Systems
- 5.1.1. Laboratory Analyzers
- 5.2. Market Analysis, Insights and Forecast - by Test
- 5.2.1. Activated Partial Thromboplastin Time
- 5.2.2. D-Dimer Test
- 5.2.3. Fibrinogen Test
- 5.2.4. Prothrombin Time (PT) Test
- 5.2.5. Other Te
- 5.3. Market Analysis, Insights and Forecast - by End User
- 5.3.1. Hospitals
- 5.3.2. Diagnostic Centers
- 5.3.3. Other En
- 5.4. Market Analysis, Insights and Forecast - by Region
- 5.4.1. North America
- 5.4.2. Europe
- 5.4.3. Asia Pacific
- 5.4.4. Middle East and Africa
- 5.4.5. South America
- 5.1. Market Analysis, Insights and Forecast - by Product
- 6. North America Blood Coagulation Testing Industry Analysis, Insights and Forecast, 2020-2032
- 6.1. Market Analysis, Insights and Forecast - by Product
- 6.1.1. Laboratory Analyzers
- 6.1.1.1. Automated Systems
- 6.1.1.2. Semi-automated Systems
- 6.1.1.3. Manual Systems
- 6.1.2. Point-of-Care Testing Systems
- 6.1.1. Laboratory Analyzers
- 6.2. Market Analysis, Insights and Forecast - by Test
- 6.2.1. Activated Partial Thromboplastin Time
- 6.2.2. D-Dimer Test
- 6.2.3. Fibrinogen Test
- 6.2.4. Prothrombin Time (PT) Test
- 6.2.5. Other Te
- 6.3. Market Analysis, Insights and Forecast - by End User
- 6.3.1. Hospitals
- 6.3.2. Diagnostic Centers
- 6.3.3. Other En
- 6.1. Market Analysis, Insights and Forecast - by Product
- 7. Europe Blood Coagulation Testing Industry Analysis, Insights and Forecast, 2020-2032
- 7.1. Market Analysis, Insights and Forecast - by Product
- 7.1.1. Laboratory Analyzers
- 7.1.1.1. Automated Systems
- 7.1.1.2. Semi-automated Systems
- 7.1.1.3. Manual Systems
- 7.1.2. Point-of-Care Testing Systems
- 7.1.1. Laboratory Analyzers
- 7.2. Market Analysis, Insights and Forecast - by Test
- 7.2.1. Activated Partial Thromboplastin Time
- 7.2.2. D-Dimer Test
- 7.2.3. Fibrinogen Test
- 7.2.4. Prothrombin Time (PT) Test
- 7.2.5. Other Te
- 7.3. Market Analysis, Insights and Forecast - by End User
- 7.3.1. Hospitals
- 7.3.2. Diagnostic Centers
- 7.3.3. Other En
- 7.1. Market Analysis, Insights and Forecast - by Product
- 8. Asia Pacific Blood Coagulation Testing Industry Analysis, Insights and Forecast, 2020-2032
- 8.1. Market Analysis, Insights and Forecast - by Product
- 8.1.1. Laboratory Analyzers
- 8.1.1.1. Automated Systems
- 8.1.1.2. Semi-automated Systems
- 8.1.1.3. Manual Systems
- 8.1.2. Point-of-Care Testing Systems
- 8.1.1. Laboratory Analyzers
- 8.2. Market Analysis, Insights and Forecast - by Test
- 8.2.1. Activated Partial Thromboplastin Time
- 8.2.2. D-Dimer Test
- 8.2.3. Fibrinogen Test
- 8.2.4. Prothrombin Time (PT) Test
- 8.2.5. Other Te
- 8.3. Market Analysis, Insights and Forecast - by End User
- 8.3.1. Hospitals
- 8.3.2. Diagnostic Centers
- 8.3.3. Other En
- 8.1. Market Analysis, Insights and Forecast - by Product
- 9. Middle East and Africa Blood Coagulation Testing Industry Analysis, Insights and Forecast, 2020-2032
- 9.1. Market Analysis, Insights and Forecast - by Product
- 9.1.1. Laboratory Analyzers
- 9.1.1.1. Automated Systems
- 9.1.1.2. Semi-automated Systems
- 9.1.1.3. Manual Systems
- 9.1.2. Point-of-Care Testing Systems
- 9.1.1. Laboratory Analyzers
- 9.2. Market Analysis, Insights and Forecast - by Test
- 9.2.1. Activated Partial Thromboplastin Time
- 9.2.2. D-Dimer Test
- 9.2.3. Fibrinogen Test
- 9.2.4. Prothrombin Time (PT) Test
- 9.2.5. Other Te
- 9.3. Market Analysis, Insights and Forecast - by End User
- 9.3.1. Hospitals
- 9.3.2. Diagnostic Centers
- 9.3.3. Other En
- 9.1. Market Analysis, Insights and Forecast - by Product
- 10. South America Blood Coagulation Testing Industry Analysis, Insights and Forecast, 2020-2032
- 10.1. Market Analysis, Insights and Forecast - by Product
- 10.1.1. Laboratory Analyzers
- 10.1.1.1. Automated Systems
- 10.1.1.2. Semi-automated Systems
- 10.1.1.3. Manual Systems
- 10.1.2. Point-of-Care Testing Systems
- 10.1.1. Laboratory Analyzers
- 10.2. Market Analysis, Insights and Forecast - by Test
- 10.2.1. Activated Partial Thromboplastin Time
- 10.2.2. D-Dimer Test
- 10.2.3. Fibrinogen Test
- 10.2.4. Prothrombin Time (PT) Test
- 10.2.5. Other Te
- 10.3. Market Analysis, Insights and Forecast - by End User
- 10.3.1. Hospitals
- 10.3.2. Diagnostic Centers
- 10.3.3. Other En
- 10.1. Market Analysis, Insights and Forecast - by Product
- 11. Competitive Analysis
- 11.1. Global Market Share Analysis 2025
- 11.2. Company Profiles
- 11.2.1 Thermo Fisher Scientific Inc
- 11.2.1.1. Overview
- 11.2.1.2. Products
- 11.2.1.3. SWOT Analysis
- 11.2.1.4. Recent Developments
- 11.2.1.5. Financials (Based on Availability)
- 11.2.2 Grifols
- 11.2.2.1. Overview
- 11.2.2.2. Products
- 11.2.2.3. SWOT Analysis
- 11.2.2.4. Recent Developments
- 11.2.2.5. Financials (Based on Availability)
- 11.2.3 Siemens Healthineers
- 11.2.3.1. Overview
- 11.2.3.2. Products
- 11.2.3.3. SWOT Analysis
- 11.2.3.4. Recent Developments
- 11.2.3.5. Financials (Based on Availability)
- 11.2.4 F Hoffmann-La Roche Ltd
- 11.2.4.1. Overview
- 11.2.4.2. Products
- 11.2.4.3. SWOT Analysis
- 11.2.4.4. Recent Developments
- 11.2.4.5. Financials (Based on Availability)
- 11.2.5 Human Diagnostics
- 11.2.5.1. Overview
- 11.2.5.2. Products
- 11.2.5.3. SWOT Analysis
- 11.2.5.4. Recent Developments
- 11.2.5.5. Financials (Based on Availability)
- 11.2.6 GE Healthcare
- 11.2.6.1. Overview
- 11.2.6.2. Products
- 11.2.6.3. SWOT Analysis
- 11.2.6.4. Recent Developments
- 11.2.6.5. Financials (Based on Availability)
- 11.2.7 Danaher Corporation
- 11.2.7.1. Overview
- 11.2.7.2. Products
- 11.2.7.3. SWOT Analysis
- 11.2.7.4. Recent Developments
- 11.2.7.5. Financials (Based on Availability)
- 11.2.8 NIHON KOHDEN CORPORATION
- 11.2.8.1. Overview
- 11.2.8.2. Products
- 11.2.8.3. SWOT Analysis
- 11.2.8.4. Recent Developments
- 11.2.8.5. Financials (Based on Availability)
- 11.2.9 Abbott
- 11.2.9.1. Overview
- 11.2.9.2. Products
- 11.2.9.3. SWOT Analysis
- 11.2.9.4. Recent Developments
- 11.2.9.5. Financials (Based on Availability)
- 11.2.10 Bio-Rad Laboratories
- 11.2.10.1. Overview
- 11.2.10.2. Products
- 11.2.10.3. SWOT Analysis
- 11.2.10.4. Recent Developments
- 11.2.10.5. Financials (Based on Availability)
- 11.2.11 Sysmex Corporation
- 11.2.11.1. Overview
- 11.2.11.2. Products
- 11.2.11.3. SWOT Analysis
- 11.2.11.4. Recent Developments
- 11.2.11.5. Financials (Based on Availability)
- 11.2.12 Werfen
- 11.2.12.1. Overview
- 11.2.12.2. Products
- 11.2.12.3. SWOT Analysis
- 11.2.12.4. Recent Developments
- 11.2.12.5. Financials (Based on Availability)
- 11.2.1 Thermo Fisher Scientific Inc
List of Figures
- Figure 1: Global Blood Coagulation Testing Industry Revenue Breakdown (undefined, %) by Region 2025 & 2033
- Figure 2: Global Blood Coagulation Testing Industry Volume Breakdown (K Unit, %) by Region 2025 & 2033
- Figure 3: North America Blood Coagulation Testing Industry Revenue (undefined), by Product 2025 & 2033
- Figure 4: North America Blood Coagulation Testing Industry Volume (K Unit), by Product 2025 & 2033
- Figure 5: North America Blood Coagulation Testing Industry Revenue Share (%), by Product 2025 & 2033
- Figure 6: North America Blood Coagulation Testing Industry Volume Share (%), by Product 2025 & 2033
- Figure 7: North America Blood Coagulation Testing Industry Revenue (undefined), by Test 2025 & 2033
- Figure 8: North America Blood Coagulation Testing Industry Volume (K Unit), by Test 2025 & 2033
- Figure 9: North America Blood Coagulation Testing Industry Revenue Share (%), by Test 2025 & 2033
- Figure 10: North America Blood Coagulation Testing Industry Volume Share (%), by Test 2025 & 2033
- Figure 11: North America Blood Coagulation Testing Industry Revenue (undefined), by End User 2025 & 2033
- Figure 12: North America Blood Coagulation Testing Industry Volume (K Unit), by End User 2025 & 2033
- Figure 13: North America Blood Coagulation Testing Industry Revenue Share (%), by End User 2025 & 2033
- Figure 14: North America Blood Coagulation Testing Industry Volume Share (%), by End User 2025 & 2033
- Figure 15: North America Blood Coagulation Testing Industry Revenue (undefined), by Country 2025 & 2033
- Figure 16: North America Blood Coagulation Testing Industry Volume (K Unit), by Country 2025 & 2033
- Figure 17: North America Blood Coagulation Testing Industry Revenue Share (%), by Country 2025 & 2033
- Figure 18: North America Blood Coagulation Testing Industry Volume Share (%), by Country 2025 & 2033
- Figure 19: Europe Blood Coagulation Testing Industry Revenue (undefined), by Product 2025 & 2033
- Figure 20: Europe Blood Coagulation Testing Industry Volume (K Unit), by Product 2025 & 2033
- Figure 21: Europe Blood Coagulation Testing Industry Revenue Share (%), by Product 2025 & 2033
- Figure 22: Europe Blood Coagulation Testing Industry Volume Share (%), by Product 2025 & 2033
- Figure 23: Europe Blood Coagulation Testing Industry Revenue (undefined), by Test 2025 & 2033
- Figure 24: Europe Blood Coagulation Testing Industry Volume (K Unit), by Test 2025 & 2033
- Figure 25: Europe Blood Coagulation Testing Industry Revenue Share (%), by Test 2025 & 2033
- Figure 26: Europe Blood Coagulation Testing Industry Volume Share (%), by Test 2025 & 2033
- Figure 27: Europe Blood Coagulation Testing Industry Revenue (undefined), by End User 2025 & 2033
- Figure 28: Europe Blood Coagulation Testing Industry Volume (K Unit), by End User 2025 & 2033
- Figure 29: Europe Blood Coagulation Testing Industry Revenue Share (%), by End User 2025 & 2033
- Figure 30: Europe Blood Coagulation Testing Industry Volume Share (%), by End User 2025 & 2033
- Figure 31: Europe Blood Coagulation Testing Industry Revenue (undefined), by Country 2025 & 2033
- Figure 32: Europe Blood Coagulation Testing Industry Volume (K Unit), by Country 2025 & 2033
- Figure 33: Europe Blood Coagulation Testing Industry Revenue Share (%), by Country 2025 & 2033
- Figure 34: Europe Blood Coagulation Testing Industry Volume Share (%), by Country 2025 & 2033
- Figure 35: Asia Pacific Blood Coagulation Testing Industry Revenue (undefined), by Product 2025 & 2033
- Figure 36: Asia Pacific Blood Coagulation Testing Industry Volume (K Unit), by Product 2025 & 2033
- Figure 37: Asia Pacific Blood Coagulation Testing Industry Revenue Share (%), by Product 2025 & 2033
- Figure 38: Asia Pacific Blood Coagulation Testing Industry Volume Share (%), by Product 2025 & 2033
- Figure 39: Asia Pacific Blood Coagulation Testing Industry Revenue (undefined), by Test 2025 & 2033
- Figure 40: Asia Pacific Blood Coagulation Testing Industry Volume (K Unit), by Test 2025 & 2033
- Figure 41: Asia Pacific Blood Coagulation Testing Industry Revenue Share (%), by Test 2025 & 2033
- Figure 42: Asia Pacific Blood Coagulation Testing Industry Volume Share (%), by Test 2025 & 2033
- Figure 43: Asia Pacific Blood Coagulation Testing Industry Revenue (undefined), by End User 2025 & 2033
- Figure 44: Asia Pacific Blood Coagulation Testing Industry Volume (K Unit), by End User 2025 & 2033
- Figure 45: Asia Pacific Blood Coagulation Testing Industry Revenue Share (%), by End User 2025 & 2033
- Figure 46: Asia Pacific Blood Coagulation Testing Industry Volume Share (%), by End User 2025 & 2033
- Figure 47: Asia Pacific Blood Coagulation Testing Industry Revenue (undefined), by Country 2025 & 2033
- Figure 48: Asia Pacific Blood Coagulation Testing Industry Volume (K Unit), by Country 2025 & 2033
- Figure 49: Asia Pacific Blood Coagulation Testing Industry Revenue Share (%), by Country 2025 & 2033
- Figure 50: Asia Pacific Blood Coagulation Testing Industry Volume Share (%), by Country 2025 & 2033
- Figure 51: Middle East and Africa Blood Coagulation Testing Industry Revenue (undefined), by Product 2025 & 2033
- Figure 52: Middle East and Africa Blood Coagulation Testing Industry Volume (K Unit), by Product 2025 & 2033
- Figure 53: Middle East and Africa Blood Coagulation Testing Industry Revenue Share (%), by Product 2025 & 2033
- Figure 54: Middle East and Africa Blood Coagulation Testing Industry Volume Share (%), by Product 2025 & 2033
- Figure 55: Middle East and Africa Blood Coagulation Testing Industry Revenue (undefined), by Test 2025 & 2033
- Figure 56: Middle East and Africa Blood Coagulation Testing Industry Volume (K Unit), by Test 2025 & 2033
- Figure 57: Middle East and Africa Blood Coagulation Testing Industry Revenue Share (%), by Test 2025 & 2033
- Figure 58: Middle East and Africa Blood Coagulation Testing Industry Volume Share (%), by Test 2025 & 2033
- Figure 59: Middle East and Africa Blood Coagulation Testing Industry Revenue (undefined), by End User 2025 & 2033
- Figure 60: Middle East and Africa Blood Coagulation Testing Industry Volume (K Unit), by End User 2025 & 2033
- Figure 61: Middle East and Africa Blood Coagulation Testing Industry Revenue Share (%), by End User 2025 & 2033
- Figure 62: Middle East and Africa Blood Coagulation Testing Industry Volume Share (%), by End User 2025 & 2033
- Figure 63: Middle East and Africa Blood Coagulation Testing Industry Revenue (undefined), by Country 2025 & 2033
- Figure 64: Middle East and Africa Blood Coagulation Testing Industry Volume (K Unit), by Country 2025 & 2033
- Figure 65: Middle East and Africa Blood Coagulation Testing Industry Revenue Share (%), by Country 2025 & 2033
- Figure 66: Middle East and Africa Blood Coagulation Testing Industry Volume Share (%), by Country 2025 & 2033
- Figure 67: South America Blood Coagulation Testing Industry Revenue (undefined), by Product 2025 & 2033
- Figure 68: South America Blood Coagulation Testing Industry Volume (K Unit), by Product 2025 & 2033
- Figure 69: South America Blood Coagulation Testing Industry Revenue Share (%), by Product 2025 & 2033
- Figure 70: South America Blood Coagulation Testing Industry Volume Share (%), by Product 2025 & 2033
- Figure 71: South America Blood Coagulation Testing Industry Revenue (undefined), by Test 2025 & 2033
- Figure 72: South America Blood Coagulation Testing Industry Volume (K Unit), by Test 2025 & 2033
- Figure 73: South America Blood Coagulation Testing Industry Revenue Share (%), by Test 2025 & 2033
- Figure 74: South America Blood Coagulation Testing Industry Volume Share (%), by Test 2025 & 2033
- Figure 75: South America Blood Coagulation Testing Industry Revenue (undefined), by End User 2025 & 2033
- Figure 76: South America Blood Coagulation Testing Industry Volume (K Unit), by End User 2025 & 2033
- Figure 77: South America Blood Coagulation Testing Industry Revenue Share (%), by End User 2025 & 2033
- Figure 78: South America Blood Coagulation Testing Industry Volume Share (%), by End User 2025 & 2033
- Figure 79: South America Blood Coagulation Testing Industry Revenue (undefined), by Country 2025 & 2033
- Figure 80: South America Blood Coagulation Testing Industry Volume (K Unit), by Country 2025 & 2033
- Figure 81: South America Blood Coagulation Testing Industry Revenue Share (%), by Country 2025 & 2033
- Figure 82: South America Blood Coagulation Testing Industry Volume Share (%), by Country 2025 & 2033
List of Tables
- Table 1: Global Blood Coagulation Testing Industry Revenue undefined Forecast, by Product 2020 & 2033
- Table 2: Global Blood Coagulation Testing Industry Volume K Unit Forecast, by Product 2020 & 2033
- Table 3: Global Blood Coagulation Testing Industry Revenue undefined Forecast, by Test 2020 & 2033
- Table 4: Global Blood Coagulation Testing Industry Volume K Unit Forecast, by Test 2020 & 2033
- Table 5: Global Blood Coagulation Testing Industry Revenue undefined Forecast, by End User 2020 & 2033
- Table 6: Global Blood Coagulation Testing Industry Volume K Unit Forecast, by End User 2020 & 2033
- Table 7: Global Blood Coagulation Testing Industry Revenue undefined Forecast, by Region 2020 & 2033
- Table 8: Global Blood Coagulation Testing Industry Volume K Unit Forecast, by Region 2020 & 2033
- Table 9: Global Blood Coagulation Testing Industry Revenue undefined Forecast, by Product 2020 & 2033
- Table 10: Global Blood Coagulation Testing Industry Volume K Unit Forecast, by Product 2020 & 2033
- Table 11: Global Blood Coagulation Testing Industry Revenue undefined Forecast, by Test 2020 & 2033
- Table 12: Global Blood Coagulation Testing Industry Volume K Unit Forecast, by Test 2020 & 2033
- Table 13: Global Blood Coagulation Testing Industry Revenue undefined Forecast, by End User 2020 & 2033
- Table 14: Global Blood Coagulation Testing Industry Volume K Unit Forecast, by End User 2020 & 2033
- Table 15: Global Blood Coagulation Testing Industry Revenue undefined Forecast, by Country 2020 & 2033
- Table 16: Global Blood Coagulation Testing Industry Volume K Unit Forecast, by Country 2020 & 2033
- Table 17: United States Blood Coagulation Testing Industry Revenue (undefined) Forecast, by Application 2020 & 2033
- Table 18: United States Blood Coagulation Testing Industry Volume (K Unit) Forecast, by Application 2020 & 2033
- Table 19: Canada Blood Coagulation Testing Industry Revenue (undefined) Forecast, by Application 2020 & 2033
- Table 20: Canada Blood Coagulation Testing Industry Volume (K Unit) Forecast, by Application 2020 & 2033
- Table 21: Mexico Blood Coagulation Testing Industry Revenue (undefined) Forecast, by Application 2020 & 2033
- Table 22: Mexico Blood Coagulation Testing Industry Volume (K Unit) Forecast, by Application 2020 & 2033
- Table 23: Global Blood Coagulation Testing Industry Revenue undefined Forecast, by Product 2020 & 2033
- Table 24: Global Blood Coagulation Testing Industry Volume K Unit Forecast, by Product 2020 & 2033
- Table 25: Global Blood Coagulation Testing Industry Revenue undefined Forecast, by Test 2020 & 2033
- Table 26: Global Blood Coagulation Testing Industry Volume K Unit Forecast, by Test 2020 & 2033
- Table 27: Global Blood Coagulation Testing Industry Revenue undefined Forecast, by End User 2020 & 2033
- Table 28: Global Blood Coagulation Testing Industry Volume K Unit Forecast, by End User 2020 & 2033
- Table 29: Global Blood Coagulation Testing Industry Revenue undefined Forecast, by Country 2020 & 2033
- Table 30: Global Blood Coagulation Testing Industry Volume K Unit Forecast, by Country 2020 & 2033
- Table 31: Germany Blood Coagulation Testing Industry Revenue (undefined) Forecast, by Application 2020 & 2033
- Table 32: Germany Blood Coagulation Testing Industry Volume (K Unit) Forecast, by Application 2020 & 2033
- Table 33: United Kingdom Blood Coagulation Testing Industry Revenue (undefined) Forecast, by Application 2020 & 2033
- Table 34: United Kingdom Blood Coagulation Testing Industry Volume (K Unit) Forecast, by Application 2020 & 2033
- Table 35: France Blood Coagulation Testing Industry Revenue (undefined) Forecast, by Application 2020 & 2033
- Table 36: France Blood Coagulation Testing Industry Volume (K Unit) Forecast, by Application 2020 & 2033
- Table 37: Italy Blood Coagulation Testing Industry Revenue (undefined) Forecast, by Application 2020 & 2033
- Table 38: Italy Blood Coagulation Testing Industry Volume (K Unit) Forecast, by Application 2020 & 2033
- Table 39: Spain Blood Coagulation Testing Industry Revenue (undefined) Forecast, by Application 2020 & 2033
- Table 40: Spain Blood Coagulation Testing Industry Volume (K Unit) Forecast, by Application 2020 & 2033
- Table 41: Rest of Europe Blood Coagulation Testing Industry Revenue (undefined) Forecast, by Application 2020 & 2033
- Table 42: Rest of Europe Blood Coagulation Testing Industry Volume (K Unit) Forecast, by Application 2020 & 2033
- Table 43: Global Blood Coagulation Testing Industry Revenue undefined Forecast, by Product 2020 & 2033
- Table 44: Global Blood Coagulation Testing Industry Volume K Unit Forecast, by Product 2020 & 2033
- Table 45: Global Blood Coagulation Testing Industry Revenue undefined Forecast, by Test 2020 & 2033
- Table 46: Global Blood Coagulation Testing Industry Volume K Unit Forecast, by Test 2020 & 2033
- Table 47: Global Blood Coagulation Testing Industry Revenue undefined Forecast, by End User 2020 & 2033
- Table 48: Global Blood Coagulation Testing Industry Volume K Unit Forecast, by End User 2020 & 2033
- Table 49: Global Blood Coagulation Testing Industry Revenue undefined Forecast, by Country 2020 & 2033
- Table 50: Global Blood Coagulation Testing Industry Volume K Unit Forecast, by Country 2020 & 2033
- Table 51: China Blood Coagulation Testing Industry Revenue (undefined) Forecast, by Application 2020 & 2033
- Table 52: China Blood Coagulation Testing Industry Volume (K Unit) Forecast, by Application 2020 & 2033
- Table 53: Japan Blood Coagulation Testing Industry Revenue (undefined) Forecast, by Application 2020 & 2033
- Table 54: Japan Blood Coagulation Testing Industry Volume (K Unit) Forecast, by Application 2020 & 2033
- Table 55: India Blood Coagulation Testing Industry Revenue (undefined) Forecast, by Application 2020 & 2033
- Table 56: India Blood Coagulation Testing Industry Volume (K Unit) Forecast, by Application 2020 & 2033
- Table 57: Australia Blood Coagulation Testing Industry Revenue (undefined) Forecast, by Application 2020 & 2033
- Table 58: Australia Blood Coagulation Testing Industry Volume (K Unit) Forecast, by Application 2020 & 2033
- Table 59: South Korea Blood Coagulation Testing Industry Revenue (undefined) Forecast, by Application 2020 & 2033
- Table 60: South Korea Blood Coagulation Testing Industry Volume (K Unit) Forecast, by Application 2020 & 2033
- Table 61: Rest of Asia Pacific Blood Coagulation Testing Industry Revenue (undefined) Forecast, by Application 2020 & 2033
- Table 62: Rest of Asia Pacific Blood Coagulation Testing Industry Volume (K Unit) Forecast, by Application 2020 & 2033
- Table 63: Global Blood Coagulation Testing Industry Revenue undefined Forecast, by Product 2020 & 2033
- Table 64: Global Blood Coagulation Testing Industry Volume K Unit Forecast, by Product 2020 & 2033
- Table 65: Global Blood Coagulation Testing Industry Revenue undefined Forecast, by Test 2020 & 2033
- Table 66: Global Blood Coagulation Testing Industry Volume K Unit Forecast, by Test 2020 & 2033
- Table 67: Global Blood Coagulation Testing Industry Revenue undefined Forecast, by End User 2020 & 2033
- Table 68: Global Blood Coagulation Testing Industry Volume K Unit Forecast, by End User 2020 & 2033
- Table 69: Global Blood Coagulation Testing Industry Revenue undefined Forecast, by Country 2020 & 2033
- Table 70: Global Blood Coagulation Testing Industry Volume K Unit Forecast, by Country 2020 & 2033
- Table 71: GCC Blood Coagulation Testing Industry Revenue (undefined) Forecast, by Application 2020 & 2033
- Table 72: GCC Blood Coagulation Testing Industry Volume (K Unit) Forecast, by Application 2020 & 2033
- Table 73: South Africa Blood Coagulation Testing Industry Revenue (undefined) Forecast, by Application 2020 & 2033
- Table 74: South Africa Blood Coagulation Testing Industry Volume (K Unit) Forecast, by Application 2020 & 2033
- Table 75: Rest of Middle East and Africa Blood Coagulation Testing Industry Revenue (undefined) Forecast, by Application 2020 & 2033
- Table 76: Rest of Middle East and Africa Blood Coagulation Testing Industry Volume (K Unit) Forecast, by Application 2020 & 2033
- Table 77: Global Blood Coagulation Testing Industry Revenue undefined Forecast, by Product 2020 & 2033
- Table 78: Global Blood Coagulation Testing Industry Volume K Unit Forecast, by Product 2020 & 2033
- Table 79: Global Blood Coagulation Testing Industry Revenue undefined Forecast, by Test 2020 & 2033
- Table 80: Global Blood Coagulation Testing Industry Volume K Unit Forecast, by Test 2020 & 2033
- Table 81: Global Blood Coagulation Testing Industry Revenue undefined Forecast, by End User 2020 & 2033
- Table 82: Global Blood Coagulation Testing Industry Volume K Unit Forecast, by End User 2020 & 2033
- Table 83: Global Blood Coagulation Testing Industry Revenue undefined Forecast, by Country 2020 & 2033
- Table 84: Global Blood Coagulation Testing Industry Volume K Unit Forecast, by Country 2020 & 2033
- Table 85: Brazil Blood Coagulation Testing Industry Revenue (undefined) Forecast, by Application 2020 & 2033
- Table 86: Brazil Blood Coagulation Testing Industry Volume (K Unit) Forecast, by Application 2020 & 2033
- Table 87: Argentina Blood Coagulation Testing Industry Revenue (undefined) Forecast, by Application 2020 & 2033
- Table 88: Argentina Blood Coagulation Testing Industry Volume (K Unit) Forecast, by Application 2020 & 2033
- Table 89: Rest of South America Blood Coagulation Testing Industry Revenue (undefined) Forecast, by Application 2020 & 2033
- Table 90: Rest of South America Blood Coagulation Testing Industry Volume (K Unit) Forecast, by Application 2020 & 2033
Frequently Asked Questions
1. What is the projected Compound Annual Growth Rate (CAGR) of the Blood Coagulation Testing Industry?
The projected CAGR is approximately 11.6%.
2. Which companies are prominent players in the Blood Coagulation Testing Industry?
Key companies in the market include Thermo Fisher Scientific Inc , Grifols, Siemens Healthineers, F Hoffmann-La Roche Ltd, Human Diagnostics, GE Healthcare, Danaher Corporation, NIHON KOHDEN CORPORATION, Abbott, Bio-Rad Laboratories, Sysmex Corporation, Werfen.
3. What are the main segments of the Blood Coagulation Testing Industry?
The market segments include Product, Test, End User.
4. Can you provide details about the market size?
The market size is estimated to be USD XXX N/A as of 2022.
5. What are some drivers contributing to market growth?
Rising Incidences of Blood Clotting Disorders; Technological Advancements for Medical Treatment; Rising Adoption of Automated Hemostasis Equipment.
6. What are the notable trends driving market growth?
The Point-of-Care Testing Systems Segment is Expected to Hold a Significant Market Share Over The Forecast Period..
7. Are there any restraints impacting market growth?
Lack of Awareness in Developing Countries; Stringent Government Regulation.
8. Can you provide examples of recent developments in the market?
In December 2022, HemoSonics received 510 (k) market clearance for its Quantra Hemostasis System with QStat Cartridge from the US FDA. The company stated that the QStat Cartridge assay increases Quantra's overall diagnostic capabilities. The new next-generation whole-blood hemostasis system covers the widest variety of clinical indications of any point-of-care hemostasis analyzer in the United States.
9. What pricing options are available for accessing the report?
Pricing options include single-user, multi-user, and enterprise licenses priced at USD 4750, USD 5250, and USD 8750 respectively.
10. Is the market size provided in terms of value or volume?
The market size is provided in terms of value, measured in N/A and volume, measured in K Unit.
11. Are there any specific market keywords associated with the report?
Yes, the market keyword associated with the report is "Blood Coagulation Testing Industry," which aids in identifying and referencing the specific market segment covered.
12. How do I determine which pricing option suits my needs best?
The pricing options vary based on user requirements and access needs. Individual users may opt for single-user licenses, while businesses requiring broader access may choose multi-user or enterprise licenses for cost-effective access to the report.
13. Are there any additional resources or data provided in the Blood Coagulation Testing Industry report?
While the report offers comprehensive insights, it's advisable to review the specific contents or supplementary materials provided to ascertain if additional resources or data are available.
14. How can I stay updated on further developments or reports in the Blood Coagulation Testing Industry?
To stay informed about further developments, trends, and reports in the Blood Coagulation Testing Industry, consider subscribing to industry newsletters, following relevant companies and organizations, or regularly checking reputable industry news sources and publications.
Methodology
Step 1 - Identification of Relevant Samples Size from Population Database


Step 2 - Approaches for Defining Global Market Size (Value, Volume* & Price*)

Note*: In applicable scenarios
Step 3 - Data Sources
Primary Research
- Web Analytics
- Survey Reports
- Research Institute
- Latest Research Reports
- Opinion Leaders
Secondary Research
- Annual Reports
- White Paper
- Latest Press Release
- Industry Association
- Paid Database
- Investor Presentations

Step 4 - Data Triangulation
Involves using different sources of information in order to increase the validity of a study
These sources are likely to be stakeholders in a program - participants, other researchers, program staff, other community members, and so on.
Then we put all data in single framework & apply various statistical tools to find out the dynamic on the market.
During the analysis stage, feedback from the stakeholder groups would be compared to determine areas of agreement as well as areas of divergence