

Key Insights
The global Pulmonary Arterial Hypertension (PAH) market is poised for significant expansion, with a projected market size of USD 8.7 billion in 2025. This growth is underpinned by a robust Compound Annual Growth Rate (CAGR) of 5.4% during the forecast period of 2025-2033. The increasing prevalence of PAH, driven by factors such as rising incidences of idiopathic PAH, heritable PAH, and PAH associated with connective tissue diseases, is a primary market driver. Advancements in diagnostic tools and a growing emphasis on early intervention are further contributing to market expansion. The development of novel therapeutic agents and combinations, alongside increased patient awareness and access to specialized treatment centers, are key factors fueling this positive trajectory.
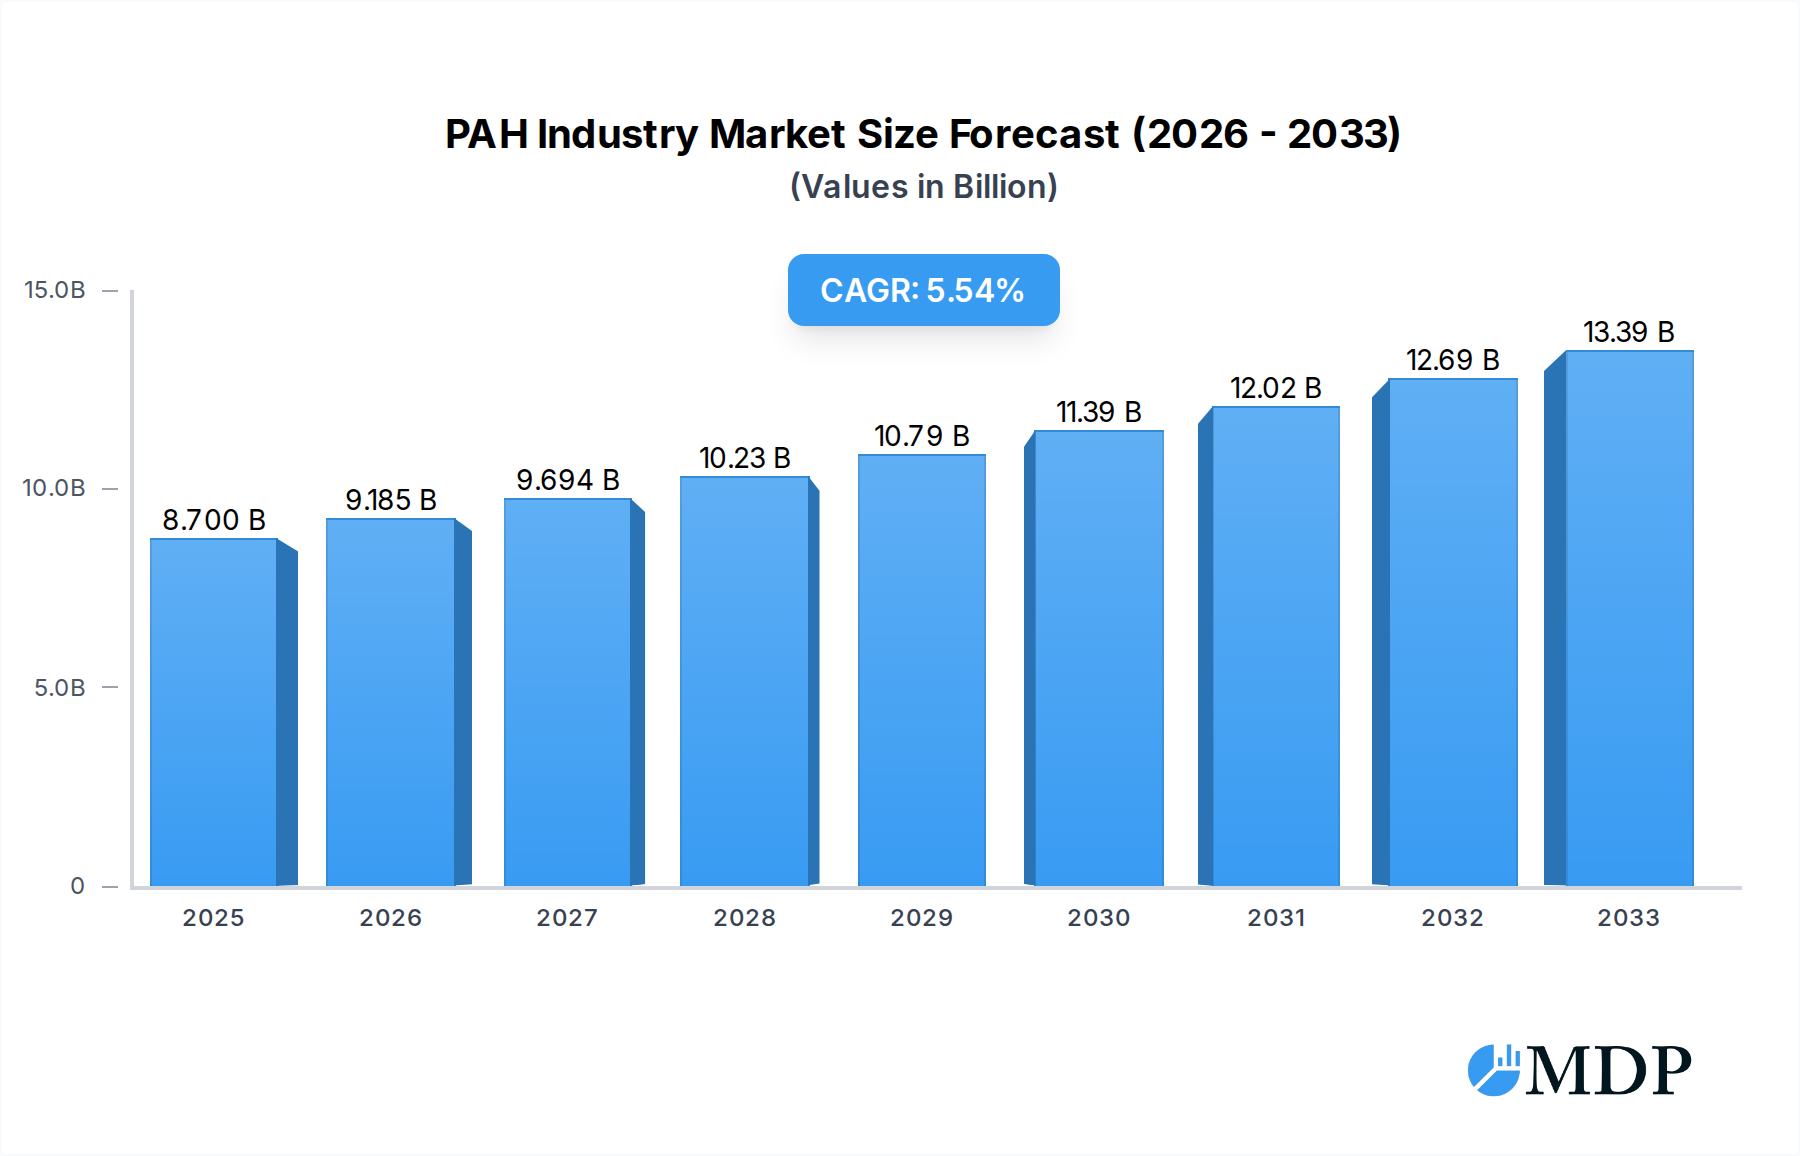
PAH Industry Market Size (In Billion)
The PAH market is characterized by a diverse range of therapeutic segments, with Prostacyclin and Prostacyclin Analogs, Calcium Channel Blockers, Phosphodiesterase 5 (PDE-5) inhibitors, and Endothelin Receptor Antagonists (ERAs) forming the core of current treatment paradigms. The market also sees emerging therapies and combination treatments gaining traction. Restraints such as the high cost of treatment, the limited availability of specialized healthcare professionals in certain regions, and the complex nature of PAH diagnosis and management are being addressed through ongoing research and development efforts, as well as initiatives aimed at improving patient access and affordability. Major industry players like Bayer AG, Novartis International AG, and Merck & Co Inc are at the forefront, investing heavily in R&D to introduce innovative solutions and expand their market reach across key regions including North America, Europe, and Asia Pacific.

PAH Industry Company Market Share
PAH Industry Market Dynamics & Concentration
The Pulmonary Arterial Hypertension (PAH) industry exhibits a moderately concentrated market structure, driven by significant research and development investments and a complex regulatory landscape. Key innovation drivers include the pursuit of novel therapeutic targets, improved drug delivery mechanisms, and the development of combination therapies to address the multi-faceted nature of PAH. Regulatory frameworks, while stringent, are crucial for ensuring patient safety and efficacy, with a significant influence on market entry and product approval timelines. The presence of established pharmaceutical giants like Bayer AG, Novartis International AG, Merck & Co Inc, and GlaxoSmithKline Plc alongside specialized biopharmaceutical firms such as Arena Pharmaceuticals, Johnson & Johnson (Actelion Pharmaceuticals Ltd), Gilead Sciences Inc, Bristol-Myers Squibb Company, United Therapeutics Corporation, and Pfizer Inc shapes the competitive dynamics. Product substitutes, while limited in the direct treatment of PAH, can emerge from advancements in managing related cardiovascular or pulmonary conditions. End-user trends are increasingly focused on patient-centric care, personalized treatment approaches, and improved quality of life, influencing R&D priorities. Merger and acquisition (M&A) activities, with an estimated 15 significant deals in the historical period (2019-2024), are pivotal for market consolidation, talent acquisition, and pipeline expansion. These transactions, with an aggregate value exceeding $5 billion, underscore the strategic importance of acquiring innovative assets and technologies within the PAH space. Market share distribution sees leading players holding substantial portions, with the top five companies collectively accounting for over 60% of the global market. The continuous quest for improved treatment outcomes fuels ongoing innovation and competitive maneuvering.
PAH Industry Industry Trends & Analysis
The global Pulmonary Arterial Hypertension (PAH) market is poised for robust growth, projected to expand at a Compound Annual Growth Rate (CAGR) of approximately 8.5% from 2025 to 2033, reaching an estimated market valuation of over $25 billion by 2033. This significant expansion is propelled by a confluence of critical market growth drivers. Firstly, an increasing global prevalence of PAH, attributed to factors such as aging populations, advancements in diagnostic capabilities leading to earlier detection, and a better understanding of underlying risk factors, forms the bedrock of this market expansion. Enhanced diagnostic tools and greater awareness among healthcare professionals are leading to a higher number of diagnosed cases, thereby increasing the patient pool seeking treatment. Secondly, the continuous pipeline of innovative therapies, including novel drug classes and advanced treatment modalities, acts as a powerful catalyst. Pharmaceutical companies are heavily investing in research and development, focusing on unmet needs and seeking to improve patient outcomes beyond current treatment paradigms. This includes the exploration of gene therapies, targeted molecular therapies, and improved formulations of existing drugs. Thirdly, favorable reimbursement policies and increasing healthcare expenditure, particularly in emerging economies, are contributing to improved market access for advanced PAH treatments. Governments and insurance providers are recognizing the long-term economic benefits of effective PAH management, leading to better coverage for life-saving medications. Technological disruptions are also playing a crucial role. Advancements in drug discovery platforms, such as artificial intelligence (AI) and machine learning, are accelerating the identification of potential drug candidates and optimizing clinical trial designs. Furthermore, the development of novel drug delivery systems, including inhaled and subcutaneous formulations, is enhancing patient convenience and adherence to treatment regimens. Consumer preferences are shifting towards personalized medicine, with a growing demand for treatments tailored to individual patient profiles, genetic predispositions, and disease severity. This trend is driving the development of precision therapies. The competitive dynamics within the PAH market are characterized by intense innovation and strategic collaborations. Leading pharmaceutical companies are actively engaged in R&D, with a focus on developing next-generation therapies and expanding the therapeutic applications of existing drugs. Strategic partnerships and licensing agreements are common as companies seek to leverage each other's expertise and accelerate market penetration. The market penetration for advanced PAH treatments is expected to deepen significantly over the forecast period, driven by the aforementioned factors and the increasing availability of effective therapeutic options.
Leading Markets & Segments in PAH Industry
The Prostacyclin and Prostacyclin Analogs segment stands as a dominant force within the global Pulmonary Arterial Hypertension (PAH) market, projected to command a significant market share exceeding 35% of the total market value by 2033. This segment's supremacy is underpinned by several key drivers.
- Established Efficacy and Clinical History: Prostacyclins have a long-standing reputation for their potent vasodilatory and anti-proliferative effects, offering significant benefits in improving exercise capacity and hemodynamics in PAH patients. Their established clinical efficacy, backed by decades of research and real-world data, instills confidence among prescribers and patients alike.
- Diverse Administration Routes: The availability of various administration routes, including intravenous, subcutaneous, inhaled, and oral formulations (e.g., selexipag), caters to different patient needs and preferences, enhancing treatment adherence and accessibility. The development of more convenient oral prostacyclin analogs has been a major boon for patient convenience.
- Key Market Players' Robust Pipelines: Major pharmaceutical companies like United Therapeutics Corporation, a leader in prostacyclin therapies, continue to invest heavily in developing next-generation prostacyclin analogs with improved pharmacokinetic profiles and reduced side effects, ensuring the segment's continued innovation and market leadership.
- Global Healthcare Infrastructure Support: Developed nations with advanced healthcare infrastructure and robust reimbursement systems demonstrate higher adoption rates for these therapies, further bolstering the Prostacyclin and Prostacyclin Analogs segment's dominance. Government initiatives aimed at improving access to advanced treatments for rare diseases also contribute significantly.
While the Prostacyclin and Prostacyclin Analogs segment leads, other segments also exhibit strong growth trajectories:
The Endothelin Receptor Antagonists (ERA) segment, with key players like Bayer AG and Merck & Co Inc, is a significant contributor, expected to hold a market share of approximately 25%. The development of dual and selective ERAs has expanded their therapeutic utility and market appeal.
The Phosphodiesterase 5 (PDE-5) inhibitors, including Pfizer Inc's renowned drug, represent another crucial segment, anticipated to capture around 20% of the market. These drugs are widely used as first-line or combination therapies, contributing to their sustained market presence.
The Calcium Channel Blockers (CCBs) segment, while historically important, is projected to hold a smaller but stable market share of approximately 10%. Their role is often confined to specific patient subgroups who demonstrate a positive response to vasoreactivity testing.
The Others segment, encompassing emerging therapies and novel drug classes in development, is expected to grow at a faster pace, albeit from a smaller base, indicating future potential for market disruption and innovation. This segment includes investigational drugs targeting new pathways and combination therapies.
PAH Industry Product Developments
The PAH industry is witnessing a wave of product innovations aimed at enhancing therapeutic efficacy, improving patient convenience, and addressing unmet clinical needs. Key developments include the advancement of next-generation prostacyclin analogs with more favorable pharmacokinetic profiles and easier administration. Furthermore, research into novel molecular targets and combination therapies is a prominent trend. For instance, the publication of preclinical data by Gossamer Bio, Inc. for seralutinib highlights the potential of new drug candidates to offer improved treatment outcomes. These advancements are driven by a deep understanding of PAH pathophysiology and the continuous pursuit of superior treatment modalities, creating competitive advantages through increased efficacy, reduced side effect profiles, and improved quality of life for patients.
Key Drivers of PAH Industry Growth
The PAH industry's growth is propelled by a synergistic interplay of technological advancements, economic factors, and evolving regulatory landscapes.
- Technological Advancements: The development of novel drug discovery platforms, including AI-driven research, is accelerating the identification and development of groundbreaking therapies. Improvements in diagnostic imaging and genetic sequencing enable earlier and more accurate PAH diagnosis.
- Economic Factors: Increasing global healthcare expenditure, particularly in emerging markets, coupled with favorable reimbursement policies for orphan drugs, is expanding market access and affordability of PAH treatments. Rising disposable incomes correlate with greater demand for advanced healthcare solutions.
- Regulatory Support: Favorable regulatory pathways for rare diseases, including expedited review processes and extended market exclusivity, incentivize pharmaceutical companies to invest in PAH drug development, thereby fostering innovation and market growth.
Challenges in the PAH Industry Market
The PAH industry faces several significant challenges that can impede market growth. Stringent and lengthy regulatory approval processes for new drug candidates can delay market entry and increase development costs. The high cost of advanced PAH therapies poses a substantial barrier to access, particularly for patients in low- and middle-income countries, leading to significant out-of-pocket expenses or limited insurance coverage. Supply chain complexities for specialized medications, including cold chain management for certain biologics, can lead to disruptions and impact product availability. Intense competition among existing and pipeline therapies, with numerous companies vying for market share, also presents a challenge for sustained profitability.
Emerging Opportunities in PAH Industry
Catalysts driving long-term growth in the PAH industry lie in untapped therapeutic potential and expanding market reach. Technological breakthroughs in gene therapy and cell-based treatments offer promising avenues for disease modification beyond symptomatic relief. Strategic partnerships and collaborations between pharmaceutical giants and smaller biotechnology firms are crucial for pooling resources and accelerating R&D for innovative therapies. Market expansion into underserved regions, coupled with efforts to improve diagnostic rates and healthcare infrastructure in emerging economies, presents a substantial growth opportunity. Furthermore, the development of personalized medicine approaches, leveraging patient genetic profiles to optimize treatment selection, is poised to revolutionize PAH management.
Leading Players in the PAH Industry Sector
- Bayer AG
- Novartis International AG
- Merck & Co Inc
- GlaxoSmithKline Plc
- Arena Pharmaceuticals
- Johnson & Johnson (Actelion Pharmaceuticals Ltd )
- Gilead Sciences Inc
- Bristol-Myers Squibb Company
- United Therapeutics Corporation
- Pfizer Inc
Key Milestones in PAH Industry Industry
- July 2022: Cereno Scientific announced that the first patient had been enrolled in the Phase II study in pulmonary arterial hypertension (PAH) with drug candidate CS1.
- June 2022: Gossamer Bio, Inc. announced the publication of key preclinical data supporting the potential of seralutinib for the treatment of pulmonary arterial hypertension (PAH).
Strategic Outlook for PAH Industry Market
The strategic outlook for the PAH industry is exceptionally positive, characterized by sustained innovation and significant market expansion opportunities. Continued investment in R&D for novel therapeutics, particularly those targeting unmet needs and offering disease-modifying potential, will be a key growth accelerator. The increasing adoption of combination therapies and personalized medicine approaches will further enhance treatment efficacy and patient outcomes. Expansion into emerging markets, coupled with efforts to address affordability and accessibility challenges, will unlock substantial growth potential. Strategic collaborations and mergers will continue to shape the competitive landscape, driving consolidation and fostering the development of advanced treatment modalities. The focus will remain on improving the quality of life for PAH patients and ultimately seeking curative solutions.
PAH Industry Segmentation
-
1. Drug Class
- 1.1. Prostacyclin and Prostacyclin Analogs
- 1.2. Calcium Channel Blockers
- 1.3. Phosphodiesterase 5 (PDE-5)
- 1.4. Endothelin Receptor Antagonists (ERA)
- 1.5. Others
PAH Industry Segmentation By Geography
-
1. North America
- 1.1. United States
- 1.2. Canada
- 1.3. Mexico
-
2. Europe
- 2.1. Germany
- 2.2. United Kingdom
- 2.3. France
- 2.4. Italy
- 2.5. Spain
- 2.6. Rest of Europe
-
3. Asia Pacific
- 3.1. China
- 3.2. Japan
- 3.3. India
- 3.4. Australia
- 3.5. South Korea
- 3.6. Rest of Asia Pacific
-
4. Middle East and Africa
- 4.1. GCC
- 4.2. South Africa
- 4.3. Rest of Middle East and Africa
-
5. South America
- 5.1. Brazil
- 5.2. Argentina
- 5.3. Rest of South America

PAH Industry Regional Market Share
Geographic Coverage of PAH Industry
PAH Industry REPORT HIGHLIGHTS
| Aspects | Details |
|---|---|
| Study Period | 2020-2034 |
| Base Year | 2025 |
| Estimated Year | 2026 |
| Forecast Period | 2026-2034 |
| Historical Period | 2020-2025 |
| Growth Rate | CAGR of 5.4% from 2020-2034 |
| Segmentation |
|
Table of Contents
- 1. Introduction
- 1.1. Research Scope
- 1.2. Market Segmentation
- 1.3. Research Objective
- 1.4. Definitions and Assumptions
- 2. Executive Summary
- 2.1. Market Snapshot
- 3. Market Dynamics
- 3.1. Market Drivers
- 3.2. Market Restrains
- 3.3. Market Trends
- 3.4. Market Opportunities
- 4. Market Factor Analysis
- 4.1. Porters Five Forces
- 4.1.1. Bargaining Power of Suppliers
- 4.1.2. Bargaining Power of Buyers
- 4.1.3. Threat of New Entrants
- 4.1.4. Threat of Substitutes
- 4.1.5. Competitive Rivalry
- 4.2. PESTEL analysis
- 4.3. BCG Analysis
- 4.3.1. Stars (High Growth, High Market Share)
- 4.3.2. Cash Cows (Low Growth, High Market Share)
- 4.3.3. Question Mark (High Growth, Low Market Share)
- 4.3.4. Dogs (Low Growth, Low Market Share)
- 4.4. Ansoff Matrix Analysis
- 4.5. Supply Chain Analysis
- 4.6. Regulatory Landscape
- 4.7. Current Market Potential and Opportunity Assessment (TAM–SAM–SOM Framework)
- 4.8. MDP Analyst Note
- 4.1. Porters Five Forces
- 5. Market Analysis, Insights and Forecast 2021-2033
- 5.1. Market Analysis, Insights and Forecast - by Drug Class
- 5.1.1. Prostacyclin and Prostacyclin Analogs
- 5.1.2. Calcium Channel Blockers
- 5.1.3. Phosphodiesterase 5 (PDE-5)
- 5.1.4. Endothelin Receptor Antagonists (ERA)
- 5.1.5. Others
- 5.2. Market Analysis, Insights and Forecast - by Region
- 5.2.1. North America
- 5.2.2. Europe
- 5.2.3. Asia Pacific
- 5.2.4. Middle East and Africa
- 5.2.5. South America
- 5.1. Market Analysis, Insights and Forecast - by Drug Class
- 6. Global PAH Industry Analysis, Insights and Forecast, 2021-2033
- 6.1. Market Analysis, Insights and Forecast - by Drug Class
- 6.1.1. Prostacyclin and Prostacyclin Analogs
- 6.1.2. Calcium Channel Blockers
- 6.1.3. Phosphodiesterase 5 (PDE-5)
- 6.1.4. Endothelin Receptor Antagonists (ERA)
- 6.1.5. Others
- 6.1. Market Analysis, Insights and Forecast - by Drug Class
- 7. North America PAH Industry Analysis, Insights and Forecast, 2020-2032
- 7.1. Market Analysis, Insights and Forecast - by Drug Class
- 7.1.1. Prostacyclin and Prostacyclin Analogs
- 7.1.2. Calcium Channel Blockers
- 7.1.3. Phosphodiesterase 5 (PDE-5)
- 7.1.4. Endothelin Receptor Antagonists (ERA)
- 7.1.5. Others
- 7.1. Market Analysis, Insights and Forecast - by Drug Class
- 8. Europe PAH Industry Analysis, Insights and Forecast, 2020-2032
- 8.1. Market Analysis, Insights and Forecast - by Drug Class
- 8.1.1. Prostacyclin and Prostacyclin Analogs
- 8.1.2. Calcium Channel Blockers
- 8.1.3. Phosphodiesterase 5 (PDE-5)
- 8.1.4. Endothelin Receptor Antagonists (ERA)
- 8.1.5. Others
- 8.1. Market Analysis, Insights and Forecast - by Drug Class
- 9. Asia Pacific PAH Industry Analysis, Insights and Forecast, 2020-2032
- 9.1. Market Analysis, Insights and Forecast - by Drug Class
- 9.1.1. Prostacyclin and Prostacyclin Analogs
- 9.1.2. Calcium Channel Blockers
- 9.1.3. Phosphodiesterase 5 (PDE-5)
- 9.1.4. Endothelin Receptor Antagonists (ERA)
- 9.1.5. Others
- 9.1. Market Analysis, Insights and Forecast - by Drug Class
- 10. Middle East and Africa PAH Industry Analysis, Insights and Forecast, 2020-2032
- 10.1. Market Analysis, Insights and Forecast - by Drug Class
- 10.1.1. Prostacyclin and Prostacyclin Analogs
- 10.1.2. Calcium Channel Blockers
- 10.1.3. Phosphodiesterase 5 (PDE-5)
- 10.1.4. Endothelin Receptor Antagonists (ERA)
- 10.1.5. Others
- 10.1. Market Analysis, Insights and Forecast - by Drug Class
- 11. South America PAH Industry Analysis, Insights and Forecast, 2020-2032
- 11.1. Market Analysis, Insights and Forecast - by Drug Class
- 11.1.1. Prostacyclin and Prostacyclin Analogs
- 11.1.2. Calcium Channel Blockers
- 11.1.3. Phosphodiesterase 5 (PDE-5)
- 11.1.4. Endothelin Receptor Antagonists (ERA)
- 11.1.5. Others
- 11.1. Market Analysis, Insights and Forecast - by Drug Class
- 12. Competitive Analysis
- 12.1. Company Profiles
- 12.1.1 Bayer AG
- 12.1.1.1. Company Overview
- 12.1.1.2. Products
- 12.1.1.3. Company Financials
- 12.1.1.4. SWOT Analysis
- 12.1.2 Novartis International AG
- 12.1.2.1. Company Overview
- 12.1.2.2. Products
- 12.1.2.3. Company Financials
- 12.1.2.4. SWOT Analysis
- 12.1.3 Merck & Co Inc
- 12.1.3.1. Company Overview
- 12.1.3.2. Products
- 12.1.3.3. Company Financials
- 12.1.3.4. SWOT Analysis
- 12.1.4 GlaxoSmithKline Plc
- 12.1.4.1. Company Overview
- 12.1.4.2. Products
- 12.1.4.3. Company Financials
- 12.1.4.4. SWOT Analysis
- 12.1.5 Arena Pharmaceuticals
- 12.1.5.1. Company Overview
- 12.1.5.2. Products
- 12.1.5.3. Company Financials
- 12.1.5.4. SWOT Analysis
- 12.1.6 Johnson & Johnson (Actelion Pharmaceuticals Ltd )
- 12.1.6.1. Company Overview
- 12.1.6.2. Products
- 12.1.6.3. Company Financials
- 12.1.6.4. SWOT Analysis
- 12.1.7 Gilead Sciences Inc
- 12.1.7.1. Company Overview
- 12.1.7.2. Products
- 12.1.7.3. Company Financials
- 12.1.7.4. SWOT Analysis
- 12.1.8 Bristol-Myers Squibb Company
- 12.1.8.1. Company Overview
- 12.1.8.2. Products
- 12.1.8.3. Company Financials
- 12.1.8.4. SWOT Analysis
- 12.1.9 United Therapeutics Corporation
- 12.1.9.1. Company Overview
- 12.1.9.2. Products
- 12.1.9.3. Company Financials
- 12.1.9.4. SWOT Analysis
- 12.1.10 Pfizer Inc
- 12.1.10.1. Company Overview
- 12.1.10.2. Products
- 12.1.10.3. Company Financials
- 12.1.10.4. SWOT Analysis
- 12.1.1 Bayer AG
- 12.2. Market Entropy
- 12.2.1 Company's Key Areas Served
- 12.2.2 Recent Developments
- 12.3. Company Market Share Analysis 2025
- 12.3.1 Top 5 Companies Market Share Analysis
- 12.3.2 Top 3 Companies Market Share Analysis
- 12.4. List of Potential Customers
- 13. Research Methodology
List of Figures
- Figure 1: Global PAH Industry Revenue Breakdown (billion, %) by Region 2025 & 2033
- Figure 2: Global PAH Industry Volume Breakdown (K Unit, %) by Region 2025 & 2033
- Figure 3: North America PAH Industry Revenue (billion), by Drug Class 2025 & 2033
- Figure 4: North America PAH Industry Volume (K Unit), by Drug Class 2025 & 2033
- Figure 5: North America PAH Industry Revenue Share (%), by Drug Class 2025 & 2033
- Figure 6: North America PAH Industry Volume Share (%), by Drug Class 2025 & 2033
- Figure 7: North America PAH Industry Revenue (billion), by Country 2025 & 2033
- Figure 8: North America PAH Industry Volume (K Unit), by Country 2025 & 2033
- Figure 9: North America PAH Industry Revenue Share (%), by Country 2025 & 2033
- Figure 10: North America PAH Industry Volume Share (%), by Country 2025 & 2033
- Figure 11: Europe PAH Industry Revenue (billion), by Drug Class 2025 & 2033
- Figure 12: Europe PAH Industry Volume (K Unit), by Drug Class 2025 & 2033
- Figure 13: Europe PAH Industry Revenue Share (%), by Drug Class 2025 & 2033
- Figure 14: Europe PAH Industry Volume Share (%), by Drug Class 2025 & 2033
- Figure 15: Europe PAH Industry Revenue (billion), by Country 2025 & 2033
- Figure 16: Europe PAH Industry Volume (K Unit), by Country 2025 & 2033
- Figure 17: Europe PAH Industry Revenue Share (%), by Country 2025 & 2033
- Figure 18: Europe PAH Industry Volume Share (%), by Country 2025 & 2033
- Figure 19: Asia Pacific PAH Industry Revenue (billion), by Drug Class 2025 & 2033
- Figure 20: Asia Pacific PAH Industry Volume (K Unit), by Drug Class 2025 & 2033
- Figure 21: Asia Pacific PAH Industry Revenue Share (%), by Drug Class 2025 & 2033
- Figure 22: Asia Pacific PAH Industry Volume Share (%), by Drug Class 2025 & 2033
- Figure 23: Asia Pacific PAH Industry Revenue (billion), by Country 2025 & 2033
- Figure 24: Asia Pacific PAH Industry Volume (K Unit), by Country 2025 & 2033
- Figure 25: Asia Pacific PAH Industry Revenue Share (%), by Country 2025 & 2033
- Figure 26: Asia Pacific PAH Industry Volume Share (%), by Country 2025 & 2033
- Figure 27: Middle East and Africa PAH Industry Revenue (billion), by Drug Class 2025 & 2033
- Figure 28: Middle East and Africa PAH Industry Volume (K Unit), by Drug Class 2025 & 2033
- Figure 29: Middle East and Africa PAH Industry Revenue Share (%), by Drug Class 2025 & 2033
- Figure 30: Middle East and Africa PAH Industry Volume Share (%), by Drug Class 2025 & 2033
- Figure 31: Middle East and Africa PAH Industry Revenue (billion), by Country 2025 & 2033
- Figure 32: Middle East and Africa PAH Industry Volume (K Unit), by Country 2025 & 2033
- Figure 33: Middle East and Africa PAH Industry Revenue Share (%), by Country 2025 & 2033
- Figure 34: Middle East and Africa PAH Industry Volume Share (%), by Country 2025 & 2033
- Figure 35: South America PAH Industry Revenue (billion), by Drug Class 2025 & 2033
- Figure 36: South America PAH Industry Volume (K Unit), by Drug Class 2025 & 2033
- Figure 37: South America PAH Industry Revenue Share (%), by Drug Class 2025 & 2033
- Figure 38: South America PAH Industry Volume Share (%), by Drug Class 2025 & 2033
- Figure 39: South America PAH Industry Revenue (billion), by Country 2025 & 2033
- Figure 40: South America PAH Industry Volume (K Unit), by Country 2025 & 2033
- Figure 41: South America PAH Industry Revenue Share (%), by Country 2025 & 2033
- Figure 42: South America PAH Industry Volume Share (%), by Country 2025 & 2033
List of Tables
- Table 1: Global PAH Industry Revenue billion Forecast, by Drug Class 2020 & 2033
- Table 2: Global PAH Industry Volume K Unit Forecast, by Drug Class 2020 & 2033
- Table 3: Global PAH Industry Revenue billion Forecast, by Region 2020 & 2033
- Table 4: Global PAH Industry Volume K Unit Forecast, by Region 2020 & 2033
- Table 5: Global PAH Industry Revenue billion Forecast, by Drug Class 2020 & 2033
- Table 6: Global PAH Industry Volume K Unit Forecast, by Drug Class 2020 & 2033
- Table 7: Global PAH Industry Revenue billion Forecast, by Country 2020 & 2033
- Table 8: Global PAH Industry Volume K Unit Forecast, by Country 2020 & 2033
- Table 9: United States PAH Industry Revenue (billion) Forecast, by Application 2020 & 2033
- Table 10: United States PAH Industry Volume (K Unit) Forecast, by Application 2020 & 2033
- Table 11: Canada PAH Industry Revenue (billion) Forecast, by Application 2020 & 2033
- Table 12: Canada PAH Industry Volume (K Unit) Forecast, by Application 2020 & 2033
- Table 13: Mexico PAH Industry Revenue (billion) Forecast, by Application 2020 & 2033
- Table 14: Mexico PAH Industry Volume (K Unit) Forecast, by Application 2020 & 2033
- Table 15: Global PAH Industry Revenue billion Forecast, by Drug Class 2020 & 2033
- Table 16: Global PAH Industry Volume K Unit Forecast, by Drug Class 2020 & 2033
- Table 17: Global PAH Industry Revenue billion Forecast, by Country 2020 & 2033
- Table 18: Global PAH Industry Volume K Unit Forecast, by Country 2020 & 2033
- Table 19: Germany PAH Industry Revenue (billion) Forecast, by Application 2020 & 2033
- Table 20: Germany PAH Industry Volume (K Unit) Forecast, by Application 2020 & 2033
- Table 21: United Kingdom PAH Industry Revenue (billion) Forecast, by Application 2020 & 2033
- Table 22: United Kingdom PAH Industry Volume (K Unit) Forecast, by Application 2020 & 2033
- Table 23: France PAH Industry Revenue (billion) Forecast, by Application 2020 & 2033
- Table 24: France PAH Industry Volume (K Unit) Forecast, by Application 2020 & 2033
- Table 25: Italy PAH Industry Revenue (billion) Forecast, by Application 2020 & 2033
- Table 26: Italy PAH Industry Volume (K Unit) Forecast, by Application 2020 & 2033
- Table 27: Spain PAH Industry Revenue (billion) Forecast, by Application 2020 & 2033
- Table 28: Spain PAH Industry Volume (K Unit) Forecast, by Application 2020 & 2033
- Table 29: Rest of Europe PAH Industry Revenue (billion) Forecast, by Application 2020 & 2033
- Table 30: Rest of Europe PAH Industry Volume (K Unit) Forecast, by Application 2020 & 2033
- Table 31: Global PAH Industry Revenue billion Forecast, by Drug Class 2020 & 2033
- Table 32: Global PAH Industry Volume K Unit Forecast, by Drug Class 2020 & 2033
- Table 33: Global PAH Industry Revenue billion Forecast, by Country 2020 & 2033
- Table 34: Global PAH Industry Volume K Unit Forecast, by Country 2020 & 2033
- Table 35: China PAH Industry Revenue (billion) Forecast, by Application 2020 & 2033
- Table 36: China PAH Industry Volume (K Unit) Forecast, by Application 2020 & 2033
- Table 37: Japan PAH Industry Revenue (billion) Forecast, by Application 2020 & 2033
- Table 38: Japan PAH Industry Volume (K Unit) Forecast, by Application 2020 & 2033
- Table 39: India PAH Industry Revenue (billion) Forecast, by Application 2020 & 2033
- Table 40: India PAH Industry Volume (K Unit) Forecast, by Application 2020 & 2033
- Table 41: Australia PAH Industry Revenue (billion) Forecast, by Application 2020 & 2033
- Table 42: Australia PAH Industry Volume (K Unit) Forecast, by Application 2020 & 2033
- Table 43: South Korea PAH Industry Revenue (billion) Forecast, by Application 2020 & 2033
- Table 44: South Korea PAH Industry Volume (K Unit) Forecast, by Application 2020 & 2033
- Table 45: Rest of Asia Pacific PAH Industry Revenue (billion) Forecast, by Application 2020 & 2033
- Table 46: Rest of Asia Pacific PAH Industry Volume (K Unit) Forecast, by Application 2020 & 2033
- Table 47: Global PAH Industry Revenue billion Forecast, by Drug Class 2020 & 2033
- Table 48: Global PAH Industry Volume K Unit Forecast, by Drug Class 2020 & 2033
- Table 49: Global PAH Industry Revenue billion Forecast, by Country 2020 & 2033
- Table 50: Global PAH Industry Volume K Unit Forecast, by Country 2020 & 2033
- Table 51: GCC PAH Industry Revenue (billion) Forecast, by Application 2020 & 2033
- Table 52: GCC PAH Industry Volume (K Unit) Forecast, by Application 2020 & 2033
- Table 53: South Africa PAH Industry Revenue (billion) Forecast, by Application 2020 & 2033
- Table 54: South Africa PAH Industry Volume (K Unit) Forecast, by Application 2020 & 2033
- Table 55: Rest of Middle East and Africa PAH Industry Revenue (billion) Forecast, by Application 2020 & 2033
- Table 56: Rest of Middle East and Africa PAH Industry Volume (K Unit) Forecast, by Application 2020 & 2033
- Table 57: Global PAH Industry Revenue billion Forecast, by Drug Class 2020 & 2033
- Table 58: Global PAH Industry Volume K Unit Forecast, by Drug Class 2020 & 2033
- Table 59: Global PAH Industry Revenue billion Forecast, by Country 2020 & 2033
- Table 60: Global PAH Industry Volume K Unit Forecast, by Country 2020 & 2033
- Table 61: Brazil PAH Industry Revenue (billion) Forecast, by Application 2020 & 2033
- Table 62: Brazil PAH Industry Volume (K Unit) Forecast, by Application 2020 & 2033
- Table 63: Argentina PAH Industry Revenue (billion) Forecast, by Application 2020 & 2033
- Table 64: Argentina PAH Industry Volume (K Unit) Forecast, by Application 2020 & 2033
- Table 65: Rest of South America PAH Industry Revenue (billion) Forecast, by Application 2020 & 2033
- Table 66: Rest of South America PAH Industry Volume (K Unit) Forecast, by Application 2020 & 2033
Frequently Asked Questions
1. What is the projected Compound Annual Growth Rate (CAGR) of the PAH Industry?
The projected CAGR is approximately 5.4%.
2. Which companies are prominent players in the PAH Industry?
Key companies in the market include Bayer AG, Novartis International AG, Merck & Co Inc, GlaxoSmithKline Plc, Arena Pharmaceuticals, Johnson & Johnson (Actelion Pharmaceuticals Ltd ), Gilead Sciences Inc, Bristol-Myers Squibb Company, United Therapeutics Corporation, Pfizer Inc.
3. What are the main segments of the PAH Industry?
The market segments include Drug Class.
4. Can you provide details about the market size?
The market size is estimated to be USD 8.7 billion as of 2022.
5. What are some drivers contributing to market growth?
Growing Burden of Pulmonary Arterial Hypertension; Government and Private Support for the Development of Orphan Drugs.
6. What are the notable trends driving market growth?
Prostacyclin and Prostacyclin Analogs Segment is Expected to Observe Better Growth Over the Forecast Period.
7. Are there any restraints impacting market growth?
Patent Expiration of Drug Molecule; Side Effects Associated with the Drugs.
8. Can you provide examples of recent developments in the market?
In July 2022, Cereno Scientific announced that the first patient had been enrolled in the Phase II study in pulmonary arterial hypertension (PAH) with drug candidate CS1.
9. What pricing options are available for accessing the report?
Pricing options include single-user, multi-user, and enterprise licenses priced at USD 4750, USD 5250, and USD 8750 respectively.
10. Is the market size provided in terms of value or volume?
The market size is provided in terms of value, measured in billion and volume, measured in K Unit.
11. Are there any specific market keywords associated with the report?
Yes, the market keyword associated with the report is "PAH Industry," which aids in identifying and referencing the specific market segment covered.
12. How do I determine which pricing option suits my needs best?
The pricing options vary based on user requirements and access needs. Individual users may opt for single-user licenses, while businesses requiring broader access may choose multi-user or enterprise licenses for cost-effective access to the report.
13. Are there any additional resources or data provided in the PAH Industry report?
While the report offers comprehensive insights, it's advisable to review the specific contents or supplementary materials provided to ascertain if additional resources or data are available.
14. How can I stay updated on further developments or reports in the PAH Industry?
To stay informed about further developments, trends, and reports in the PAH Industry, consider subscribing to industry newsletters, following relevant companies and organizations, or regularly checking reputable industry news sources and publications.
Methodology
Step 1 - Identification of Relevant Samples Size from Population Database


Step 2 - Approaches for Defining Global Market Size (Value, Volume* & Price*)

Note*: In applicable scenarios
Step 3 - Data Sources
Primary Research
- Web Analytics
- Survey Reports
- Research Institute
- Latest Research Reports
- Opinion Leaders
Secondary Research
- Annual Reports
- White Paper
- Latest Press Release
- Industry Association
- Paid Database
- Investor Presentations

Step 4 - Data Triangulation
Involves using different sources of information in order to increase the validity of a study
These sources are likely to be stakeholders in a program - participants, other researchers, program staff, other community members, and so on.
Then we put all data in single framework & apply various statistical tools to find out the dynamic on the market.
During the analysis stage, feedback from the stakeholder groups would be compared to determine areas of agreement as well as areas of divergence