

Key Insights
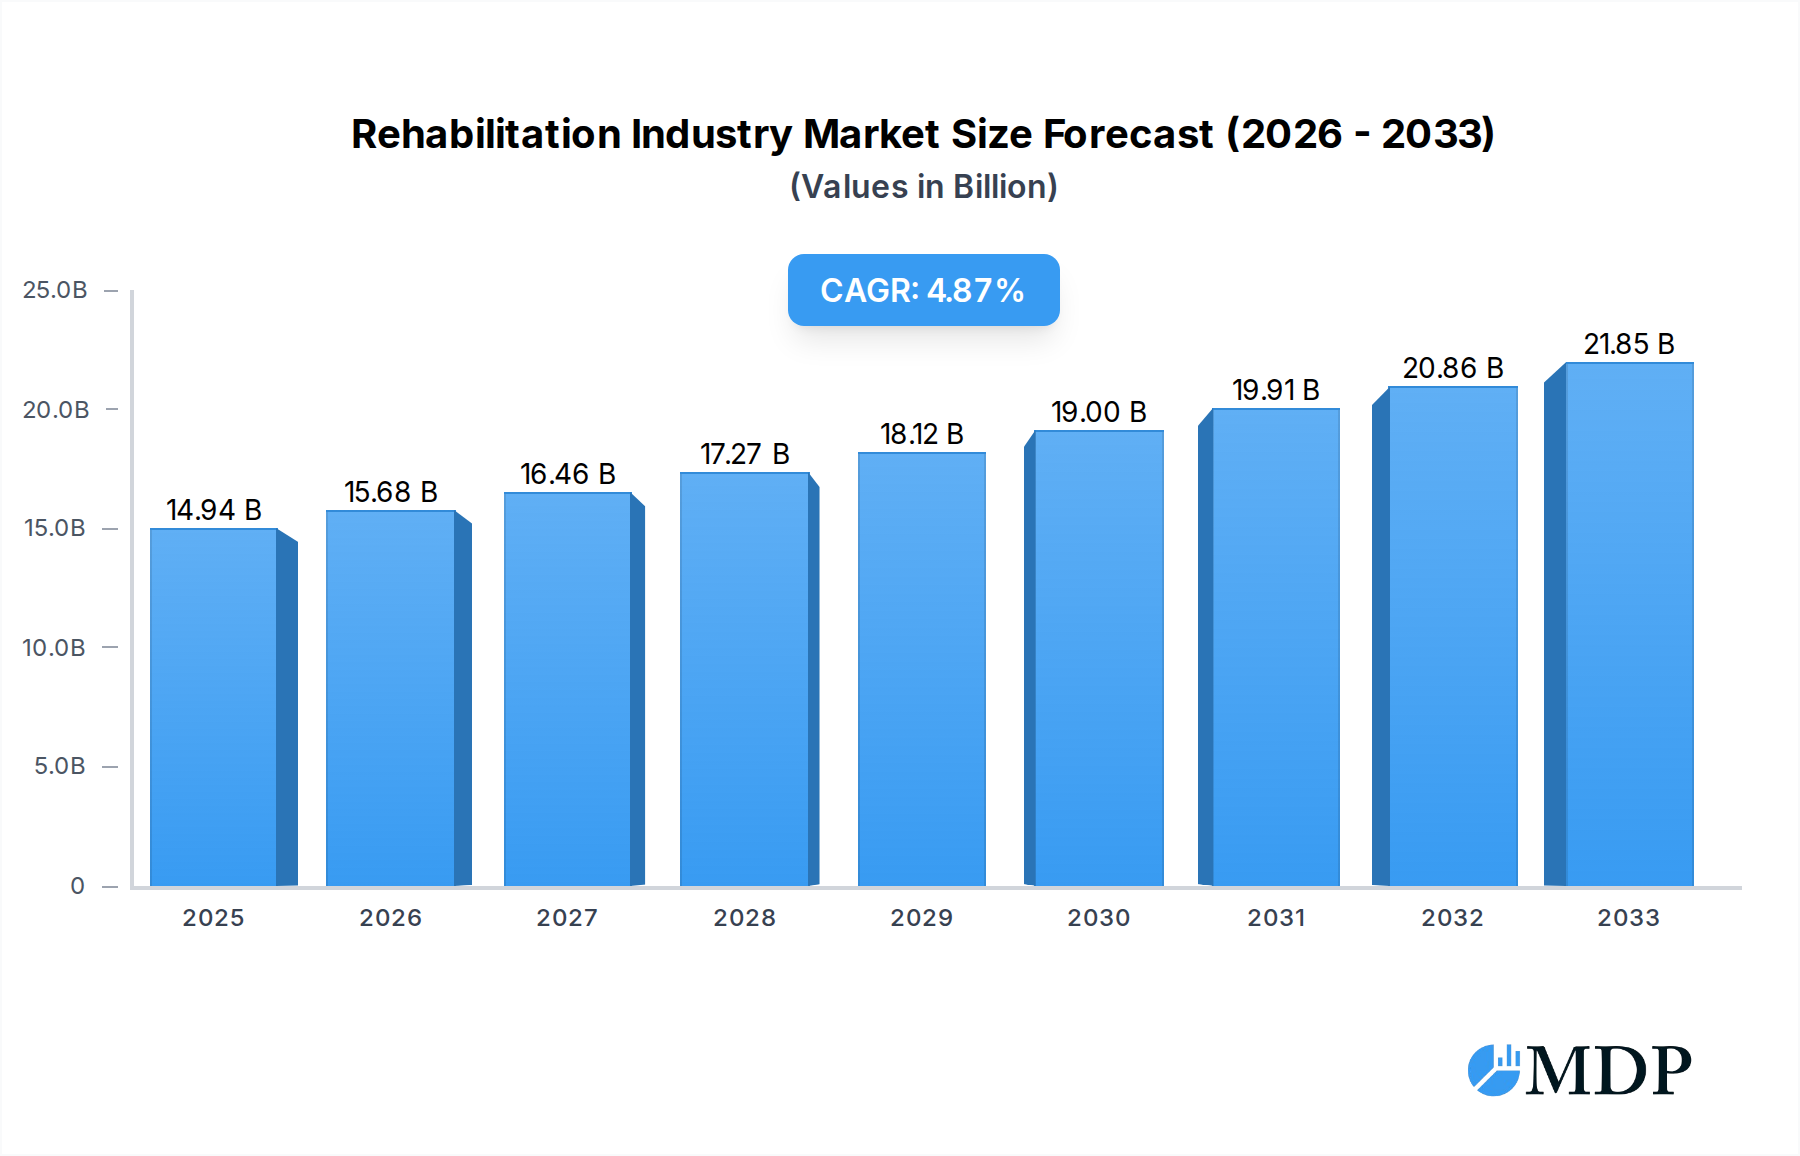
The global Rehabilitation Industry is poised for significant expansion, with a projected market size of $14.94 billion by 2025. This growth is fueled by a robust CAGR of 4.92%, indicating a consistent upward trajectory throughout the forecast period. Key drivers propelling this market include the increasing prevalence of chronic diseases, a growing aging population demanding advanced assistive devices, and a heightened awareness of rehabilitation's crucial role in post-injury and post-surgery recovery. Technological advancements, such as the integration of robotics and AI in rehabilitation equipment and therapies, are also playing a pivotal role in driving innovation and improving patient outcomes. The rising adoption of rehabilitation solutions in physiotherapy and occupational therapy settings further underpins this positive market outlook.

Rehabilitation Industry Market Size (In Billion)
The market segmentation reveals diverse opportunities across various product types, including daily living aids, exercise equipment, body support devices, and mobility equipment. Daily living aids, encompassing medical beds and bathroom/toilet assist devices, are expected to see sustained demand due to an aging global population. Mobility equipment, such as walking assist devices and wheelchairs, will continue to be vital for enhancing independence and quality of life for individuals with mobility impairments. Geographically, North America and Europe are currently leading the market, driven by advanced healthcare infrastructure and high adoption rates of rehabilitation technologies. However, the Asia Pacific region presents significant growth potential due to expanding healthcare investments, increasing disposable incomes, and a rising burden of lifestyle-related diseases. Restraints such as high initial costs of advanced equipment and reimbursement challenges in certain regions are present but are being gradually overcome by technological innovation and increasing insurance coverage.
Rehabilitation Industry Company Market Share
Unlock the Future of Physical Therapy and Assistive Technology: A Comprehensive Rehabilitation Industry Market Report
This in-depth report provides a 360-degree view of the global Rehabilitation Industry, forecasting significant growth and detailing key trends from 2019 to 2033. With a base year of 2025 and a forecast period extending to 2033, this study is an indispensable resource for understanding market dynamics, technological advancements, and investment opportunities within this rapidly evolving sector. Discover the impact of innovations in daily living aids, exercise equipment, body support devices, and mobility solutions on physiotherapy and occupational therapy applications across hospitals, rehab centers, and other end-users.
Rehabilitation Industry Market Dynamics & Concentration
The rehabilitation industry is characterized by a moderate to high degree of market concentration, with several key players holding significant market share, estimated to be over 60% for the top five companies. Innovation drivers are primarily fueled by the increasing prevalence of chronic diseases, an aging global population, and a growing awareness of the benefits of rehabilitation services. Regulatory frameworks, while often stringent, are also adapting to encourage the adoption of new technologies and improve patient outcomes. Product substitutes exist, particularly in less technologically advanced solutions, but the trend is towards sophisticated, evidence-based interventions. End-user trends show a clear shift towards home-based rehabilitation and personalized therapy programs, driving demand for user-friendly and connected devices. Mergers and acquisitions (M&A) activities have been steady, with an estimated XX M&A deals recorded annually between 2021 and 2024, signaling consolidation and strategic expansion by leading companies.
- Market Share Concentration: Top 5 players command over 60% market share.
- Innovation Drivers: Chronic disease prevalence, aging population, rehabilitation awareness.
- Regulatory Influence: Evolving frameworks supporting technological adoption.
- Product Substitution: Limited impact from traditional alternatives on advanced solutions.
- End-User Trends: Growing demand for home-based and personalized rehabilitation.
- M&A Activity: XX deals annually (2021-2024), indicative of consolidation.
Rehabilitation Industry Industry Trends & Analysis
The global rehabilitation industry is poised for substantial growth, projected to expand at a Compound Annual Growth Rate (CAGR) of approximately XX% during the forecast period of 2025–2033. This upward trajectory is underpinned by a confluence of powerful market growth drivers. The escalating burden of age-related conditions, neurological disorders, and musculoskeletal injuries worldwide is creating an unprecedented demand for effective rehabilitation solutions. Technological disruptions are at the forefront of this evolution, with advancements in robotics, artificial intelligence (AI), virtual reality (VR), and wearable sensors revolutionizing how therapy is delivered and monitored. These innovations are not only enhancing treatment efficacy but also improving patient engagement and adherence to rehabilitation programs. Consumer preferences are increasingly leaning towards convenient, accessible, and personalized care, fostering the growth of telehealth and home-based rehabilitation services. This shift is compelling manufacturers to develop intuitive, portable, and data-driven devices. Competitive dynamics are intensifying, with established players and emerging startups vying for market dominance through product differentiation, strategic partnerships, and a focus on unmet clinical needs. Market penetration for advanced rehabilitation technologies is steadily increasing, particularly in developed economies, as healthcare providers and payers recognize the long-term cost-effectiveness and improved quality of life offered by these interventions. The integration of digital health platforms and data analytics is further optimizing treatment pathways and demonstrating measurable patient outcomes, which in turn fuels further investment and innovation in the sector.
Leading Markets & Segments in Rehabilitation Industry
North America currently dominates the global rehabilitation industry market, driven by robust healthcare infrastructure, high adoption rates of advanced medical technologies, and significant government and private investments in healthcare research and development. Within North America, the United States leads as the largest national market, owing to its large patient population, a high concentration of leading rehabilitation centers and hospitals, and favorable reimbursement policies for rehabilitation services.
Dominant Segments by Product Type:
- Daily Living Aids: This segment is a major contributor, with Medical Beds and Bathroom and Toilet Assist Devices experiencing sustained demand due to the aging population and increased awareness of home safety and accessibility. The market for these products is projected to reach over $XX Billion by 2033.
- Mobility Equipment: Wheelchairs and Scooters represent another substantial segment, driven by the growing incidence of mobility impairments and the desire for greater independence among patients. The market for advanced mobility solutions is experiencing rapid innovation.
- Exercise Equipment: Both Upper Body and Lower Body Exercise Equipment are crucial, with a growing emphasis on technologically advanced devices that offer personalized training and progress tracking.
Dominant Segments by Application:
- Physiotherapy: This is the largest application segment, accounting for over XX% of the market share. The increasing demand for post-operative care, sports injury rehabilitation, and management of chronic pain conditions fuels its dominance.
- Occupational Therapy: This segment is also experiencing significant growth, focusing on helping individuals regain skills for daily living and work.
Dominant Segments by End-User:
- Hospitals: As primary healthcare providers, hospitals represent a substantial end-user segment, utilizing a wide array of rehabilitation equipment for inpatient and outpatient services.
- Rehab Centers: Dedicated rehabilitation centers are key consumers, offering specialized programs and requiring advanced therapeutic equipment.
Key Drivers of Dominance:
- Economic Policies: Favorable healthcare reimbursement policies and government initiatives supporting patient recovery and independence.
- Infrastructure: Well-developed healthcare and hospital networks, and increasing investment in specialized rehabilitation facilities.
- Technological Adoption: High propensity to adopt cutting-edge rehabilitation technologies and digital health solutions.
- Demographic Shifts: A significant aging population requiring long-term care and rehabilitation services.
Rehabilitation Industry Product Developments
The rehabilitation industry is witnessing a surge in product innovations aimed at enhancing patient recovery, engagement, and independence. Wearable rehabilitation devices, such as those launched by Lusio Rehab, are integrating gamification and advanced sensor technology to motivate patients during physical therapy. Robotic exoskeletons are becoming more sophisticated, offering advanced mobility assistance and enabling individuals with severe impairments to walk. Furthermore, the integration of AI and virtual reality is creating immersive and personalized therapy experiences, leading to improved outcomes. These developments are driven by a need for more effective, accessible, and patient-centric rehabilitation solutions, providing significant competitive advantages to companies at the forefront of R&D.
Key Drivers of Rehabilitation Industry Growth
Several key drivers are propelling the growth of the rehabilitation industry. Technological advancements, particularly in robotics, AI, and wearable sensors, are creating more effective and engaging therapeutic solutions. The increasing global prevalence of chronic diseases and an aging population are creating a sustained demand for rehabilitation services and assistive devices. Favorable regulatory frameworks and government initiatives aimed at improving healthcare access and patient outcomes also play a crucial role. Furthermore, a growing societal emphasis on quality of life and functional independence is encouraging greater adoption of rehabilitation technologies by individuals and healthcare providers alike.
Challenges in the Rehabilitation Industry Market
Despite its promising growth, the rehabilitation industry faces several challenges. High upfront costs associated with advanced rehabilitation technologies can be a barrier to widespread adoption, especially in resource-constrained settings. Stringent regulatory approval processes for new medical devices can lead to extended market entry timelines. Supply chain disruptions and the need for skilled healthcare professionals to operate and maintain sophisticated equipment also pose significant hurdles. Additionally, intense competition among established players and emerging startups can lead to price pressures and necessitate continuous innovation to maintain market share.
Emerging Opportunities in Rehabilitation Industry
Emerging opportunities in the rehabilitation industry are largely driven by technological breakthroughs and evolving healthcare models. The continued development of AI-powered diagnostics and personalized treatment plans presents a significant opportunity for enhanced therapeutic efficacy. The expansion of telehealth and remote patient monitoring platforms offers a scalable model for delivering rehabilitation services, particularly in underserved areas. Strategic partnerships between technology companies, healthcare providers, and research institutions are fostering innovation and accelerating the development of next-generation rehabilitation solutions. Furthermore, the growing focus on preventative rehabilitation and wellness programs presents a new avenue for market expansion and revenue generation.
Leading Players in the Rehabilitation Industry Sector
- GF HEALTH PRODUCTS INC
- Invacare Corporation
- Marsi Bionics SL
- Hill-Rom Services INC
- Drive DeVilbiss Healthcare
- Dynatronics Corporation
- Ekso Bionics
- ReWalk Robotics
- Caremax Rehabilitation Equipment Co Ltd
- ULS Robotics Co Ltd
- Medline Industries Inc
- Roma Medical Aids Ltd
- Hospital Equipment Mfg Co
Key Milestones in Rehabilitation Industry Industry
- February 2022: Lusio Rehab launched a wearable rehabilitation device called LusioMATE at Arab Health 2022, designed to enhance patient motivation in physical therapy.
- January 2022: EVOSONICS, a sound vibration-based healthcare company, showcased sleep tech, rehabilitation, and obesity management devices at CES 2022.
Strategic Outlook for Rehabilitation Industry Market
The strategic outlook for the rehabilitation industry market remains exceptionally strong, driven by persistent demand and ongoing technological innovation. Future growth will be accelerated by the increasing integration of digital health, AI, and robotics into therapeutic workflows. Strategic opportunities lie in expanding access to rehabilitation services through telehealth and developing more affordable, user-friendly assistive devices. Companies that focus on personalized patient care, data-driven outcomes, and strategic collaborations with healthcare providers and payers will be well-positioned to capitalize on the substantial market potential and achieve sustained success in this dynamic sector.
Rehabilitation Industry Segmentation
-
1. Product Type
-
1.1. Daily Living Aids
- 1.1.1. Medical Beds
- 1.1.2. Bathroom and Toilet Assist Devices
- 1.1.3. Reading Writing and Computer Aids
- 1.1.4. Other Daily Living Aids
-
1.2. Exercise Equipment
- 1.2.1. Upper Body Exercise Equipment
- 1.2.2. Lower Body Exercise Equipment
-
1.3. Body Support Devices
- 1.3.1. Patient Lifts
- 1.3.2. Medical Lifting Slings
-
1.4. Mobility Equipment
- 1.4.1. Walking Assist Devices
- 1.4.2. Wheelchairs and Scooters
-
1.1. Daily Living Aids
-
2. Application
- 2.1. Physiotherapy
- 2.2. Occupational Therapy
- 2.3. Other Applications
-
3. End-User
- 3.1. Hospitals
- 3.2. Rehab Centers
- 3.3. Others End-Users
Rehabilitation Industry Segmentation By Geography
-
1. North America
- 1.1. United States
- 1.2. Canada
- 1.3. Mexico
-
2. Europe
- 2.1. Germany
- 2.2. United Kingdom
- 2.3. France
- 2.4. Italy
- 2.5. Spain
- 2.6. Rest of Europe
-
3. Asia Pacific
- 3.1. China
- 3.2. Japan
- 3.3. India
- 3.4. Australia
- 3.5. South Korea
- 3.6. Rest of Asia Pacific
-
4. Middle East and Africa
- 4.1. GCC
- 4.2. South Africa
- 4.3. Rest of Middle East and Africa
-
5. South America
- 5.1. Brazil
- 5.2. Argentina
- 5.3. Rest of South America

Rehabilitation Industry Regional Market Share
Geographic Coverage of Rehabilitation Industry
Rehabilitation Industry REPORT HIGHLIGHTS
| Aspects | Details |
|---|---|
| Study Period | 2020-2034 |
| Base Year | 2025 |
| Estimated Year | 2026 |
| Forecast Period | 2026-2034 |
| Historical Period | 2020-2025 |
| Growth Rate | CAGR of 4.92% from 2020-2034 |
| Segmentation |
|
Table of Contents
- 1. Introduction
- 1.1. Research Scope
- 1.2. Market Segmentation
- 1.3. Research Objective
- 1.4. Definitions and Assumptions
- 2. Executive Summary
- 2.1. Market Snapshot
- 3. Market Dynamics
- 3.1. Market Drivers
- 3.2. Market Restrains
- 3.3. Market Trends
- 3.4. Market Opportunities
- 4. Market Factor Analysis
- 4.1. Porters Five Forces
- 4.1.1. Bargaining Power of Suppliers
- 4.1.2. Bargaining Power of Buyers
- 4.1.3. Threat of New Entrants
- 4.1.4. Threat of Substitutes
- 4.1.5. Competitive Rivalry
- 4.2. PESTEL analysis
- 4.3. BCG Analysis
- 4.3.1. Stars (High Growth, High Market Share)
- 4.3.2. Cash Cows (Low Growth, High Market Share)
- 4.3.3. Question Mark (High Growth, Low Market Share)
- 4.3.4. Dogs (Low Growth, Low Market Share)
- 4.4. Ansoff Matrix Analysis
- 4.5. Supply Chain Analysis
- 4.6. Regulatory Landscape
- 4.7. Current Market Potential and Opportunity Assessment (TAM–SAM–SOM Framework)
- 4.8. MDP Analyst Note
- 4.1. Porters Five Forces
- 5. Market Analysis, Insights and Forecast 2021-2033
- 5.1. Market Analysis, Insights and Forecast - by Product Type
- 5.1.1. Daily Living Aids
- 5.1.1.1. Medical Beds
- 5.1.1.2. Bathroom and Toilet Assist Devices
- 5.1.1.3. Reading Writing and Computer Aids
- 5.1.1.4. Other Daily Living Aids
- 5.1.2. Exercise Equipment
- 5.1.2.1. Upper Body Exercise Equipment
- 5.1.2.2. Lower Body Exercise Equipment
- 5.1.3. Body Support Devices
- 5.1.3.1. Patient Lifts
- 5.1.3.2. Medical Lifting Slings
- 5.1.4. Mobility Equipment
- 5.1.4.1. Walking Assist Devices
- 5.1.4.2. Wheelchairs and Scooters
- 5.1.1. Daily Living Aids
- 5.2. Market Analysis, Insights and Forecast - by Application
- 5.2.1. Physiotherapy
- 5.2.2. Occupational Therapy
- 5.2.3. Other Applications
- 5.3. Market Analysis, Insights and Forecast - by End-User
- 5.3.1. Hospitals
- 5.3.2. Rehab Centers
- 5.3.3. Others End-Users
- 5.4. Market Analysis, Insights and Forecast - by Region
- 5.4.1. North America
- 5.4.2. Europe
- 5.4.3. Asia Pacific
- 5.4.4. Middle East and Africa
- 5.4.5. South America
- 5.1. Market Analysis, Insights and Forecast - by Product Type
- 6. Global Rehabilitation Industry Analysis, Insights and Forecast, 2021-2033
- 6.1. Market Analysis, Insights and Forecast - by Product Type
- 6.1.1. Daily Living Aids
- 6.1.1.1. Medical Beds
- 6.1.1.2. Bathroom and Toilet Assist Devices
- 6.1.1.3. Reading Writing and Computer Aids
- 6.1.1.4. Other Daily Living Aids
- 6.1.2. Exercise Equipment
- 6.1.2.1. Upper Body Exercise Equipment
- 6.1.2.2. Lower Body Exercise Equipment
- 6.1.3. Body Support Devices
- 6.1.3.1. Patient Lifts
- 6.1.3.2. Medical Lifting Slings
- 6.1.4. Mobility Equipment
- 6.1.4.1. Walking Assist Devices
- 6.1.4.2. Wheelchairs and Scooters
- 6.1.1. Daily Living Aids
- 6.2. Market Analysis, Insights and Forecast - by Application
- 6.2.1. Physiotherapy
- 6.2.2. Occupational Therapy
- 6.2.3. Other Applications
- 6.3. Market Analysis, Insights and Forecast - by End-User
- 6.3.1. Hospitals
- 6.3.2. Rehab Centers
- 6.3.3. Others End-Users
- 6.1. Market Analysis, Insights and Forecast - by Product Type
- 7. North America Rehabilitation Industry Analysis, Insights and Forecast, 2020-2032
- 7.1. Market Analysis, Insights and Forecast - by Product Type
- 7.1.1. Daily Living Aids
- 7.1.1.1. Medical Beds
- 7.1.1.2. Bathroom and Toilet Assist Devices
- 7.1.1.3. Reading Writing and Computer Aids
- 7.1.1.4. Other Daily Living Aids
- 7.1.2. Exercise Equipment
- 7.1.2.1. Upper Body Exercise Equipment
- 7.1.2.2. Lower Body Exercise Equipment
- 7.1.3. Body Support Devices
- 7.1.3.1. Patient Lifts
- 7.1.3.2. Medical Lifting Slings
- 7.1.4. Mobility Equipment
- 7.1.4.1. Walking Assist Devices
- 7.1.4.2. Wheelchairs and Scooters
- 7.1.1. Daily Living Aids
- 7.2. Market Analysis, Insights and Forecast - by Application
- 7.2.1. Physiotherapy
- 7.2.2. Occupational Therapy
- 7.2.3. Other Applications
- 7.3. Market Analysis, Insights and Forecast - by End-User
- 7.3.1. Hospitals
- 7.3.2. Rehab Centers
- 7.3.3. Others End-Users
- 7.1. Market Analysis, Insights and Forecast - by Product Type
- 8. Europe Rehabilitation Industry Analysis, Insights and Forecast, 2020-2032
- 8.1. Market Analysis, Insights and Forecast - by Product Type
- 8.1.1. Daily Living Aids
- 8.1.1.1. Medical Beds
- 8.1.1.2. Bathroom and Toilet Assist Devices
- 8.1.1.3. Reading Writing and Computer Aids
- 8.1.1.4. Other Daily Living Aids
- 8.1.2. Exercise Equipment
- 8.1.2.1. Upper Body Exercise Equipment
- 8.1.2.2. Lower Body Exercise Equipment
- 8.1.3. Body Support Devices
- 8.1.3.1. Patient Lifts
- 8.1.3.2. Medical Lifting Slings
- 8.1.4. Mobility Equipment
- 8.1.4.1. Walking Assist Devices
- 8.1.4.2. Wheelchairs and Scooters
- 8.1.1. Daily Living Aids
- 8.2. Market Analysis, Insights and Forecast - by Application
- 8.2.1. Physiotherapy
- 8.2.2. Occupational Therapy
- 8.2.3. Other Applications
- 8.3. Market Analysis, Insights and Forecast - by End-User
- 8.3.1. Hospitals
- 8.3.2. Rehab Centers
- 8.3.3. Others End-Users
- 8.1. Market Analysis, Insights and Forecast - by Product Type
- 9. Asia Pacific Rehabilitation Industry Analysis, Insights and Forecast, 2020-2032
- 9.1. Market Analysis, Insights and Forecast - by Product Type
- 9.1.1. Daily Living Aids
- 9.1.1.1. Medical Beds
- 9.1.1.2. Bathroom and Toilet Assist Devices
- 9.1.1.3. Reading Writing and Computer Aids
- 9.1.1.4. Other Daily Living Aids
- 9.1.2. Exercise Equipment
- 9.1.2.1. Upper Body Exercise Equipment
- 9.1.2.2. Lower Body Exercise Equipment
- 9.1.3. Body Support Devices
- 9.1.3.1. Patient Lifts
- 9.1.3.2. Medical Lifting Slings
- 9.1.4. Mobility Equipment
- 9.1.4.1. Walking Assist Devices
- 9.1.4.2. Wheelchairs and Scooters
- 9.1.1. Daily Living Aids
- 9.2. Market Analysis, Insights and Forecast - by Application
- 9.2.1. Physiotherapy
- 9.2.2. Occupational Therapy
- 9.2.3. Other Applications
- 9.3. Market Analysis, Insights and Forecast - by End-User
- 9.3.1. Hospitals
- 9.3.2. Rehab Centers
- 9.3.3. Others End-Users
- 9.1. Market Analysis, Insights and Forecast - by Product Type
- 10. Middle East and Africa Rehabilitation Industry Analysis, Insights and Forecast, 2020-2032
- 10.1. Market Analysis, Insights and Forecast - by Product Type
- 10.1.1. Daily Living Aids
- 10.1.1.1. Medical Beds
- 10.1.1.2. Bathroom and Toilet Assist Devices
- 10.1.1.3. Reading Writing and Computer Aids
- 10.1.1.4. Other Daily Living Aids
- 10.1.2. Exercise Equipment
- 10.1.2.1. Upper Body Exercise Equipment
- 10.1.2.2. Lower Body Exercise Equipment
- 10.1.3. Body Support Devices
- 10.1.3.1. Patient Lifts
- 10.1.3.2. Medical Lifting Slings
- 10.1.4. Mobility Equipment
- 10.1.4.1. Walking Assist Devices
- 10.1.4.2. Wheelchairs and Scooters
- 10.1.1. Daily Living Aids
- 10.2. Market Analysis, Insights and Forecast - by Application
- 10.2.1. Physiotherapy
- 10.2.2. Occupational Therapy
- 10.2.3. Other Applications
- 10.3. Market Analysis, Insights and Forecast - by End-User
- 10.3.1. Hospitals
- 10.3.2. Rehab Centers
- 10.3.3. Others End-Users
- 10.1. Market Analysis, Insights and Forecast - by Product Type
- 11. South America Rehabilitation Industry Analysis, Insights and Forecast, 2020-2032
- 11.1. Market Analysis, Insights and Forecast - by Product Type
- 11.1.1. Daily Living Aids
- 11.1.1.1. Medical Beds
- 11.1.1.2. Bathroom and Toilet Assist Devices
- 11.1.1.3. Reading Writing and Computer Aids
- 11.1.1.4. Other Daily Living Aids
- 11.1.2. Exercise Equipment
- 11.1.2.1. Upper Body Exercise Equipment
- 11.1.2.2. Lower Body Exercise Equipment
- 11.1.3. Body Support Devices
- 11.1.3.1. Patient Lifts
- 11.1.3.2. Medical Lifting Slings
- 11.1.4. Mobility Equipment
- 11.1.4.1. Walking Assist Devices
- 11.1.4.2. Wheelchairs and Scooters
- 11.1.1. Daily Living Aids
- 11.2. Market Analysis, Insights and Forecast - by Application
- 11.2.1. Physiotherapy
- 11.2.2. Occupational Therapy
- 11.2.3. Other Applications
- 11.3. Market Analysis, Insights and Forecast - by End-User
- 11.3.1. Hospitals
- 11.3.2. Rehab Centers
- 11.3.3. Others End-Users
- 11.1. Market Analysis, Insights and Forecast - by Product Type
- 12. Competitive Analysis
- 12.1. Company Profiles
- 12.1.1 GF HEALTH PRODUCTS INC
- 12.1.1.1. Company Overview
- 12.1.1.2. Products
- 12.1.1.3. Company Financials
- 12.1.1.4. SWOT Analysis
- 12.1.2 Invacare Corporation
- 12.1.2.1. Company Overview
- 12.1.2.2. Products
- 12.1.2.3. Company Financials
- 12.1.2.4. SWOT Analysis
- 12.1.3 Marsi Bionics SL
- 12.1.3.1. Company Overview
- 12.1.3.2. Products
- 12.1.3.3. Company Financials
- 12.1.3.4. SWOT Analysis
- 12.1.4 Hill-Rom Services INC
- 12.1.4.1. Company Overview
- 12.1.4.2. Products
- 12.1.4.3. Company Financials
- 12.1.4.4. SWOT Analysis
- 12.1.5 Drive DeVilbiss Healthcare
- 12.1.5.1. Company Overview
- 12.1.5.2. Products
- 12.1.5.3. Company Financials
- 12.1.5.4. SWOT Analysis
- 12.1.6 Dynatronics Corporation
- 12.1.6.1. Company Overview
- 12.1.6.2. Products
- 12.1.6.3. Company Financials
- 12.1.6.4. SWOT Analysis
- 12.1.7 Ekso Bionics
- 12.1.7.1. Company Overview
- 12.1.7.2. Products
- 12.1.7.3. Company Financials
- 12.1.7.4. SWOT Analysis
- 12.1.8 ReWalk Robotics
- 12.1.8.1. Company Overview
- 12.1.8.2. Products
- 12.1.8.3. Company Financials
- 12.1.8.4. SWOT Analysis
- 12.1.9 Caremax Rehabilitation Equipment Co Ltd
- 12.1.9.1. Company Overview
- 12.1.9.2. Products
- 12.1.9.3. Company Financials
- 12.1.9.4. SWOT Analysis
- 12.1.10 ULS Robotics Co Ltd
- 12.1.10.1. Company Overview
- 12.1.10.2. Products
- 12.1.10.3. Company Financials
- 12.1.10.4. SWOT Analysis
- 12.1.11 Medline Industries Inc
- 12.1.11.1. Company Overview
- 12.1.11.2. Products
- 12.1.11.3. Company Financials
- 12.1.11.4. SWOT Analysis
- 12.1.12 Roma Medical Aids Ltd
- 12.1.12.1. Company Overview
- 12.1.12.2. Products
- 12.1.12.3. Company Financials
- 12.1.12.4. SWOT Analysis
- 12.1.13 Hospital Equipment Mfg Co
- 12.1.13.1. Company Overview
- 12.1.13.2. Products
- 12.1.13.3. Company Financials
- 12.1.13.4. SWOT Analysis
- 12.1.1 GF HEALTH PRODUCTS INC
- 12.2. Market Entropy
- 12.2.1 Company's Key Areas Served
- 12.2.2 Recent Developments
- 12.3. Company Market Share Analysis 2025
- 12.3.1 Top 5 Companies Market Share Analysis
- 12.3.2 Top 3 Companies Market Share Analysis
- 12.4. List of Potential Customers
- 13. Research Methodology
List of Figures
- Figure 1: Global Rehabilitation Industry Revenue Breakdown (Million, %) by Region 2025 & 2033
- Figure 2: Global Rehabilitation Industry Volume Breakdown (K Unit, %) by Region 2025 & 2033
- Figure 3: North America Rehabilitation Industry Revenue (Million), by Product Type 2025 & 2033
- Figure 4: North America Rehabilitation Industry Volume (K Unit), by Product Type 2025 & 2033
- Figure 5: North America Rehabilitation Industry Revenue Share (%), by Product Type 2025 & 2033
- Figure 6: North America Rehabilitation Industry Volume Share (%), by Product Type 2025 & 2033
- Figure 7: North America Rehabilitation Industry Revenue (Million), by Application 2025 & 2033
- Figure 8: North America Rehabilitation Industry Volume (K Unit), by Application 2025 & 2033
- Figure 9: North America Rehabilitation Industry Revenue Share (%), by Application 2025 & 2033
- Figure 10: North America Rehabilitation Industry Volume Share (%), by Application 2025 & 2033
- Figure 11: North America Rehabilitation Industry Revenue (Million), by End-User 2025 & 2033
- Figure 12: North America Rehabilitation Industry Volume (K Unit), by End-User 2025 & 2033
- Figure 13: North America Rehabilitation Industry Revenue Share (%), by End-User 2025 & 2033
- Figure 14: North America Rehabilitation Industry Volume Share (%), by End-User 2025 & 2033
- Figure 15: North America Rehabilitation Industry Revenue (Million), by Country 2025 & 2033
- Figure 16: North America Rehabilitation Industry Volume (K Unit), by Country 2025 & 2033
- Figure 17: North America Rehabilitation Industry Revenue Share (%), by Country 2025 & 2033
- Figure 18: North America Rehabilitation Industry Volume Share (%), by Country 2025 & 2033
- Figure 19: Europe Rehabilitation Industry Revenue (Million), by Product Type 2025 & 2033
- Figure 20: Europe Rehabilitation Industry Volume (K Unit), by Product Type 2025 & 2033
- Figure 21: Europe Rehabilitation Industry Revenue Share (%), by Product Type 2025 & 2033
- Figure 22: Europe Rehabilitation Industry Volume Share (%), by Product Type 2025 & 2033
- Figure 23: Europe Rehabilitation Industry Revenue (Million), by Application 2025 & 2033
- Figure 24: Europe Rehabilitation Industry Volume (K Unit), by Application 2025 & 2033
- Figure 25: Europe Rehabilitation Industry Revenue Share (%), by Application 2025 & 2033
- Figure 26: Europe Rehabilitation Industry Volume Share (%), by Application 2025 & 2033
- Figure 27: Europe Rehabilitation Industry Revenue (Million), by End-User 2025 & 2033
- Figure 28: Europe Rehabilitation Industry Volume (K Unit), by End-User 2025 & 2033
- Figure 29: Europe Rehabilitation Industry Revenue Share (%), by End-User 2025 & 2033
- Figure 30: Europe Rehabilitation Industry Volume Share (%), by End-User 2025 & 2033
- Figure 31: Europe Rehabilitation Industry Revenue (Million), by Country 2025 & 2033
- Figure 32: Europe Rehabilitation Industry Volume (K Unit), by Country 2025 & 2033
- Figure 33: Europe Rehabilitation Industry Revenue Share (%), by Country 2025 & 2033
- Figure 34: Europe Rehabilitation Industry Volume Share (%), by Country 2025 & 2033
- Figure 35: Asia Pacific Rehabilitation Industry Revenue (Million), by Product Type 2025 & 2033
- Figure 36: Asia Pacific Rehabilitation Industry Volume (K Unit), by Product Type 2025 & 2033
- Figure 37: Asia Pacific Rehabilitation Industry Revenue Share (%), by Product Type 2025 & 2033
- Figure 38: Asia Pacific Rehabilitation Industry Volume Share (%), by Product Type 2025 & 2033
- Figure 39: Asia Pacific Rehabilitation Industry Revenue (Million), by Application 2025 & 2033
- Figure 40: Asia Pacific Rehabilitation Industry Volume (K Unit), by Application 2025 & 2033
- Figure 41: Asia Pacific Rehabilitation Industry Revenue Share (%), by Application 2025 & 2033
- Figure 42: Asia Pacific Rehabilitation Industry Volume Share (%), by Application 2025 & 2033
- Figure 43: Asia Pacific Rehabilitation Industry Revenue (Million), by End-User 2025 & 2033
- Figure 44: Asia Pacific Rehabilitation Industry Volume (K Unit), by End-User 2025 & 2033
- Figure 45: Asia Pacific Rehabilitation Industry Revenue Share (%), by End-User 2025 & 2033
- Figure 46: Asia Pacific Rehabilitation Industry Volume Share (%), by End-User 2025 & 2033
- Figure 47: Asia Pacific Rehabilitation Industry Revenue (Million), by Country 2025 & 2033
- Figure 48: Asia Pacific Rehabilitation Industry Volume (K Unit), by Country 2025 & 2033
- Figure 49: Asia Pacific Rehabilitation Industry Revenue Share (%), by Country 2025 & 2033
- Figure 50: Asia Pacific Rehabilitation Industry Volume Share (%), by Country 2025 & 2033
- Figure 51: Middle East and Africa Rehabilitation Industry Revenue (Million), by Product Type 2025 & 2033
- Figure 52: Middle East and Africa Rehabilitation Industry Volume (K Unit), by Product Type 2025 & 2033
- Figure 53: Middle East and Africa Rehabilitation Industry Revenue Share (%), by Product Type 2025 & 2033
- Figure 54: Middle East and Africa Rehabilitation Industry Volume Share (%), by Product Type 2025 & 2033
- Figure 55: Middle East and Africa Rehabilitation Industry Revenue (Million), by Application 2025 & 2033
- Figure 56: Middle East and Africa Rehabilitation Industry Volume (K Unit), by Application 2025 & 2033
- Figure 57: Middle East and Africa Rehabilitation Industry Revenue Share (%), by Application 2025 & 2033
- Figure 58: Middle East and Africa Rehabilitation Industry Volume Share (%), by Application 2025 & 2033
- Figure 59: Middle East and Africa Rehabilitation Industry Revenue (Million), by End-User 2025 & 2033
- Figure 60: Middle East and Africa Rehabilitation Industry Volume (K Unit), by End-User 2025 & 2033
- Figure 61: Middle East and Africa Rehabilitation Industry Revenue Share (%), by End-User 2025 & 2033
- Figure 62: Middle East and Africa Rehabilitation Industry Volume Share (%), by End-User 2025 & 2033
- Figure 63: Middle East and Africa Rehabilitation Industry Revenue (Million), by Country 2025 & 2033
- Figure 64: Middle East and Africa Rehabilitation Industry Volume (K Unit), by Country 2025 & 2033
- Figure 65: Middle East and Africa Rehabilitation Industry Revenue Share (%), by Country 2025 & 2033
- Figure 66: Middle East and Africa Rehabilitation Industry Volume Share (%), by Country 2025 & 2033
- Figure 67: South America Rehabilitation Industry Revenue (Million), by Product Type 2025 & 2033
- Figure 68: South America Rehabilitation Industry Volume (K Unit), by Product Type 2025 & 2033
- Figure 69: South America Rehabilitation Industry Revenue Share (%), by Product Type 2025 & 2033
- Figure 70: South America Rehabilitation Industry Volume Share (%), by Product Type 2025 & 2033
- Figure 71: South America Rehabilitation Industry Revenue (Million), by Application 2025 & 2033
- Figure 72: South America Rehabilitation Industry Volume (K Unit), by Application 2025 & 2033
- Figure 73: South America Rehabilitation Industry Revenue Share (%), by Application 2025 & 2033
- Figure 74: South America Rehabilitation Industry Volume Share (%), by Application 2025 & 2033
- Figure 75: South America Rehabilitation Industry Revenue (Million), by End-User 2025 & 2033
- Figure 76: South America Rehabilitation Industry Volume (K Unit), by End-User 2025 & 2033
- Figure 77: South America Rehabilitation Industry Revenue Share (%), by End-User 2025 & 2033
- Figure 78: South America Rehabilitation Industry Volume Share (%), by End-User 2025 & 2033
- Figure 79: South America Rehabilitation Industry Revenue (Million), by Country 2025 & 2033
- Figure 80: South America Rehabilitation Industry Volume (K Unit), by Country 2025 & 2033
- Figure 81: South America Rehabilitation Industry Revenue Share (%), by Country 2025 & 2033
- Figure 82: South America Rehabilitation Industry Volume Share (%), by Country 2025 & 2033
List of Tables
- Table 1: Global Rehabilitation Industry Revenue Million Forecast, by Product Type 2020 & 2033
- Table 2: Global Rehabilitation Industry Volume K Unit Forecast, by Product Type 2020 & 2033
- Table 3: Global Rehabilitation Industry Revenue Million Forecast, by Application 2020 & 2033
- Table 4: Global Rehabilitation Industry Volume K Unit Forecast, by Application 2020 & 2033
- Table 5: Global Rehabilitation Industry Revenue Million Forecast, by End-User 2020 & 2033
- Table 6: Global Rehabilitation Industry Volume K Unit Forecast, by End-User 2020 & 2033
- Table 7: Global Rehabilitation Industry Revenue Million Forecast, by Region 2020 & 2033
- Table 8: Global Rehabilitation Industry Volume K Unit Forecast, by Region 2020 & 2033
- Table 9: Global Rehabilitation Industry Revenue Million Forecast, by Product Type 2020 & 2033
- Table 10: Global Rehabilitation Industry Volume K Unit Forecast, by Product Type 2020 & 2033
- Table 11: Global Rehabilitation Industry Revenue Million Forecast, by Application 2020 & 2033
- Table 12: Global Rehabilitation Industry Volume K Unit Forecast, by Application 2020 & 2033
- Table 13: Global Rehabilitation Industry Revenue Million Forecast, by End-User 2020 & 2033
- Table 14: Global Rehabilitation Industry Volume K Unit Forecast, by End-User 2020 & 2033
- Table 15: Global Rehabilitation Industry Revenue Million Forecast, by Country 2020 & 2033
- Table 16: Global Rehabilitation Industry Volume K Unit Forecast, by Country 2020 & 2033
- Table 17: United States Rehabilitation Industry Revenue (Million) Forecast, by Application 2020 & 2033
- Table 18: United States Rehabilitation Industry Volume (K Unit) Forecast, by Application 2020 & 2033
- Table 19: Canada Rehabilitation Industry Revenue (Million) Forecast, by Application 2020 & 2033
- Table 20: Canada Rehabilitation Industry Volume (K Unit) Forecast, by Application 2020 & 2033
- Table 21: Mexico Rehabilitation Industry Revenue (Million) Forecast, by Application 2020 & 2033
- Table 22: Mexico Rehabilitation Industry Volume (K Unit) Forecast, by Application 2020 & 2033
- Table 23: Global Rehabilitation Industry Revenue Million Forecast, by Product Type 2020 & 2033
- Table 24: Global Rehabilitation Industry Volume K Unit Forecast, by Product Type 2020 & 2033
- Table 25: Global Rehabilitation Industry Revenue Million Forecast, by Application 2020 & 2033
- Table 26: Global Rehabilitation Industry Volume K Unit Forecast, by Application 2020 & 2033
- Table 27: Global Rehabilitation Industry Revenue Million Forecast, by End-User 2020 & 2033
- Table 28: Global Rehabilitation Industry Volume K Unit Forecast, by End-User 2020 & 2033
- Table 29: Global Rehabilitation Industry Revenue Million Forecast, by Country 2020 & 2033
- Table 30: Global Rehabilitation Industry Volume K Unit Forecast, by Country 2020 & 2033
- Table 31: Germany Rehabilitation Industry Revenue (Million) Forecast, by Application 2020 & 2033
- Table 32: Germany Rehabilitation Industry Volume (K Unit) Forecast, by Application 2020 & 2033
- Table 33: United Kingdom Rehabilitation Industry Revenue (Million) Forecast, by Application 2020 & 2033
- Table 34: United Kingdom Rehabilitation Industry Volume (K Unit) Forecast, by Application 2020 & 2033
- Table 35: France Rehabilitation Industry Revenue (Million) Forecast, by Application 2020 & 2033
- Table 36: France Rehabilitation Industry Volume (K Unit) Forecast, by Application 2020 & 2033
- Table 37: Italy Rehabilitation Industry Revenue (Million) Forecast, by Application 2020 & 2033
- Table 38: Italy Rehabilitation Industry Volume (K Unit) Forecast, by Application 2020 & 2033
- Table 39: Spain Rehabilitation Industry Revenue (Million) Forecast, by Application 2020 & 2033
- Table 40: Spain Rehabilitation Industry Volume (K Unit) Forecast, by Application 2020 & 2033
- Table 41: Rest of Europe Rehabilitation Industry Revenue (Million) Forecast, by Application 2020 & 2033
- Table 42: Rest of Europe Rehabilitation Industry Volume (K Unit) Forecast, by Application 2020 & 2033
- Table 43: Global Rehabilitation Industry Revenue Million Forecast, by Product Type 2020 & 2033
- Table 44: Global Rehabilitation Industry Volume K Unit Forecast, by Product Type 2020 & 2033
- Table 45: Global Rehabilitation Industry Revenue Million Forecast, by Application 2020 & 2033
- Table 46: Global Rehabilitation Industry Volume K Unit Forecast, by Application 2020 & 2033
- Table 47: Global Rehabilitation Industry Revenue Million Forecast, by End-User 2020 & 2033
- Table 48: Global Rehabilitation Industry Volume K Unit Forecast, by End-User 2020 & 2033
- Table 49: Global Rehabilitation Industry Revenue Million Forecast, by Country 2020 & 2033
- Table 50: Global Rehabilitation Industry Volume K Unit Forecast, by Country 2020 & 2033
- Table 51: China Rehabilitation Industry Revenue (Million) Forecast, by Application 2020 & 2033
- Table 52: China Rehabilitation Industry Volume (K Unit) Forecast, by Application 2020 & 2033
- Table 53: Japan Rehabilitation Industry Revenue (Million) Forecast, by Application 2020 & 2033
- Table 54: Japan Rehabilitation Industry Volume (K Unit) Forecast, by Application 2020 & 2033
- Table 55: India Rehabilitation Industry Revenue (Million) Forecast, by Application 2020 & 2033
- Table 56: India Rehabilitation Industry Volume (K Unit) Forecast, by Application 2020 & 2033
- Table 57: Australia Rehabilitation Industry Revenue (Million) Forecast, by Application 2020 & 2033
- Table 58: Australia Rehabilitation Industry Volume (K Unit) Forecast, by Application 2020 & 2033
- Table 59: South Korea Rehabilitation Industry Revenue (Million) Forecast, by Application 2020 & 2033
- Table 60: South Korea Rehabilitation Industry Volume (K Unit) Forecast, by Application 2020 & 2033
- Table 61: Rest of Asia Pacific Rehabilitation Industry Revenue (Million) Forecast, by Application 2020 & 2033
- Table 62: Rest of Asia Pacific Rehabilitation Industry Volume (K Unit) Forecast, by Application 2020 & 2033
- Table 63: Global Rehabilitation Industry Revenue Million Forecast, by Product Type 2020 & 2033
- Table 64: Global Rehabilitation Industry Volume K Unit Forecast, by Product Type 2020 & 2033
- Table 65: Global Rehabilitation Industry Revenue Million Forecast, by Application 2020 & 2033
- Table 66: Global Rehabilitation Industry Volume K Unit Forecast, by Application 2020 & 2033
- Table 67: Global Rehabilitation Industry Revenue Million Forecast, by End-User 2020 & 2033
- Table 68: Global Rehabilitation Industry Volume K Unit Forecast, by End-User 2020 & 2033
- Table 69: Global Rehabilitation Industry Revenue Million Forecast, by Country 2020 & 2033
- Table 70: Global Rehabilitation Industry Volume K Unit Forecast, by Country 2020 & 2033
- Table 71: GCC Rehabilitation Industry Revenue (Million) Forecast, by Application 2020 & 2033
- Table 72: GCC Rehabilitation Industry Volume (K Unit) Forecast, by Application 2020 & 2033
- Table 73: South Africa Rehabilitation Industry Revenue (Million) Forecast, by Application 2020 & 2033
- Table 74: South Africa Rehabilitation Industry Volume (K Unit) Forecast, by Application 2020 & 2033
- Table 75: Rest of Middle East and Africa Rehabilitation Industry Revenue (Million) Forecast, by Application 2020 & 2033
- Table 76: Rest of Middle East and Africa Rehabilitation Industry Volume (K Unit) Forecast, by Application 2020 & 2033
- Table 77: Global Rehabilitation Industry Revenue Million Forecast, by Product Type 2020 & 2033
- Table 78: Global Rehabilitation Industry Volume K Unit Forecast, by Product Type 2020 & 2033
- Table 79: Global Rehabilitation Industry Revenue Million Forecast, by Application 2020 & 2033
- Table 80: Global Rehabilitation Industry Volume K Unit Forecast, by Application 2020 & 2033
- Table 81: Global Rehabilitation Industry Revenue Million Forecast, by End-User 2020 & 2033
- Table 82: Global Rehabilitation Industry Volume K Unit Forecast, by End-User 2020 & 2033
- Table 83: Global Rehabilitation Industry Revenue Million Forecast, by Country 2020 & 2033
- Table 84: Global Rehabilitation Industry Volume K Unit Forecast, by Country 2020 & 2033
- Table 85: Brazil Rehabilitation Industry Revenue (Million) Forecast, by Application 2020 & 2033
- Table 86: Brazil Rehabilitation Industry Volume (K Unit) Forecast, by Application 2020 & 2033
- Table 87: Argentina Rehabilitation Industry Revenue (Million) Forecast, by Application 2020 & 2033
- Table 88: Argentina Rehabilitation Industry Volume (K Unit) Forecast, by Application 2020 & 2033
- Table 89: Rest of South America Rehabilitation Industry Revenue (Million) Forecast, by Application 2020 & 2033
- Table 90: Rest of South America Rehabilitation Industry Volume (K Unit) Forecast, by Application 2020 & 2033
Frequently Asked Questions
1. What is the projected Compound Annual Growth Rate (CAGR) of the Rehabilitation Industry?
The projected CAGR is approximately 4.92%.
2. Which companies are prominent players in the Rehabilitation Industry?
Key companies in the market include GF HEALTH PRODUCTS INC, Invacare Corporation, Marsi Bionics SL, Hill-Rom Services INC, Drive DeVilbiss Healthcare, Dynatronics Corporation, Ekso Bionics, ReWalk Robotics, Caremax Rehabilitation Equipment Co Ltd, ULS Robotics Co Ltd, Medline Industries Inc, Roma Medical Aids Ltd, Hospital Equipment Mfg Co.
3. What are the main segments of the Rehabilitation Industry?
The market segments include Product Type, Application, End-User.
4. Can you provide details about the market size?
The market size is estimated to be USD 14.94 Million as of 2022.
5. What are some drivers contributing to market growth?
Increasing Burden of Chronic Diseases; Rising Demand for Rehabilitation Therapies; Rising Awareness Initiatives Regarding Rehabilitation Therapies.
6. What are the notable trends driving market growth?
Walking Assist Devices Segment Estimated to Witness a Healthy Growth Over the Forecast Period.
7. Are there any restraints impacting market growth?
Unfavorable Reimbursements and Lack of Awareness.
8. Can you provide examples of recent developments in the market?
February 2022- Lusio Rehab launched a wearable rehabilitation device called LusioMATE that motivates patients to engage more with their physical therapy and rehab programs at Arab Health 2022.
9. What pricing options are available for accessing the report?
Pricing options include single-user, multi-user, and enterprise licenses priced at USD 4750, USD 5250, and USD 8750 respectively.
10. Is the market size provided in terms of value or volume?
The market size is provided in terms of value, measured in Million and volume, measured in K Unit.
11. Are there any specific market keywords associated with the report?
Yes, the market keyword associated with the report is "Rehabilitation Industry," which aids in identifying and referencing the specific market segment covered.
12. How do I determine which pricing option suits my needs best?
The pricing options vary based on user requirements and access needs. Individual users may opt for single-user licenses, while businesses requiring broader access may choose multi-user or enterprise licenses for cost-effective access to the report.
13. Are there any additional resources or data provided in the Rehabilitation Industry report?
While the report offers comprehensive insights, it's advisable to review the specific contents or supplementary materials provided to ascertain if additional resources or data are available.
14. How can I stay updated on further developments or reports in the Rehabilitation Industry?
To stay informed about further developments, trends, and reports in the Rehabilitation Industry, consider subscribing to industry newsletters, following relevant companies and organizations, or regularly checking reputable industry news sources and publications.
Methodology
Step 1 - Identification of Relevant Samples Size from Population Database


Step 2 - Approaches for Defining Global Market Size (Value, Volume* & Price*)

Note*: In applicable scenarios
Step 3 - Data Sources
Primary Research
- Web Analytics
- Survey Reports
- Research Institute
- Latest Research Reports
- Opinion Leaders
Secondary Research
- Annual Reports
- White Paper
- Latest Press Release
- Industry Association
- Paid Database
- Investor Presentations

Step 4 - Data Triangulation
Involves using different sources of information in order to increase the validity of a study
These sources are likely to be stakeholders in a program - participants, other researchers, program staff, other community members, and so on.
Then we put all data in single framework & apply various statistical tools to find out the dynamic on the market.
During the analysis stage, feedback from the stakeholder groups would be compared to determine areas of agreement as well as areas of divergence