

Key Insights
The global Optical Genome Mapping (OGM) market is poised for exceptional expansion, projected to reach a substantial USD 203.4 million in 2025. This dynamic growth is propelled by a remarkable Compound Annual Growth Rate (CAGR) of 28.6% over the forecast period from 2025 to 2033. The driving forces behind this surge include the increasing adoption of OGM in precision medicine for the diagnosis and treatment of complex genetic disorders, the burgeoning demand for advanced genomic analysis tools in pharmaceutical research and development for drug discovery and clinical trials, and the continuous innovation in OGM technologies offering higher resolution and throughput. Furthermore, the rising prevalence of genetic diseases and the growing awareness about the benefits of personalized healthcare are creating a fertile ground for OGM market penetration. The market's expansion is further bolstered by significant investments in genomic research infrastructure by both public and private entities, alongside a growing pipeline of novel OGM-based diagnostic and therapeutic applications.
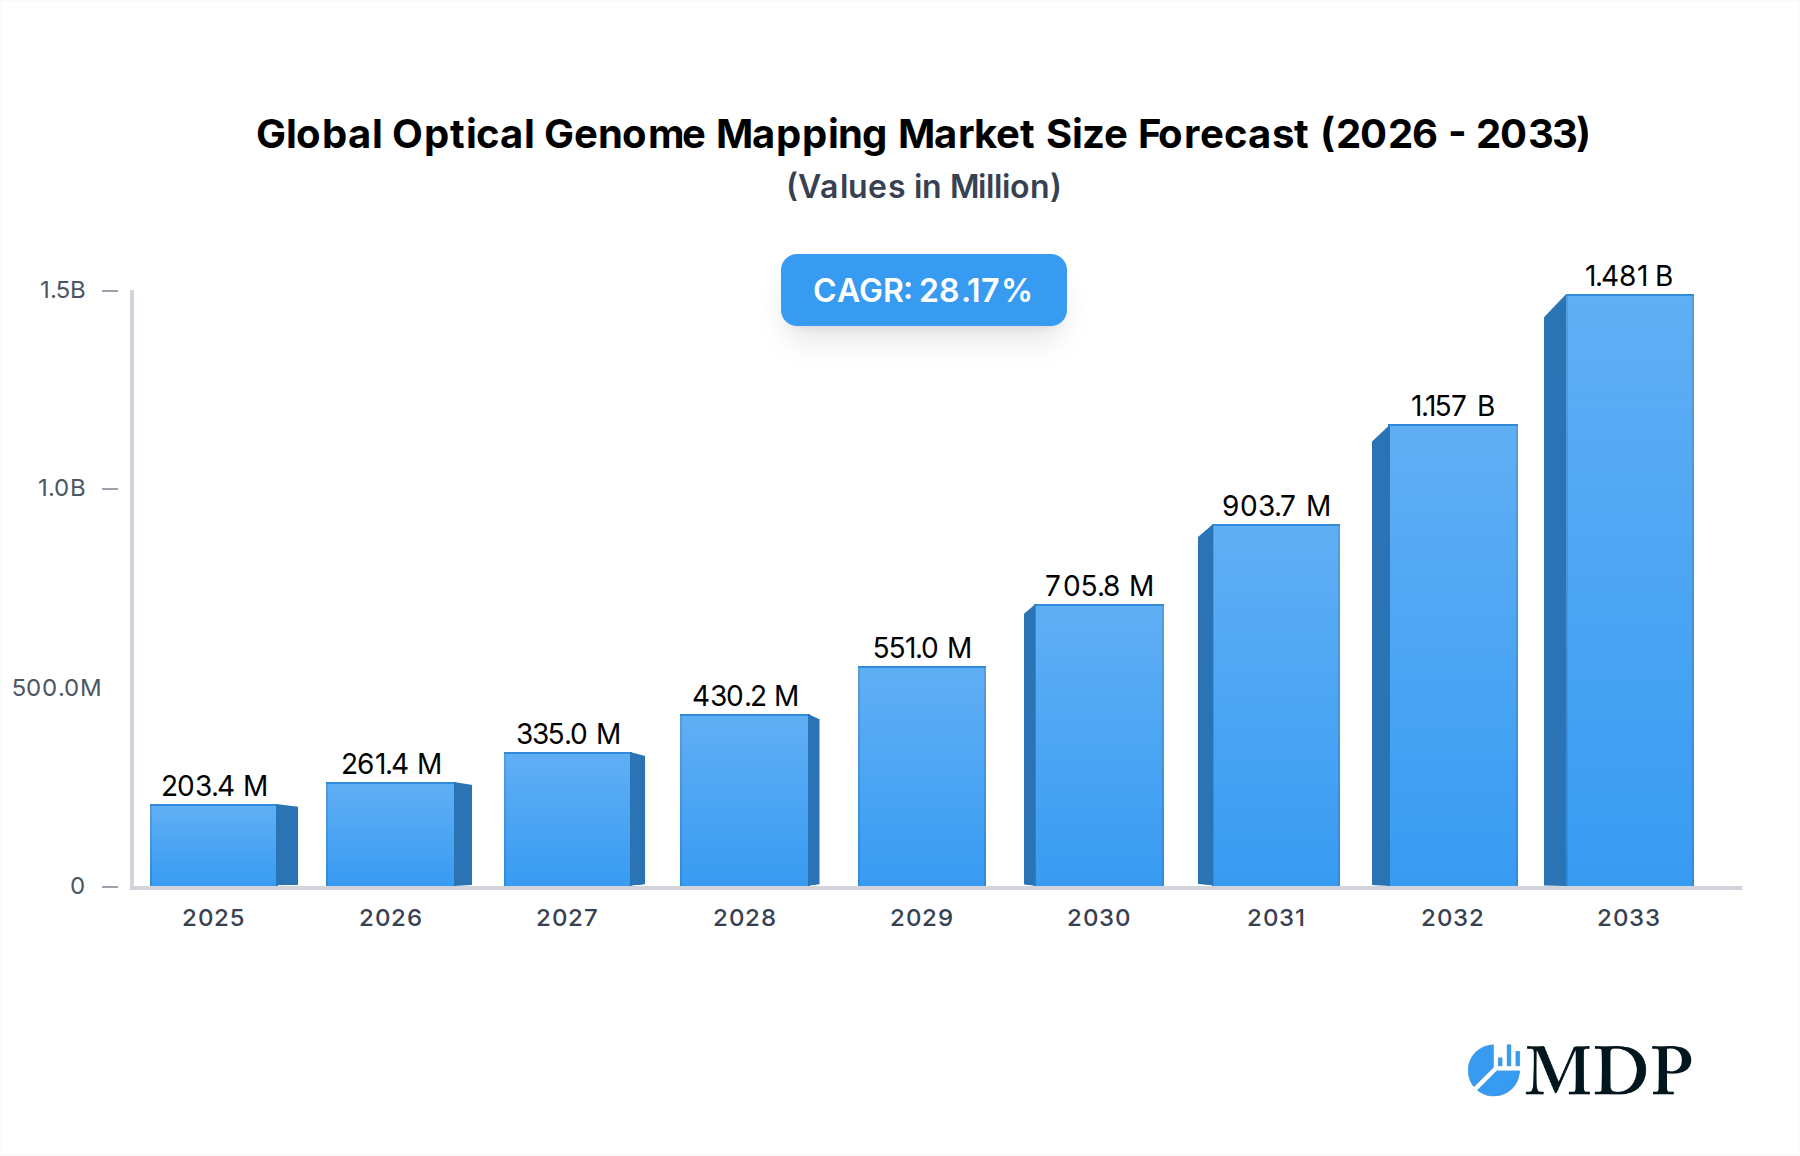
Global Optical Genome Mapping Market Market Size (In Million)
The OGM market is segmented into Instruments and Consumables, with Instruments, particularly Optical Genome Mapping Instruments, expected to capture a dominant share due to their critical role in enabling advanced genomic analysis. End-users are primarily Biotechnology & Pharmaceutical Companies and Research & Academic Institutions, who are at the forefront of leveraging OGM for groundbreaking discoveries and the development of new therapies. While the market exhibits robust growth, certain restraints such as the high initial cost of OGM instruments and the need for specialized expertise for their operation and data interpretation may present challenges. However, these are expected to be mitigated by technological advancements, decreasing instrument costs over time, and the increasing availability of skilled professionals. Geographically, North America is anticipated to lead the market, driven by a strong presence of leading OGM technology providers, significant R&D investments, and a well-established healthcare ecosystem. Asia Pacific is expected to witness the fastest growth due to increasing government initiatives, rising healthcare expenditure, and a growing focus on genomic research in emerging economies like China and India.

Global Optical Genome Mapping Market Company Market Share
Report Description:
Dive deep into the rapidly evolving Global Optical Genome Mapping Market, a critical frontier in understanding and manipulating the genome. This comprehensive report analyzes the market trajectory from 2019 to 2033, with a strong focus on the Base Year 2025 and a detailed Forecast Period of 2025–2033. Explore groundbreaking advancements in optical genome mapping instruments and essential consumables, and understand their pivotal role across Biotechnology & Pharmaceutical Companies, Research & Academic Institutions, and other emerging sectors. With an estimated market size projected to reach $XXX million by 2025 and grow at a compelling XX% CAGR, this report offers actionable insights and strategic guidance for stakeholders navigating this high-growth landscape.
The optical genome mapping market is experiencing unprecedented expansion driven by its ability to provide ultra-long reads and comprehensive structural variation detection, surpassing the limitations of traditional sequencing methods. This report is an indispensable resource for anyone seeking to understand the market dynamics, leading players, and future potential of this transformative technology.
Global Optical Genome Mapping Market Market Dynamics & Concentration
The optical genome mapping market exhibits a moderate to high concentration, with key players investing heavily in research and development to drive innovation. The primary innovation drivers include the increasing demand for accurate and comprehensive genomic analysis in disease diagnostics, drug discovery, and personalized medicine. Regulatory frameworks, while evolving, are becoming more supportive of advanced genomic technologies, fostering market growth. Product substitutes, such as short-read sequencing technologies, continue to exist but are increasingly being complemented or replaced by optical genome mapping for specific applications requiring long-read insights and structural variant detection. End-user trends highlight a growing adoption in both academic research for fundamental genomic studies and in the biopharmaceutical sector for drug development and clinical trial applications. Mergers and acquisitions (M&A) activities are anticipated to play a crucial role in market consolidation and expansion, with a projected XX M&A deals expected during the forecast period. Leading companies are strategically acquiring smaller entities or forming partnerships to enhance their technological portfolios and market reach. The market share distribution is expected to see shifts as new entrants emerge and established players solidify their positions.
Global Optical Genome Mapping Market Industry Trends & Analysis
The Global Optical Genome Mapping Market is poised for substantial growth, projected to reach $XXX million by the end of 2025, and then continue its upward trajectory, achieving an impressive CAGR of XX% during the 2025–2033 forecast period. This robust expansion is fueled by a confluence of powerful market growth drivers. The escalating prevalence of genetic disorders and the growing demand for precise diagnostics and targeted therapies are paramount. Optical genome mapping's unique ability to detect large structural variations, such as inversions, translocations, and deletions, with unparalleled accuracy makes it an indispensable tool for understanding complex genetic diseases that are often missed by short-read sequencing. Technological disruptions are at the forefront, with continuous advancements in optical genome mapping instruments leading to increased throughput, improved resolution, and reduced costs. The development of more sophisticated algorithms for data analysis and interpretation further enhances the utility of this technology. Consumer preferences are evolving, with an increasing awareness among healthcare providers and researchers about the diagnostic power of long-read sequencing and structural variation analysis. This is leading to a greater demand for solutions that offer a more complete picture of the genome. The competitive dynamics within the market are characterized by intense innovation and strategic collaborations. Key players are investing significantly in R&D to gain a competitive edge, focusing on developing user-friendly platforms and expanding the application spectrum of optical genome mapping. The market penetration of optical genome mapping is expected to surge as its clinical utility becomes more widely recognized and validated through ongoing research and clinical trials. Furthermore, the increasing availability of genomic data and the growing interest in multi-omics approaches are creating new avenues for the integration of optical genome mapping data, further driving its adoption.
Leading Markets & Segments in Global Optical Genome Mapping Market
North America currently dominates the Global Optical Genome Mapping Market, driven by substantial investments in genomics research, a robust healthcare infrastructure, and the presence of leading biopharmaceutical companies. The United States, in particular, is a powerhouse due to significant government funding for scientific research and a high adoption rate of advanced diagnostic technologies. Economically, strong per capita income and favorable reimbursement policies for genetic testing contribute to this regional dominance.
Product Type:
- Instruments (Optical Genome Mapping Instrument): This segment holds the largest market share and is expected to continue its dominance due to the high initial investment required for these sophisticated devices. Key drivers include technological advancements leading to more powerful and user-friendly instruments, as well as the expanding applications in clinical diagnostics and drug discovery. The economic policies supporting R&D in the life sciences sector further bolster this segment.
- Consumables: While a smaller segment in terms of individual purchase value, the consumables market is experiencing significant growth. This is directly linked to the increasing utilization of optical genome mapping instruments, leading to a steady demand for reagents, arrays, and other disposable components. The widespread adoption of these instruments in research and clinical settings is the primary driver.
End-User:
- Biotechnology & Pharmaceutical Companies: This segment is a major revenue contributor and is projected to exhibit the highest growth rate. The demand for optical genome mapping in drug discovery, target identification, and the development of novel therapies for genetic diseases is immense. Companies are leveraging this technology to gain a deeper understanding of disease mechanisms and to develop personalized medicine approaches. Favorable regulatory pathways for novel drug development also fuel this segment.
- Research & Academic Institutions: These institutions have historically been early adopters of novel genomic technologies and continue to be significant drivers of market growth. Their work in fundamental genomics research, disease mechanism elucidation, and the development of new applications for optical genome mapping is crucial. Government grants and institutional funding for research are key economic factors supporting this segment.
- Others: This segment includes clinical diagnostic laboratories, contract research organizations (CROs), and emerging applications in areas like agriculture and forensics. While currently smaller, this segment is expected to grow as the clinical utility of optical genome mapping becomes more established and accessible to a wider range of users.
Global Optical Genome Mapping Market Product Developments
Recent product developments in the Global Optical Genome Mapping Market focus on enhancing throughput, accuracy, and cost-effectiveness. Innovations in optical genome mapping instruments are leading to faster processing times and higher resolution, enabling the detection of even subtle structural variations. Software and bioinformatics tools are also seeing significant advancements, improving data analysis and interpretation capabilities, making the technology more accessible to a broader user base. These developments are crucial for expanding the applications of optical genome mapping into clinical diagnostics and personalized medicine, offering competitive advantages to companies that can deliver integrated, user-friendly solutions.
Key Drivers of Global Optical Genome Mapping Market Growth
The Global Optical Genome Mapping Market is propelled by several interconnected factors. Technological advancements in optical genome mapping instruments and associated bioinformatics pipelines are continuously improving resolution and throughput, making the technology more powerful and accessible. The increasing global burden of genetic diseases and the growing demand for precise diagnostics and targeted therapies are creating a significant need for accurate structural variation detection. Furthermore, supportive regulatory environments and increasing government funding for genomics research are fostering innovation and adoption. The development of personalized medicine, which relies heavily on a comprehensive understanding of an individual's genome, also serves as a major growth catalyst.
Challenges in the Global Optical Genome Mapping Market Market
Despite its immense potential, the Global Optical Genome Mapping Market faces several challenges. The high initial cost of optical genome mapping instruments remains a significant barrier for many research institutions and smaller organizations. The complexity of data analysis and interpretation still requires specialized expertise, which can limit widespread adoption. Regulatory hurdles for clinical applications and the need for extensive validation studies can also slow down market entry and growth. Additionally, the availability and accessibility of highly skilled personnel trained in operating and interpreting optical genome mapping data present a challenge.
Emerging Opportunities in Global Optical Genome Mapping Market
The Global Optical Genome Mapping Market is rife with emerging opportunities. The expansion of its applications into clinical diagnostics for a wider range of genetic disorders, including cancer, neurological conditions, and rare diseases, represents a significant growth avenue. Strategic partnerships between technology providers and pharmaceutical companies for drug discovery and development are expected to accelerate innovation. The increasing adoption of optical genome mapping in reproductive health for prenatal diagnostics and the development of novel genome editing technologies present further lucrative prospects for market expansion.
Leading Players in the Global Optical Genome Mapping Market Sector
- Nabsys
- Nucleome Informatics Private Limited
- OpGen
- Bionano Genomics
- PerkinElmer Inc
Key Milestones in Global Optical Genome Mapping Market Industry
- 2019: Significant advancements in optical mapping technology leading to increased resolution and accuracy.
- 2020: Increased adoption of optical genome mapping for complex genomic variation detection in research settings.
- 2021: Emergence of new bioinformatics tools to streamline data analysis, improving accessibility.
- 2022: Growing interest and preliminary studies exploring clinical applications of optical genome mapping in oncology.
- 2023: Key partnerships formed between optical genome mapping companies and major pharmaceutical entities for drug discovery initiatives.
- 2024: Expansion of consumable offerings and support services to enhance user experience and broaden market reach.
Strategic Outlook for Global Optical Genome Mapping Market Market
The strategic outlook for the Global Optical Genome Mapping Market is highly promising. Continued investment in technological innovation, particularly in reducing instrument costs and enhancing data analysis capabilities, will be crucial for broader market penetration. Expanding the clinical validation and regulatory approval pathways for optical genome mapping applications in diagnostics will unlock significant revenue streams. Furthermore, fostering strategic collaborations with academic institutions and the biopharmaceutical industry will accelerate the discovery of new applications and drive market growth, solidifying optical genome mapping's role as a cornerstone of genomic analysis.
Global Optical Genome Mapping Market Segmentation
-
1. Product Type
- 1.1. Instruments(Optical Genome Mapping Instrument)
- 1.2. Consumables
-
2. End-User
- 2.1. Biotechnology & Pharmaceutical Companies
- 2.2. Research & Academic Institutions
- 2.3. Others
Global Optical Genome Mapping Market Segmentation By Geography
-
1. North America
- 1.1. United States
- 1.2. Canada
- 1.3. Mexico
-
2. Europe
- 2.1. Germany
- 2.2. United Kingdom
- 2.3. France
- 2.4. Italy
- 2.5. Spain
- 2.6. Rest of Europe
-
3. Asia Pacific
- 3.1. China
- 3.2. Japan
- 3.3. India
- 3.4. Australia
- 3.5. South Korea
- 3.6. Rest of Asia Pacific
- 4. Rest of World
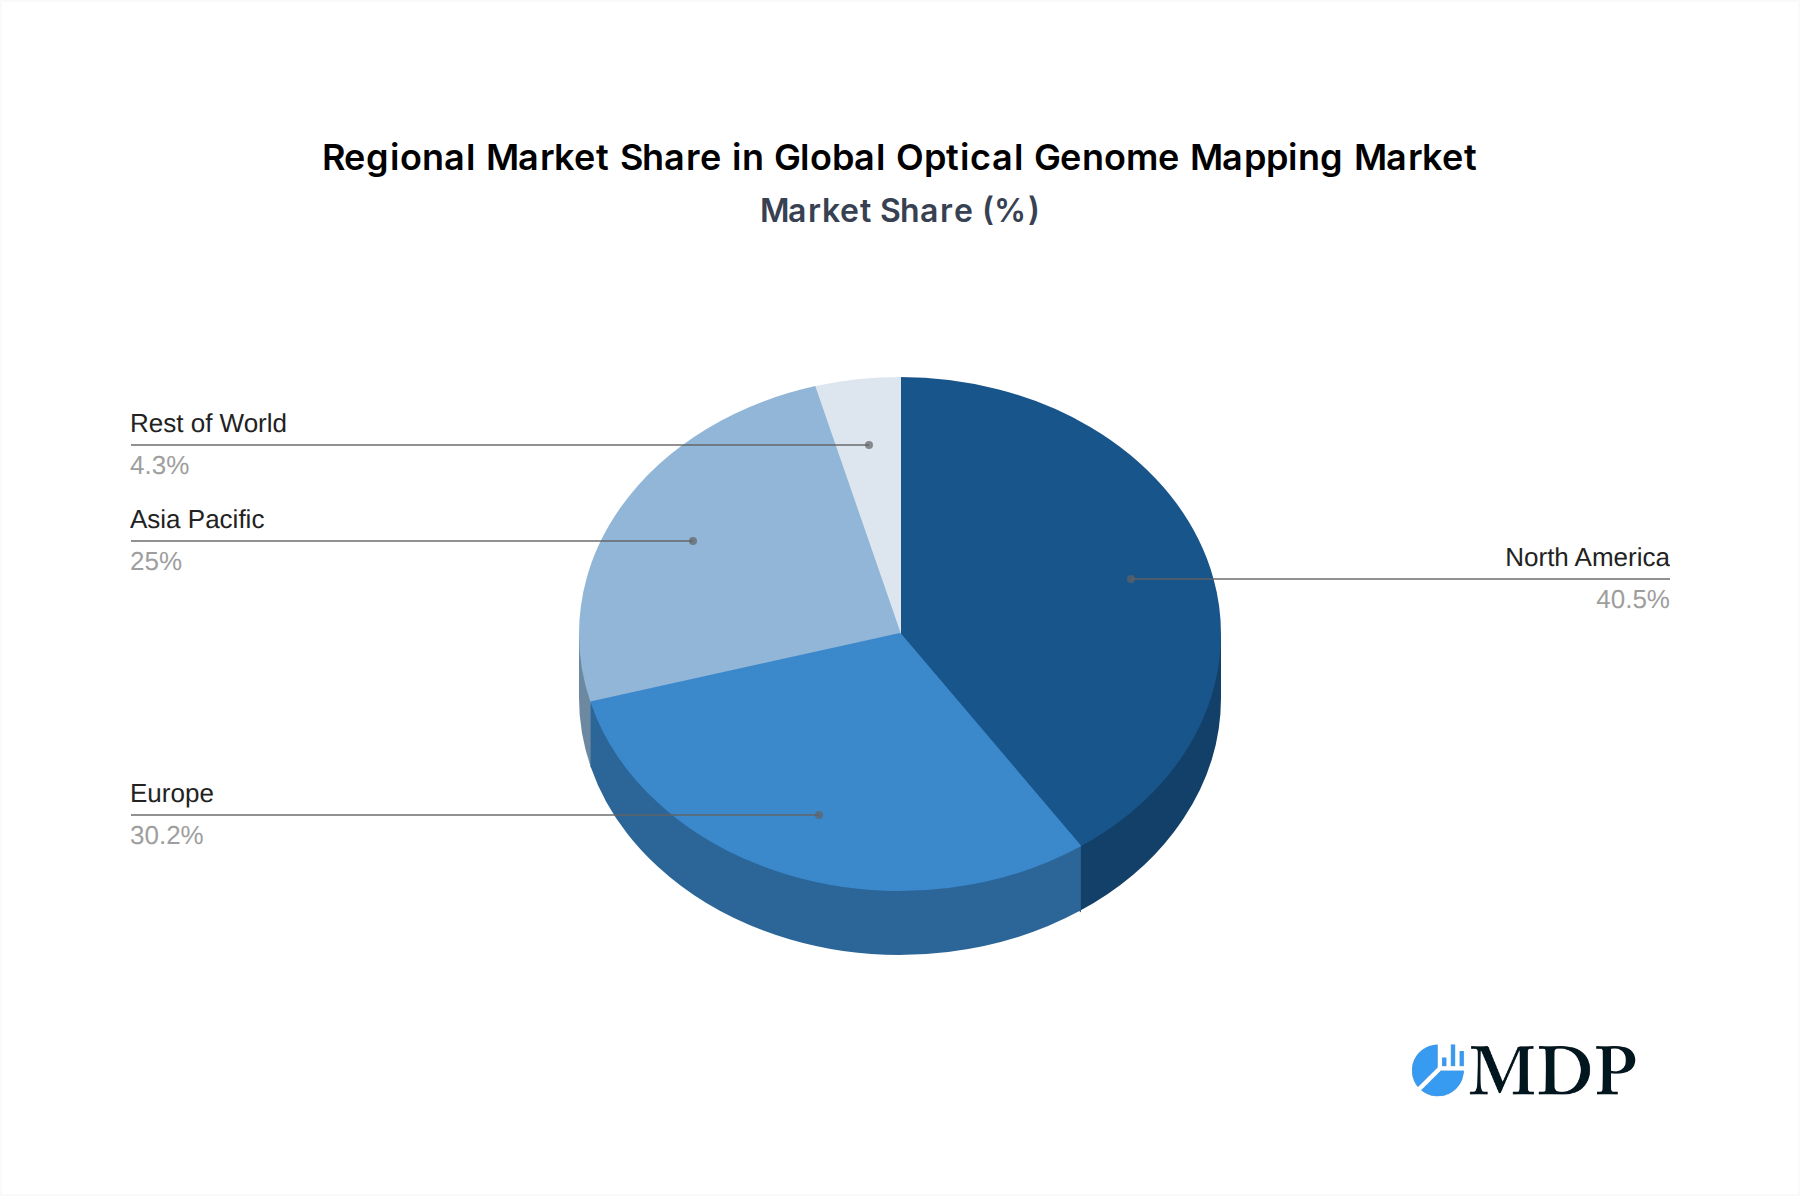
Global Optical Genome Mapping Market Regional Market Share
Geographic Coverage of Global Optical Genome Mapping Market
Global Optical Genome Mapping Market REPORT HIGHLIGHTS
| Aspects | Details |
|---|---|
| Study Period | 2020-2034 |
| Base Year | 2025 |
| Estimated Year | 2026 |
| Forecast Period | 2026-2034 |
| Historical Period | 2020-2025 |
| Growth Rate | CAGR of 26.8% from 2020-2034 |
| Segmentation |
|
Table of Contents
- 1. Introduction
- 1.1. Research Scope
- 1.2. Market Segmentation
- 1.3. Research Objective
- 1.4. Definitions and Assumptions
- 2. Executive Summary
- 2.1. Market Snapshot
- 3. Market Dynamics
- 3.1. Market Drivers
- 3.2. Market Restrains
- 3.3. Market Trends
- 3.4. Market Opportunities
- 4. Market Factor Analysis
- 4.1. Porters Five Forces
- 4.1.1. Bargaining Power of Suppliers
- 4.1.2. Bargaining Power of Buyers
- 4.1.3. Threat of New Entrants
- 4.1.4. Threat of Substitutes
- 4.1.5. Competitive Rivalry
- 4.2. PESTEL analysis
- 4.3. BCG Analysis
- 4.3.1. Stars (High Growth, High Market Share)
- 4.3.2. Cash Cows (Low Growth, High Market Share)
- 4.3.3. Question Mark (High Growth, Low Market Share)
- 4.3.4. Dogs (Low Growth, Low Market Share)
- 4.4. Ansoff Matrix Analysis
- 4.5. Supply Chain Analysis
- 4.6. Regulatory Landscape
- 4.7. Current Market Potential and Opportunity Assessment (TAM–SAM–SOM Framework)
- 4.8. MDP Analyst Note
- 4.1. Porters Five Forces
- 5. Market Analysis, Insights and Forecast 2021-2033
- 5.1. Market Analysis, Insights and Forecast - by Product Type
- 5.1.1. Instruments(Optical Genome Mapping Instrument)
- 5.1.2. Consumables
- 5.2. Market Analysis, Insights and Forecast - by End-User
- 5.2.1. Biotechnology & Pharmaceutical Companies
- 5.2.2. Research & Academic Institutions
- 5.2.3. Others
- 5.3. Market Analysis, Insights and Forecast - by Region
- 5.3.1. North America
- 5.3.2. Europe
- 5.3.3. Asia Pacific
- 5.3.4. Rest of World
- 5.1. Market Analysis, Insights and Forecast - by Product Type
- 6. Global Optical Genome Mapping Market Analysis, Insights and Forecast, 2021-2033
- 6.1. Market Analysis, Insights and Forecast - by Product Type
- 6.1.1. Instruments(Optical Genome Mapping Instrument)
- 6.1.2. Consumables
- 6.2. Market Analysis, Insights and Forecast - by End-User
- 6.2.1. Biotechnology & Pharmaceutical Companies
- 6.2.2. Research & Academic Institutions
- 6.2.3. Others
- 6.1. Market Analysis, Insights and Forecast - by Product Type
- 7. North America Global Optical Genome Mapping Market Analysis, Insights and Forecast, 2020-2032
- 7.1. Market Analysis, Insights and Forecast - by Product Type
- 7.1.1. Instruments(Optical Genome Mapping Instrument)
- 7.1.2. Consumables
- 7.2. Market Analysis, Insights and Forecast - by End-User
- 7.2.1. Biotechnology & Pharmaceutical Companies
- 7.2.2. Research & Academic Institutions
- 7.2.3. Others
- 7.1. Market Analysis, Insights and Forecast - by Product Type
- 8. Europe Global Optical Genome Mapping Market Analysis, Insights and Forecast, 2020-2032
- 8.1. Market Analysis, Insights and Forecast - by Product Type
- 8.1.1. Instruments(Optical Genome Mapping Instrument)
- 8.1.2. Consumables
- 8.2. Market Analysis, Insights and Forecast - by End-User
- 8.2.1. Biotechnology & Pharmaceutical Companies
- 8.2.2. Research & Academic Institutions
- 8.2.3. Others
- 8.1. Market Analysis, Insights and Forecast - by Product Type
- 9. Asia Pacific Global Optical Genome Mapping Market Analysis, Insights and Forecast, 2020-2032
- 9.1. Market Analysis, Insights and Forecast - by Product Type
- 9.1.1. Instruments(Optical Genome Mapping Instrument)
- 9.1.2. Consumables
- 9.2. Market Analysis, Insights and Forecast - by End-User
- 9.2.1. Biotechnology & Pharmaceutical Companies
- 9.2.2. Research & Academic Institutions
- 9.2.3. Others
- 9.1. Market Analysis, Insights and Forecast - by Product Type
- 10. Rest of World Global Optical Genome Mapping Market Analysis, Insights and Forecast, 2020-2032
- 10.1. Market Analysis, Insights and Forecast - by Product Type
- 10.1.1. Instruments(Optical Genome Mapping Instrument)
- 10.1.2. Consumables
- 10.2. Market Analysis, Insights and Forecast - by End-User
- 10.2.1. Biotechnology & Pharmaceutical Companies
- 10.2.2. Research & Academic Institutions
- 10.2.3. Others
- 10.1. Market Analysis, Insights and Forecast - by Product Type
- 11. Competitive Analysis
- 11.1. Company Profiles
- 11.1.1 Nabsys
- 11.1.1.1. Company Overview
- 11.1.1.2. Products
- 11.1.1.3. Company Financials
- 11.1.1.4. SWOT Analysis
- 11.1.2 Nucleome Informatics Private Limited
- 11.1.2.1. Company Overview
- 11.1.2.2. Products
- 11.1.2.3. Company Financials
- 11.1.2.4. SWOT Analysis
- 11.1.3 OpGen
- 11.1.3.1. Company Overview
- 11.1.3.2. Products
- 11.1.3.3. Company Financials
- 11.1.3.4. SWOT Analysis
- 11.1.4 Bionano Genomics
- 11.1.4.1. Company Overview
- 11.1.4.2. Products
- 11.1.4.3. Company Financials
- 11.1.4.4. SWOT Analysis
- 11.1.5 PerkinElmer Inc *List Not Exhaustive
- 11.1.5.1. Company Overview
- 11.1.5.2. Products
- 11.1.5.3. Company Financials
- 11.1.5.4. SWOT Analysis
- 11.1.1 Nabsys
- 11.2. Market Entropy
- 11.2.1 Company's Key Areas Served
- 11.2.2 Recent Developments
- 11.3. Company Market Share Analysis 2025
- 11.3.1 Top 5 Companies Market Share Analysis
- 11.3.2 Top 3 Companies Market Share Analysis
- 11.4. List of Potential Customers
- 12. Research Methodology
List of Figures
- Figure 1: Global Global Optical Genome Mapping Market Revenue Breakdown (million, %) by Region 2025 & 2033
- Figure 2: North America Global Optical Genome Mapping Market Revenue (million), by Product Type 2025 & 2033
- Figure 3: North America Global Optical Genome Mapping Market Revenue Share (%), by Product Type 2025 & 2033
- Figure 4: North America Global Optical Genome Mapping Market Revenue (million), by End-User 2025 & 2033
- Figure 5: North America Global Optical Genome Mapping Market Revenue Share (%), by End-User 2025 & 2033
- Figure 6: North America Global Optical Genome Mapping Market Revenue (million), by Country 2025 & 2033
- Figure 7: North America Global Optical Genome Mapping Market Revenue Share (%), by Country 2025 & 2033
- Figure 8: Europe Global Optical Genome Mapping Market Revenue (million), by Product Type 2025 & 2033
- Figure 9: Europe Global Optical Genome Mapping Market Revenue Share (%), by Product Type 2025 & 2033
- Figure 10: Europe Global Optical Genome Mapping Market Revenue (million), by End-User 2025 & 2033
- Figure 11: Europe Global Optical Genome Mapping Market Revenue Share (%), by End-User 2025 & 2033
- Figure 12: Europe Global Optical Genome Mapping Market Revenue (million), by Country 2025 & 2033
- Figure 13: Europe Global Optical Genome Mapping Market Revenue Share (%), by Country 2025 & 2033
- Figure 14: Asia Pacific Global Optical Genome Mapping Market Revenue (million), by Product Type 2025 & 2033
- Figure 15: Asia Pacific Global Optical Genome Mapping Market Revenue Share (%), by Product Type 2025 & 2033
- Figure 16: Asia Pacific Global Optical Genome Mapping Market Revenue (million), by End-User 2025 & 2033
- Figure 17: Asia Pacific Global Optical Genome Mapping Market Revenue Share (%), by End-User 2025 & 2033
- Figure 18: Asia Pacific Global Optical Genome Mapping Market Revenue (million), by Country 2025 & 2033
- Figure 19: Asia Pacific Global Optical Genome Mapping Market Revenue Share (%), by Country 2025 & 2033
- Figure 20: Rest of World Global Optical Genome Mapping Market Revenue (million), by Product Type 2025 & 2033
- Figure 21: Rest of World Global Optical Genome Mapping Market Revenue Share (%), by Product Type 2025 & 2033
- Figure 22: Rest of World Global Optical Genome Mapping Market Revenue (million), by End-User 2025 & 2033
- Figure 23: Rest of World Global Optical Genome Mapping Market Revenue Share (%), by End-User 2025 & 2033
- Figure 24: Rest of World Global Optical Genome Mapping Market Revenue (million), by Country 2025 & 2033
- Figure 25: Rest of World Global Optical Genome Mapping Market Revenue Share (%), by Country 2025 & 2033
List of Tables
- Table 1: Global Optical Genome Mapping Market Revenue million Forecast, by Product Type 2020 & 2033
- Table 2: Global Optical Genome Mapping Market Revenue million Forecast, by End-User 2020 & 2033
- Table 3: Global Optical Genome Mapping Market Revenue million Forecast, by Region 2020 & 2033
- Table 4: Global Optical Genome Mapping Market Revenue million Forecast, by Product Type 2020 & 2033
- Table 5: Global Optical Genome Mapping Market Revenue million Forecast, by End-User 2020 & 2033
- Table 6: Global Optical Genome Mapping Market Revenue million Forecast, by Country 2020 & 2033
- Table 7: United States Global Optical Genome Mapping Market Revenue (million) Forecast, by Application 2020 & 2033
- Table 8: Canada Global Optical Genome Mapping Market Revenue (million) Forecast, by Application 2020 & 2033
- Table 9: Mexico Global Optical Genome Mapping Market Revenue (million) Forecast, by Application 2020 & 2033
- Table 10: Global Optical Genome Mapping Market Revenue million Forecast, by Product Type 2020 & 2033
- Table 11: Global Optical Genome Mapping Market Revenue million Forecast, by End-User 2020 & 2033
- Table 12: Global Optical Genome Mapping Market Revenue million Forecast, by Country 2020 & 2033
- Table 13: Germany Global Optical Genome Mapping Market Revenue (million) Forecast, by Application 2020 & 2033
- Table 14: United Kingdom Global Optical Genome Mapping Market Revenue (million) Forecast, by Application 2020 & 2033
- Table 15: France Global Optical Genome Mapping Market Revenue (million) Forecast, by Application 2020 & 2033
- Table 16: Italy Global Optical Genome Mapping Market Revenue (million) Forecast, by Application 2020 & 2033
- Table 17: Spain Global Optical Genome Mapping Market Revenue (million) Forecast, by Application 2020 & 2033
- Table 18: Rest of Europe Global Optical Genome Mapping Market Revenue (million) Forecast, by Application 2020 & 2033
- Table 19: Global Optical Genome Mapping Market Revenue million Forecast, by Product Type 2020 & 2033
- Table 20: Global Optical Genome Mapping Market Revenue million Forecast, by End-User 2020 & 2033
- Table 21: Global Optical Genome Mapping Market Revenue million Forecast, by Country 2020 & 2033
- Table 22: China Global Optical Genome Mapping Market Revenue (million) Forecast, by Application 2020 & 2033
- Table 23: Japan Global Optical Genome Mapping Market Revenue (million) Forecast, by Application 2020 & 2033
- Table 24: India Global Optical Genome Mapping Market Revenue (million) Forecast, by Application 2020 & 2033
- Table 25: Australia Global Optical Genome Mapping Market Revenue (million) Forecast, by Application 2020 & 2033
- Table 26: South Korea Global Optical Genome Mapping Market Revenue (million) Forecast, by Application 2020 & 2033
- Table 27: Rest of Asia Pacific Global Optical Genome Mapping Market Revenue (million) Forecast, by Application 2020 & 2033
- Table 28: Global Optical Genome Mapping Market Revenue million Forecast, by Product Type 2020 & 2033
- Table 29: Global Optical Genome Mapping Market Revenue million Forecast, by End-User 2020 & 2033
- Table 30: Global Optical Genome Mapping Market Revenue million Forecast, by Country 2020 & 2033
Frequently Asked Questions
1. What is the projected Compound Annual Growth Rate (CAGR) of the Global Optical Genome Mapping Market?
The projected CAGR is approximately 26.8%.
2. Which companies are prominent players in the Global Optical Genome Mapping Market?
Key companies in the market include Nabsys, Nucleome Informatics Private Limited, OpGen, Bionano Genomics, PerkinElmer Inc *List Not Exhaustive.
3. What are the main segments of the Global Optical Genome Mapping Market?
The market segments include Product Type, End-User.
4. Can you provide details about the market size?
The market size is estimated to be USD 130.53 million as of 2022.
5. What are some drivers contributing to market growth?
Rapidly Increasing Bio-Pharmaceutical Advances in Drug Development Coupled with Government Funding; Cost-effectiveness and Accuracy.
6. What are the notable trends driving market growth?
Optical Genome Mapping Instruments are Expected to Witness a Positive Growth Over the Forecast Period.
7. Are there any restraints impacting market growth?
Lack of Skilled Technicians & Complex Procedures.
8. Can you provide examples of recent developments in the market?
N/A
9. What pricing options are available for accessing the report?
Pricing options include single-user, multi-user, and enterprise licenses priced at USD 4750, USD 5250, and USD 8750 respectively.
10. Is the market size provided in terms of value or volume?
The market size is provided in terms of value, measured in million.
11. Are there any specific market keywords associated with the report?
Yes, the market keyword associated with the report is "Global Optical Genome Mapping Market," which aids in identifying and referencing the specific market segment covered.
12. How do I determine which pricing option suits my needs best?
The pricing options vary based on user requirements and access needs. Individual users may opt for single-user licenses, while businesses requiring broader access may choose multi-user or enterprise licenses for cost-effective access to the report.
13. Are there any additional resources or data provided in the Global Optical Genome Mapping Market report?
While the report offers comprehensive insights, it's advisable to review the specific contents or supplementary materials provided to ascertain if additional resources or data are available.
14. How can I stay updated on further developments or reports in the Global Optical Genome Mapping Market?
To stay informed about further developments, trends, and reports in the Global Optical Genome Mapping Market, consider subscribing to industry newsletters, following relevant companies and organizations, or regularly checking reputable industry news sources and publications.
Methodology
Step 1 - Identification of Relevant Samples Size from Population Database


Step 2 - Approaches for Defining Global Market Size (Value, Volume* & Price*)

Note*: In applicable scenarios
Step 3 - Data Sources
Primary Research
- Web Analytics
- Survey Reports
- Research Institute
- Latest Research Reports
- Opinion Leaders
Secondary Research
- Annual Reports
- White Paper
- Latest Press Release
- Industry Association
- Paid Database
- Investor Presentations

Step 4 - Data Triangulation
Involves using different sources of information in order to increase the validity of a study
These sources are likely to be stakeholders in a program - participants, other researchers, program staff, other community members, and so on.
Then we put all data in single framework & apply various statistical tools to find out the dynamic on the market.
During the analysis stage, feedback from the stakeholder groups would be compared to determine areas of agreement as well as areas of divergence