

Key Insights
The global pyrogen testing market is poised for significant expansion, projected to reach USD 1.48 Billion by 2025, with a robust Compound Annual Growth Rate (CAGR) of 7.13% through 2033. This impressive growth trajectory is underpinned by escalating concerns regarding patient safety and the increasing stringency of regulatory requirements worldwide. Pharmaceutical and biotechnology companies, alongside medical device manufacturers, are the primary end-users, heavily investing in advanced pyrogen detection methods to ensure the safety and efficacy of their products. The market is predominantly driven by the escalating prevalence of healthcare-associated infections and the critical need to prevent pyrogenic reactions during drug administration and medical procedures. Furthermore, the continuous innovation in testing methodologies, moving towards more sensitive, rapid, and cost-effective solutions like advanced LAL (Limulus Amebocyte Lysate) tests, including chromogenic and turbidimetric assays, is fueling market demand.

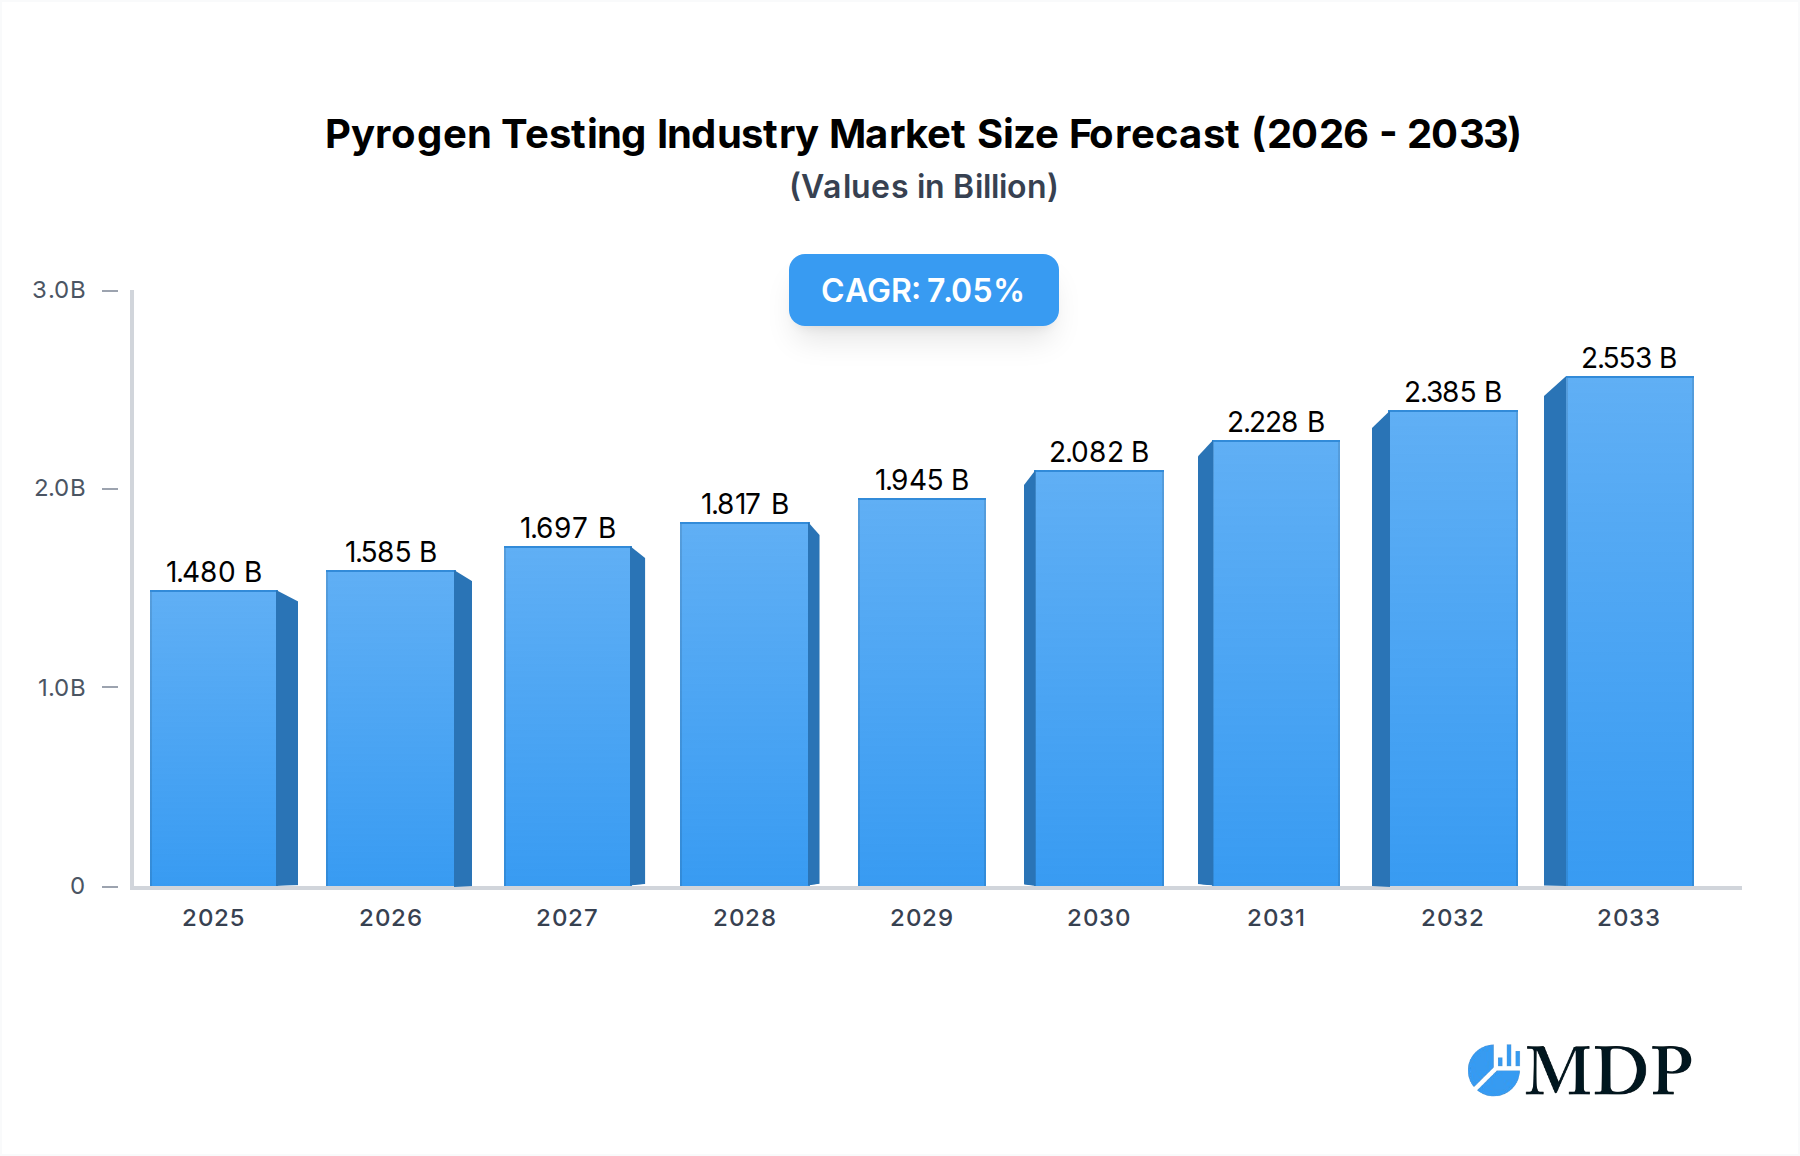
Pyrogen Testing Industry Market Size (In Billion)
Key market segments include Kits and Reagents, Services, and Instruments, with LAL tests dominating the Test Type segment. The Rabbit Pyrogen Test, while historically significant, is increasingly being complemented and, in some cases, replaced by in-vitro alternatives due to ethical considerations and advancements in technology. Emerging trends such as the development of cell-based assays and advanced bioinformatics for pyrogen identification are expected to further shape the market. However, challenges such as the high cost of advanced testing equipment and a shortage of skilled professionals in some regions could pose moderate restraints. Geographically, North America and Europe currently lead the market, driven by well-established healthcare infrastructures and stringent regulatory frameworks. The Asia Pacific region, however, presents a substantial growth opportunity due to its expanding pharmaceutical manufacturing base and increasing focus on healthcare quality.
Pyrogen Testing Industry Company Market Share
This in-depth report provides a comprehensive analysis of the global Pyrogen Testing Industry, offering actionable insights for stakeholders, investors, and industry professionals. Covering the period from 2019 to 2033, with a base year of 2025 and a forecast period from 2025 to 2033, this report delves into market dynamics, emerging trends, leading segments, and strategic outlook. The pyrogen testing market is critical for ensuring the safety of pharmaceutical and medical products, with significant growth projected driven by increasing regulatory stringency and the rising prevalence of injectable drug therapies. The market is expected to reach over $2.5 Million by 2025, with a Compound Annual Growth Rate (CAGR) of over 8.0% during the forecast period.
Pyrogen Testing Industry Market Dynamics & Concentration
The pyrogen testing market exhibits a moderate to high level of concentration, with a mix of large multinational corporations and specialized niche players. Key innovation drivers include the development of more sensitive and rapid testing methods, particularly advancements in LAL (Limulus Amebocyte Lysate) testing, and the increasing adoption of in vitro alternatives to traditional animal testing. Regulatory frameworks, such as those mandated by the FDA and EMA, are continuously evolving to ensure product safety, thereby driving demand for advanced pyrogen testing solutions. Product substitutes, while emerging, are yet to fully displace established LAL-based methods, though monocyte activation tests are gaining traction. End-user trends reveal a growing preference for integrated testing solutions and outsourcing of pyrogen testing services to specialized contract research organizations (CROs). Mergers and acquisitions (M&A) activities are prevalent as larger companies seek to expand their portfolios and geographic reach. For instance, in the historical period (2019-2024), there were approximately 5-10 significant M&A deals valued in the tens of millions. Market share for the top 5 players is estimated to be around 50-60%.
Pyrogen Testing Industry Industry Trends & Analysis
The pyrogen testing industry is experiencing robust growth, fueled by several key market growth drivers. The escalating demand for sterile injectable drugs, coupled with the expanding biopharmaceutical sector, directly translates to a higher need for reliable pyrogen detection. Strict regulatory guidelines from global health authorities, such as the US FDA and European Medicines Agency (EMA), mandate rigorous pyrogen testing for all parenteral products, further propelling market expansion. Technological disruptions are significantly impacting the industry, with the development of novel, faster, and more sensitive testing methodologies. This includes advancements in chromogenic and turbidimetric LAL assays, offering quantitative results and reduced testing times. The increasing adoption of in vitro alternatives like the Monocyte Activation Test (MAT) is also a significant trend, driven by ethical considerations regarding animal testing and the pursuit of more predictive assays. Consumer preferences, particularly from pharmaceutical and biotechnology companies, are shifting towards cost-effective, high-throughput, and automated pyrogen testing solutions. This has led to the development of advanced instrumentation and integrated platforms. Competitive dynamics are characterized by intense R&D efforts, strategic partnerships, and a focus on product differentiation. The market penetration of advanced LAL testing kits and services is continuously increasing, with an estimated 85% of parenteral product manufacturers relying on these methods. The overall market size is projected to grow from over $1.8 Million in 2019 to over $2.5 Million by 2025, with a CAGR of approximately 8.2% during the forecast period.
Leading Markets & Segments in Pyrogen Testing Industry
North America, particularly the United States, currently holds the dominant position in the global pyrogen testing market. This dominance is attributed to a highly developed pharmaceutical and biotechnology industry, stringent regulatory oversight, and significant investment in R&D for new drug development.
Product Segment Dominance: The "Kits and Reagents" segment is the largest contributor to the pyrogen testing market revenue. Key drivers for this segment's leadership include:
- High Volume Usage: Pharmaceutical and biotechnology companies require a consistent supply of LAL reagents and assay kits for routine quality control and product release.
- Technological Advancements: Continuous innovation in LAL reagent formulations and kit design, leading to improved sensitivity, specificity, and faster turnaround times, sustains demand.
- Regulatory Compliance: The widespread reliance on LAL-based testing for regulatory compliance ensures sustained demand for these essential components.
- Market Share: This segment accounts for an estimated 45-50% of the overall market.
Test Type Segment Dominance: LAL Tests, encompassing Chromogenic Tests, Turbidimetric Tests, and Gel Clot Tests, are the most widely adopted test types.
- Established Efficacy: LAL tests are the gold standard for endotoxin detection, recognized and mandated by pharmacopeias worldwide.
- Versatility: The availability of different LAL test formats allows for flexibility in testing various sample types and volumes.
- Growth in Quantitative Methods: Chromogenic and turbidimetric assays, offering quantitative results, are gaining increasing preference over traditional gel clot tests due to their precision and automation potential.
- Market Share: LAL tests collectively represent over 75% of the total test type market.
End User Segment Dominance: Pharmaceutical and Biotechnology Companies are the primary end-users of pyrogen testing products and services.
- Extensive Product Pipelines: The vast number of drug development and manufacturing activities within these sectors necessitates continuous and extensive pyrogen testing.
- Stringent Quality Control: The inherent risks associated with injectable drug administration place immense emphasis on rigorous quality control and pyrogen-free products.
- Outsourcing Trends: A significant portion of pyrogen testing is outsourced to specialized CROs, further bolstering the demand from this end-user group.
- Market Share: This segment contributes an estimated 70-75% of the total end-user market revenue.
Pyrogen Testing Industry Product Developments
Recent product developments in the pyrogen testing industry are primarily focused on enhancing speed, sensitivity, and automation. Innovations in LAL reagent formulation have led to kits with extended shelf-lives and improved performance under varied conditions. The introduction of microfluidic-based testing platforms promises rapid, point-of-care pyrogen detection, significantly reducing assay times. Furthermore, there's a growing emphasis on developing and validating in vitro alternatives that offer comparable or superior predictive value to traditional methods, aligning with global trends towards animal welfare and the 3Rs (Replacement, Reduction, Refinement). These advancements provide competitive advantages by enabling faster product release, reducing operational costs, and ensuring compliance with evolving regulatory demands.
Key Drivers of Pyrogen Testing Industry Growth
The pyrogen testing industry's growth is propelled by a confluence of factors. Firstly, the increasing prevalence of injectable drug therapies and the expansion of the biopharmaceutical sector directly escalate the demand for robust pyrogen detection. Secondly, stringent regulatory mandates from global health authorities, such as the FDA and EMA, which emphasize product safety and require rigorous pyrogen testing for all parenteral products, are critical drivers. Technologically, the ongoing development of more sensitive, rapid, and automated pyrogen testing solutions, including advancements in LAL assays and in vitro alternatives, fuels market adoption. Economic factors, such as increasing healthcare expenditure and R&D investments by pharmaceutical companies, also contribute significantly by driving the development of new drug candidates that require comprehensive safety testing.
Challenges in the Pyrogen Testing Industry Market
Despite its growth trajectory, the pyrogen testing industry faces several challenges. The high cost associated with some advanced testing methodologies and instrumentation can be a barrier for smaller organizations. Stringent and evolving regulatory requirements, while a driver, also necessitate continuous investment in validation and compliance, which can be resource-intensive. The availability and supply chain of critical raw materials, particularly for LAL production, can sometimes be subject to disruptions. Furthermore, the traditional reliance on animal-based testing (Rabbit Pyrogen Test) faces ethical scrutiny and is gradually being replaced by in vitro methods, requiring a transition in infrastructure and expertise. Competitive pressures from both established players and emerging technologies also pose a continuous challenge.
Emerging Opportunities in Pyrogen Testing Industry
Emerging opportunities in the pyrogen testing industry are vast and diverse. The increasing adoption of in vitro alternatives, such as the Monocyte Activation Test (MAT), presents a significant growth avenue as regulatory bodies progressively accept these methods. Advancements in automation and artificial intelligence (AI) for data analysis and interpretation of pyrogen test results offer opportunities for enhanced efficiency and reduced human error. The burgeoning field of cell and gene therapies, which are often administered parenterally, requires highly sensitive and specialized pyrogen testing solutions, creating a niche market. Furthermore, the expansion of pharmaceutical manufacturing in emerging economies, coupled with the global push for harmonized regulatory standards, opens up new geographic markets for pyrogen testing solutions and services. Strategic partnerships between technology providers and contract research organizations will also play a crucial role in market expansion.
Leading Players in the Pyrogen Testing Industry Sector
- Microcoat Biotechnologie GmbH
- BioMerieux SA
- Merck Kgaa
- Lonza Group
- Sotera Health (Nelson Laboratories LLC)
- Fujifilm Holdings Corporation (FUJIFILM Wako Pure Chemical Corporation)
- Eurofins Scientific
- Thermo Fisher Scientific Inc
- WUXI Pharmatech (Cayman) Inc
- Genscript
- Associates of Cape Cod Inc (Seikagaku Biobusiness Corporation)
- Charles River Laboratories Inc
- Sanquin
- Pyrostar
- Ellab AS
Key Milestones in Pyrogen Testing Industry Industry
- 2019: Increased regulatory focus on endotoxin detection in new biologic drug formulations.
- 2020: Significant advancements in chromogenic LAL assay sensitivity and speed, enabling faster batch release.
- 2021: Growing adoption of Monocyte Activation Test (MAT) as a viable in vitro alternative to rabbit tests in some regions.
- 2022: Introduction of automated LAL testing platforms, improving throughput and reducing manual error.
- 2023: Expansion of pyrogen testing services by major CROs to cater to the growing biopharmaceutical pipeline.
- 2024: Enhanced regulatory guidance on the validation and implementation of alternative pyrogen testing methods.
Strategic Outlook for Pyrogen Testing Industry Market
The strategic outlook for the pyrogen testing industry remains highly positive, with sustained growth anticipated. Key growth accelerators will include the continued development and regulatory acceptance of in vitro pyrogen testing alternatives, offering ethical and economic advantages. The increasing complexity of biologics and advanced therapies will necessitate highly sensitive and specialized testing methodologies. Investments in automation and digital technologies, such as AI-driven data analysis, will further enhance efficiency and accuracy. Market expansion into emerging economies, driven by the growth of their domestic pharmaceutical industries and increasing regulatory harmonization, presents significant opportunities. Strategic collaborations and acquisitions will continue to shape the competitive landscape, allowing companies to broaden their product portfolios and service offerings. The industry is poised for innovation, focusing on speed, sensitivity, and cost-effectiveness to meet the ever-evolving demands of global healthcare.
Pyrogen Testing Industry Segmentation
-
1. Product
- 1.1. Kits and Reagents
- 1.2. Services
- 1.3. Instruments
-
2. Test Type
-
2.1. LAL Tests
- 2.1.1. Chromogenic Tests
- 2.1.2. Turbidimetric Tests
- 2.1.3. Gel Clot Tests
- 2.2. Rabbit Pyrogen Test
- 2.3. Monocyte Activation Test
- 2.4. Other Test Types
-
2.1. LAL Tests
-
3. End User
- 3.1. Pharmaceutical and Biotechnology Companies
- 3.2. Medical Device Companies
- 3.3. Other End Users
Pyrogen Testing Industry Segmentation By Geography
-
1. North America
- 1.1. United States
- 1.2. Canada
- 1.3. Mexico
-
2. Europe
- 2.1. Germany
- 2.2. United Kingdom
- 2.3. France
- 2.4. Italy
- 2.5. Spain
- 2.6. Rest of Europe
-
3. Asia Pacific
- 3.1. China
- 3.2. Japan
- 3.3. India
- 3.4. Australia
- 3.5. South Korea
- 3.6. Rest of Asia Pacific
-
4. Middle East and Africa
- 4.1. GCC
- 4.2. South Africa
- 4.3. Rest of Middle East and Africa
-
5. South America
- 5.1. Brazil
- 5.2. Argentina
- 5.3. Rest of South America

Pyrogen Testing Industry Regional Market Share
Geographic Coverage of Pyrogen Testing Industry
Pyrogen Testing Industry REPORT HIGHLIGHTS
| Aspects | Details |
|---|---|
| Study Period | 2020-2034 |
| Base Year | 2025 |
| Estimated Year | 2026 |
| Forecast Period | 2026-2034 |
| Historical Period | 2020-2025 |
| Growth Rate | CAGR of 7.13% from 2020-2034 |
| Segmentation |
|
Table of Contents
- 1. Introduction
- 1.1. Research Scope
- 1.2. Market Segmentation
- 1.3. Research Objective
- 1.4. Definitions and Assumptions
- 2. Executive Summary
- 2.1. Market Snapshot
- 3. Market Dynamics
- 3.1. Market Drivers
- 3.2. Market Restrains
- 3.3. Market Trends
- 3.4. Market Opportunities
- 4. Market Factor Analysis
- 4.1. Porters Five Forces
- 4.1.1. Bargaining Power of Suppliers
- 4.1.2. Bargaining Power of Buyers
- 4.1.3. Threat of New Entrants
- 4.1.4. Threat of Substitutes
- 4.1.5. Competitive Rivalry
- 4.2. PESTEL analysis
- 4.3. BCG Analysis
- 4.3.1. Stars (High Growth, High Market Share)
- 4.3.2. Cash Cows (Low Growth, High Market Share)
- 4.3.3. Question Mark (High Growth, Low Market Share)
- 4.3.4. Dogs (Low Growth, Low Market Share)
- 4.4. Ansoff Matrix Analysis
- 4.5. Supply Chain Analysis
- 4.6. Regulatory Landscape
- 4.7. Current Market Potential and Opportunity Assessment (TAM–SAM–SOM Framework)
- 4.8. MDP Analyst Note
- 4.1. Porters Five Forces
- 5. Market Analysis, Insights and Forecast 2021-2033
- 5.1. Market Analysis, Insights and Forecast - by Product
- 5.1.1. Kits and Reagents
- 5.1.2. Services
- 5.1.3. Instruments
- 5.2. Market Analysis, Insights and Forecast - by Test Type
- 5.2.1. LAL Tests
- 5.2.1.1. Chromogenic Tests
- 5.2.1.2. Turbidimetric Tests
- 5.2.1.3. Gel Clot Tests
- 5.2.2. Rabbit Pyrogen Test
- 5.2.3. Monocyte Activation Test
- 5.2.4. Other Test Types
- 5.2.1. LAL Tests
- 5.3. Market Analysis, Insights and Forecast - by End User
- 5.3.1. Pharmaceutical and Biotechnology Companies
- 5.3.2. Medical Device Companies
- 5.3.3. Other End Users
- 5.4. Market Analysis, Insights and Forecast - by Region
- 5.4.1. North America
- 5.4.2. Europe
- 5.4.3. Asia Pacific
- 5.4.4. Middle East and Africa
- 5.4.5. South America
- 5.1. Market Analysis, Insights and Forecast - by Product
- 6. Global Pyrogen Testing Industry Analysis, Insights and Forecast, 2021-2033
- 6.1. Market Analysis, Insights and Forecast - by Product
- 6.1.1. Kits and Reagents
- 6.1.2. Services
- 6.1.3. Instruments
- 6.2. Market Analysis, Insights and Forecast - by Test Type
- 6.2.1. LAL Tests
- 6.2.1.1. Chromogenic Tests
- 6.2.1.2. Turbidimetric Tests
- 6.2.1.3. Gel Clot Tests
- 6.2.2. Rabbit Pyrogen Test
- 6.2.3. Monocyte Activation Test
- 6.2.4. Other Test Types
- 6.2.1. LAL Tests
- 6.3. Market Analysis, Insights and Forecast - by End User
- 6.3.1. Pharmaceutical and Biotechnology Companies
- 6.3.2. Medical Device Companies
- 6.3.3. Other End Users
- 6.1. Market Analysis, Insights and Forecast - by Product
- 7. North America Pyrogen Testing Industry Analysis, Insights and Forecast, 2020-2032
- 7.1. Market Analysis, Insights and Forecast - by Product
- 7.1.1. Kits and Reagents
- 7.1.2. Services
- 7.1.3. Instruments
- 7.2. Market Analysis, Insights and Forecast - by Test Type
- 7.2.1. LAL Tests
- 7.2.1.1. Chromogenic Tests
- 7.2.1.2. Turbidimetric Tests
- 7.2.1.3. Gel Clot Tests
- 7.2.2. Rabbit Pyrogen Test
- 7.2.3. Monocyte Activation Test
- 7.2.4. Other Test Types
- 7.2.1. LAL Tests
- 7.3. Market Analysis, Insights and Forecast - by End User
- 7.3.1. Pharmaceutical and Biotechnology Companies
- 7.3.2. Medical Device Companies
- 7.3.3. Other End Users
- 7.1. Market Analysis, Insights and Forecast - by Product
- 8. Europe Pyrogen Testing Industry Analysis, Insights and Forecast, 2020-2032
- 8.1. Market Analysis, Insights and Forecast - by Product
- 8.1.1. Kits and Reagents
- 8.1.2. Services
- 8.1.3. Instruments
- 8.2. Market Analysis, Insights and Forecast - by Test Type
- 8.2.1. LAL Tests
- 8.2.1.1. Chromogenic Tests
- 8.2.1.2. Turbidimetric Tests
- 8.2.1.3. Gel Clot Tests
- 8.2.2. Rabbit Pyrogen Test
- 8.2.3. Monocyte Activation Test
- 8.2.4. Other Test Types
- 8.2.1. LAL Tests
- 8.3. Market Analysis, Insights and Forecast - by End User
- 8.3.1. Pharmaceutical and Biotechnology Companies
- 8.3.2. Medical Device Companies
- 8.3.3. Other End Users
- 8.1. Market Analysis, Insights and Forecast - by Product
- 9. Asia Pacific Pyrogen Testing Industry Analysis, Insights and Forecast, 2020-2032
- 9.1. Market Analysis, Insights and Forecast - by Product
- 9.1.1. Kits and Reagents
- 9.1.2. Services
- 9.1.3. Instruments
- 9.2. Market Analysis, Insights and Forecast - by Test Type
- 9.2.1. LAL Tests
- 9.2.1.1. Chromogenic Tests
- 9.2.1.2. Turbidimetric Tests
- 9.2.1.3. Gel Clot Tests
- 9.2.2. Rabbit Pyrogen Test
- 9.2.3. Monocyte Activation Test
- 9.2.4. Other Test Types
- 9.2.1. LAL Tests
- 9.3. Market Analysis, Insights and Forecast - by End User
- 9.3.1. Pharmaceutical and Biotechnology Companies
- 9.3.2. Medical Device Companies
- 9.3.3. Other End Users
- 9.1. Market Analysis, Insights and Forecast - by Product
- 10. Middle East and Africa Pyrogen Testing Industry Analysis, Insights and Forecast, 2020-2032
- 10.1. Market Analysis, Insights and Forecast - by Product
- 10.1.1. Kits and Reagents
- 10.1.2. Services
- 10.1.3. Instruments
- 10.2. Market Analysis, Insights and Forecast - by Test Type
- 10.2.1. LAL Tests
- 10.2.1.1. Chromogenic Tests
- 10.2.1.2. Turbidimetric Tests
- 10.2.1.3. Gel Clot Tests
- 10.2.2. Rabbit Pyrogen Test
- 10.2.3. Monocyte Activation Test
- 10.2.4. Other Test Types
- 10.2.1. LAL Tests
- 10.3. Market Analysis, Insights and Forecast - by End User
- 10.3.1. Pharmaceutical and Biotechnology Companies
- 10.3.2. Medical Device Companies
- 10.3.3. Other End Users
- 10.1. Market Analysis, Insights and Forecast - by Product
- 11. South America Pyrogen Testing Industry Analysis, Insights and Forecast, 2020-2032
- 11.1. Market Analysis, Insights and Forecast - by Product
- 11.1.1. Kits and Reagents
- 11.1.2. Services
- 11.1.3. Instruments
- 11.2. Market Analysis, Insights and Forecast - by Test Type
- 11.2.1. LAL Tests
- 11.2.1.1. Chromogenic Tests
- 11.2.1.2. Turbidimetric Tests
- 11.2.1.3. Gel Clot Tests
- 11.2.2. Rabbit Pyrogen Test
- 11.2.3. Monocyte Activation Test
- 11.2.4. Other Test Types
- 11.2.1. LAL Tests
- 11.3. Market Analysis, Insights and Forecast - by End User
- 11.3.1. Pharmaceutical and Biotechnology Companies
- 11.3.2. Medical Device Companies
- 11.3.3. Other End Users
- 11.1. Market Analysis, Insights and Forecast - by Product
- 12. Competitive Analysis
- 12.1. Company Profiles
- 12.1.1 Microcoat Biotechnologie GmbH
- 12.1.1.1. Company Overview
- 12.1.1.2. Products
- 12.1.1.3. Company Financials
- 12.1.1.4. SWOT Analysis
- 12.1.2 BioMerieux SA
- 12.1.2.1. Company Overview
- 12.1.2.2. Products
- 12.1.2.3. Company Financials
- 12.1.2.4. SWOT Analysis
- 12.1.3 Merck Kgaa
- 12.1.3.1. Company Overview
- 12.1.3.2. Products
- 12.1.3.3. Company Financials
- 12.1.3.4. SWOT Analysis
- 12.1.4 Lonza Group
- 12.1.4.1. Company Overview
- 12.1.4.2. Products
- 12.1.4.3. Company Financials
- 12.1.4.4. SWOT Analysis
- 12.1.5 Sotera Health (Nelson Laboratories LLC)
- 12.1.5.1. Company Overview
- 12.1.5.2. Products
- 12.1.5.3. Company Financials
- 12.1.5.4. SWOT Analysis
- 12.1.6 Fujifilm Holdings Corporation (FUJIFILM Wako Pure Chemical Corporation)
- 12.1.6.1. Company Overview
- 12.1.6.2. Products
- 12.1.6.3. Company Financials
- 12.1.6.4. SWOT Analysis
- 12.1.7 Eurofins Scientific
- 12.1.7.1. Company Overview
- 12.1.7.2. Products
- 12.1.7.3. Company Financials
- 12.1.7.4. SWOT Analysis
- 12.1.8 Thermo Fisher Scientific Inc
- 12.1.8.1. Company Overview
- 12.1.8.2. Products
- 12.1.8.3. Company Financials
- 12.1.8.4. SWOT Analysis
- 12.1.9 WUXI Pharmatech (Cayman) Inc
- 12.1.9.1. Company Overview
- 12.1.9.2. Products
- 12.1.9.3. Company Financials
- 12.1.9.4. SWOT Analysis
- 12.1.10 Genscript
- 12.1.10.1. Company Overview
- 12.1.10.2. Products
- 12.1.10.3. Company Financials
- 12.1.10.4. SWOT Analysis
- 12.1.11 Associates of Cape Cod Inc (Seikagaku Biobusiness Corporation)
- 12.1.11.1. Company Overview
- 12.1.11.2. Products
- 12.1.11.3. Company Financials
- 12.1.11.4. SWOT Analysis
- 12.1.12 Microcoat Biotechnologie GmbH
- 12.1.12.1. Company Overview
- 12.1.12.2. Products
- 12.1.12.3. Company Financials
- 12.1.12.4. SWOT Analysis
- 12.1.13 Charles River Laboratories Inc
- 12.1.13.1. Company Overview
- 12.1.13.2. Products
- 12.1.13.3. Company Financials
- 12.1.13.4. SWOT Analysis
- 12.1.14 Sanquin
- 12.1.14.1. Company Overview
- 12.1.14.2. Products
- 12.1.14.3. Company Financials
- 12.1.14.4. SWOT Analysis
- 12.1.15 Pyrostar
- 12.1.15.1. Company Overview
- 12.1.15.2. Products
- 12.1.15.3. Company Financials
- 12.1.15.4. SWOT Analysis
- 12.1.16 Ellab AS
- 12.1.16.1. Company Overview
- 12.1.16.2. Products
- 12.1.16.3. Company Financials
- 12.1.16.4. SWOT Analysis
- 12.1.1 Microcoat Biotechnologie GmbH
- 12.2. Market Entropy
- 12.2.1 Company's Key Areas Served
- 12.2.2 Recent Developments
- 12.3. Company Market Share Analysis 2025
- 12.3.1 Top 5 Companies Market Share Analysis
- 12.3.2 Top 3 Companies Market Share Analysis
- 12.4. List of Potential Customers
- 13. Research Methodology
List of Figures
- Figure 1: Global Pyrogen Testing Industry Revenue Breakdown (Million, %) by Region 2025 & 2033
- Figure 2: Global Pyrogen Testing Industry Volume Breakdown (K Unit, %) by Region 2025 & 2033
- Figure 3: North America Pyrogen Testing Industry Revenue (Million), by Product 2025 & 2033
- Figure 4: North America Pyrogen Testing Industry Volume (K Unit), by Product 2025 & 2033
- Figure 5: North America Pyrogen Testing Industry Revenue Share (%), by Product 2025 & 2033
- Figure 6: North America Pyrogen Testing Industry Volume Share (%), by Product 2025 & 2033
- Figure 7: North America Pyrogen Testing Industry Revenue (Million), by Test Type 2025 & 2033
- Figure 8: North America Pyrogen Testing Industry Volume (K Unit), by Test Type 2025 & 2033
- Figure 9: North America Pyrogen Testing Industry Revenue Share (%), by Test Type 2025 & 2033
- Figure 10: North America Pyrogen Testing Industry Volume Share (%), by Test Type 2025 & 2033
- Figure 11: North America Pyrogen Testing Industry Revenue (Million), by End User 2025 & 2033
- Figure 12: North America Pyrogen Testing Industry Volume (K Unit), by End User 2025 & 2033
- Figure 13: North America Pyrogen Testing Industry Revenue Share (%), by End User 2025 & 2033
- Figure 14: North America Pyrogen Testing Industry Volume Share (%), by End User 2025 & 2033
- Figure 15: North America Pyrogen Testing Industry Revenue (Million), by Country 2025 & 2033
- Figure 16: North America Pyrogen Testing Industry Volume (K Unit), by Country 2025 & 2033
- Figure 17: North America Pyrogen Testing Industry Revenue Share (%), by Country 2025 & 2033
- Figure 18: North America Pyrogen Testing Industry Volume Share (%), by Country 2025 & 2033
- Figure 19: Europe Pyrogen Testing Industry Revenue (Million), by Product 2025 & 2033
- Figure 20: Europe Pyrogen Testing Industry Volume (K Unit), by Product 2025 & 2033
- Figure 21: Europe Pyrogen Testing Industry Revenue Share (%), by Product 2025 & 2033
- Figure 22: Europe Pyrogen Testing Industry Volume Share (%), by Product 2025 & 2033
- Figure 23: Europe Pyrogen Testing Industry Revenue (Million), by Test Type 2025 & 2033
- Figure 24: Europe Pyrogen Testing Industry Volume (K Unit), by Test Type 2025 & 2033
- Figure 25: Europe Pyrogen Testing Industry Revenue Share (%), by Test Type 2025 & 2033
- Figure 26: Europe Pyrogen Testing Industry Volume Share (%), by Test Type 2025 & 2033
- Figure 27: Europe Pyrogen Testing Industry Revenue (Million), by End User 2025 & 2033
- Figure 28: Europe Pyrogen Testing Industry Volume (K Unit), by End User 2025 & 2033
- Figure 29: Europe Pyrogen Testing Industry Revenue Share (%), by End User 2025 & 2033
- Figure 30: Europe Pyrogen Testing Industry Volume Share (%), by End User 2025 & 2033
- Figure 31: Europe Pyrogen Testing Industry Revenue (Million), by Country 2025 & 2033
- Figure 32: Europe Pyrogen Testing Industry Volume (K Unit), by Country 2025 & 2033
- Figure 33: Europe Pyrogen Testing Industry Revenue Share (%), by Country 2025 & 2033
- Figure 34: Europe Pyrogen Testing Industry Volume Share (%), by Country 2025 & 2033
- Figure 35: Asia Pacific Pyrogen Testing Industry Revenue (Million), by Product 2025 & 2033
- Figure 36: Asia Pacific Pyrogen Testing Industry Volume (K Unit), by Product 2025 & 2033
- Figure 37: Asia Pacific Pyrogen Testing Industry Revenue Share (%), by Product 2025 & 2033
- Figure 38: Asia Pacific Pyrogen Testing Industry Volume Share (%), by Product 2025 & 2033
- Figure 39: Asia Pacific Pyrogen Testing Industry Revenue (Million), by Test Type 2025 & 2033
- Figure 40: Asia Pacific Pyrogen Testing Industry Volume (K Unit), by Test Type 2025 & 2033
- Figure 41: Asia Pacific Pyrogen Testing Industry Revenue Share (%), by Test Type 2025 & 2033
- Figure 42: Asia Pacific Pyrogen Testing Industry Volume Share (%), by Test Type 2025 & 2033
- Figure 43: Asia Pacific Pyrogen Testing Industry Revenue (Million), by End User 2025 & 2033
- Figure 44: Asia Pacific Pyrogen Testing Industry Volume (K Unit), by End User 2025 & 2033
- Figure 45: Asia Pacific Pyrogen Testing Industry Revenue Share (%), by End User 2025 & 2033
- Figure 46: Asia Pacific Pyrogen Testing Industry Volume Share (%), by End User 2025 & 2033
- Figure 47: Asia Pacific Pyrogen Testing Industry Revenue (Million), by Country 2025 & 2033
- Figure 48: Asia Pacific Pyrogen Testing Industry Volume (K Unit), by Country 2025 & 2033
- Figure 49: Asia Pacific Pyrogen Testing Industry Revenue Share (%), by Country 2025 & 2033
- Figure 50: Asia Pacific Pyrogen Testing Industry Volume Share (%), by Country 2025 & 2033
- Figure 51: Middle East and Africa Pyrogen Testing Industry Revenue (Million), by Product 2025 & 2033
- Figure 52: Middle East and Africa Pyrogen Testing Industry Volume (K Unit), by Product 2025 & 2033
- Figure 53: Middle East and Africa Pyrogen Testing Industry Revenue Share (%), by Product 2025 & 2033
- Figure 54: Middle East and Africa Pyrogen Testing Industry Volume Share (%), by Product 2025 & 2033
- Figure 55: Middle East and Africa Pyrogen Testing Industry Revenue (Million), by Test Type 2025 & 2033
- Figure 56: Middle East and Africa Pyrogen Testing Industry Volume (K Unit), by Test Type 2025 & 2033
- Figure 57: Middle East and Africa Pyrogen Testing Industry Revenue Share (%), by Test Type 2025 & 2033
- Figure 58: Middle East and Africa Pyrogen Testing Industry Volume Share (%), by Test Type 2025 & 2033
- Figure 59: Middle East and Africa Pyrogen Testing Industry Revenue (Million), by End User 2025 & 2033
- Figure 60: Middle East and Africa Pyrogen Testing Industry Volume (K Unit), by End User 2025 & 2033
- Figure 61: Middle East and Africa Pyrogen Testing Industry Revenue Share (%), by End User 2025 & 2033
- Figure 62: Middle East and Africa Pyrogen Testing Industry Volume Share (%), by End User 2025 & 2033
- Figure 63: Middle East and Africa Pyrogen Testing Industry Revenue (Million), by Country 2025 & 2033
- Figure 64: Middle East and Africa Pyrogen Testing Industry Volume (K Unit), by Country 2025 & 2033
- Figure 65: Middle East and Africa Pyrogen Testing Industry Revenue Share (%), by Country 2025 & 2033
- Figure 66: Middle East and Africa Pyrogen Testing Industry Volume Share (%), by Country 2025 & 2033
- Figure 67: South America Pyrogen Testing Industry Revenue (Million), by Product 2025 & 2033
- Figure 68: South America Pyrogen Testing Industry Volume (K Unit), by Product 2025 & 2033
- Figure 69: South America Pyrogen Testing Industry Revenue Share (%), by Product 2025 & 2033
- Figure 70: South America Pyrogen Testing Industry Volume Share (%), by Product 2025 & 2033
- Figure 71: South America Pyrogen Testing Industry Revenue (Million), by Test Type 2025 & 2033
- Figure 72: South America Pyrogen Testing Industry Volume (K Unit), by Test Type 2025 & 2033
- Figure 73: South America Pyrogen Testing Industry Revenue Share (%), by Test Type 2025 & 2033
- Figure 74: South America Pyrogen Testing Industry Volume Share (%), by Test Type 2025 & 2033
- Figure 75: South America Pyrogen Testing Industry Revenue (Million), by End User 2025 & 2033
- Figure 76: South America Pyrogen Testing Industry Volume (K Unit), by End User 2025 & 2033
- Figure 77: South America Pyrogen Testing Industry Revenue Share (%), by End User 2025 & 2033
- Figure 78: South America Pyrogen Testing Industry Volume Share (%), by End User 2025 & 2033
- Figure 79: South America Pyrogen Testing Industry Revenue (Million), by Country 2025 & 2033
- Figure 80: South America Pyrogen Testing Industry Volume (K Unit), by Country 2025 & 2033
- Figure 81: South America Pyrogen Testing Industry Revenue Share (%), by Country 2025 & 2033
- Figure 82: South America Pyrogen Testing Industry Volume Share (%), by Country 2025 & 2033
List of Tables
- Table 1: Global Pyrogen Testing Industry Revenue Million Forecast, by Product 2020 & 2033
- Table 2: Global Pyrogen Testing Industry Volume K Unit Forecast, by Product 2020 & 2033
- Table 3: Global Pyrogen Testing Industry Revenue Million Forecast, by Test Type 2020 & 2033
- Table 4: Global Pyrogen Testing Industry Volume K Unit Forecast, by Test Type 2020 & 2033
- Table 5: Global Pyrogen Testing Industry Revenue Million Forecast, by End User 2020 & 2033
- Table 6: Global Pyrogen Testing Industry Volume K Unit Forecast, by End User 2020 & 2033
- Table 7: Global Pyrogen Testing Industry Revenue Million Forecast, by Region 2020 & 2033
- Table 8: Global Pyrogen Testing Industry Volume K Unit Forecast, by Region 2020 & 2033
- Table 9: Global Pyrogen Testing Industry Revenue Million Forecast, by Product 2020 & 2033
- Table 10: Global Pyrogen Testing Industry Volume K Unit Forecast, by Product 2020 & 2033
- Table 11: Global Pyrogen Testing Industry Revenue Million Forecast, by Test Type 2020 & 2033
- Table 12: Global Pyrogen Testing Industry Volume K Unit Forecast, by Test Type 2020 & 2033
- Table 13: Global Pyrogen Testing Industry Revenue Million Forecast, by End User 2020 & 2033
- Table 14: Global Pyrogen Testing Industry Volume K Unit Forecast, by End User 2020 & 2033
- Table 15: Global Pyrogen Testing Industry Revenue Million Forecast, by Country 2020 & 2033
- Table 16: Global Pyrogen Testing Industry Volume K Unit Forecast, by Country 2020 & 2033
- Table 17: United States Pyrogen Testing Industry Revenue (Million) Forecast, by Application 2020 & 2033
- Table 18: United States Pyrogen Testing Industry Volume (K Unit) Forecast, by Application 2020 & 2033
- Table 19: Canada Pyrogen Testing Industry Revenue (Million) Forecast, by Application 2020 & 2033
- Table 20: Canada Pyrogen Testing Industry Volume (K Unit) Forecast, by Application 2020 & 2033
- Table 21: Mexico Pyrogen Testing Industry Revenue (Million) Forecast, by Application 2020 & 2033
- Table 22: Mexico Pyrogen Testing Industry Volume (K Unit) Forecast, by Application 2020 & 2033
- Table 23: Global Pyrogen Testing Industry Revenue Million Forecast, by Product 2020 & 2033
- Table 24: Global Pyrogen Testing Industry Volume K Unit Forecast, by Product 2020 & 2033
- Table 25: Global Pyrogen Testing Industry Revenue Million Forecast, by Test Type 2020 & 2033
- Table 26: Global Pyrogen Testing Industry Volume K Unit Forecast, by Test Type 2020 & 2033
- Table 27: Global Pyrogen Testing Industry Revenue Million Forecast, by End User 2020 & 2033
- Table 28: Global Pyrogen Testing Industry Volume K Unit Forecast, by End User 2020 & 2033
- Table 29: Global Pyrogen Testing Industry Revenue Million Forecast, by Country 2020 & 2033
- Table 30: Global Pyrogen Testing Industry Volume K Unit Forecast, by Country 2020 & 2033
- Table 31: Germany Pyrogen Testing Industry Revenue (Million) Forecast, by Application 2020 & 2033
- Table 32: Germany Pyrogen Testing Industry Volume (K Unit) Forecast, by Application 2020 & 2033
- Table 33: United Kingdom Pyrogen Testing Industry Revenue (Million) Forecast, by Application 2020 & 2033
- Table 34: United Kingdom Pyrogen Testing Industry Volume (K Unit) Forecast, by Application 2020 & 2033
- Table 35: France Pyrogen Testing Industry Revenue (Million) Forecast, by Application 2020 & 2033
- Table 36: France Pyrogen Testing Industry Volume (K Unit) Forecast, by Application 2020 & 2033
- Table 37: Italy Pyrogen Testing Industry Revenue (Million) Forecast, by Application 2020 & 2033
- Table 38: Italy Pyrogen Testing Industry Volume (K Unit) Forecast, by Application 2020 & 2033
- Table 39: Spain Pyrogen Testing Industry Revenue (Million) Forecast, by Application 2020 & 2033
- Table 40: Spain Pyrogen Testing Industry Volume (K Unit) Forecast, by Application 2020 & 2033
- Table 41: Rest of Europe Pyrogen Testing Industry Revenue (Million) Forecast, by Application 2020 & 2033
- Table 42: Rest of Europe Pyrogen Testing Industry Volume (K Unit) Forecast, by Application 2020 & 2033
- Table 43: Global Pyrogen Testing Industry Revenue Million Forecast, by Product 2020 & 2033
- Table 44: Global Pyrogen Testing Industry Volume K Unit Forecast, by Product 2020 & 2033
- Table 45: Global Pyrogen Testing Industry Revenue Million Forecast, by Test Type 2020 & 2033
- Table 46: Global Pyrogen Testing Industry Volume K Unit Forecast, by Test Type 2020 & 2033
- Table 47: Global Pyrogen Testing Industry Revenue Million Forecast, by End User 2020 & 2033
- Table 48: Global Pyrogen Testing Industry Volume K Unit Forecast, by End User 2020 & 2033
- Table 49: Global Pyrogen Testing Industry Revenue Million Forecast, by Country 2020 & 2033
- Table 50: Global Pyrogen Testing Industry Volume K Unit Forecast, by Country 2020 & 2033
- Table 51: China Pyrogen Testing Industry Revenue (Million) Forecast, by Application 2020 & 2033
- Table 52: China Pyrogen Testing Industry Volume (K Unit) Forecast, by Application 2020 & 2033
- Table 53: Japan Pyrogen Testing Industry Revenue (Million) Forecast, by Application 2020 & 2033
- Table 54: Japan Pyrogen Testing Industry Volume (K Unit) Forecast, by Application 2020 & 2033
- Table 55: India Pyrogen Testing Industry Revenue (Million) Forecast, by Application 2020 & 2033
- Table 56: India Pyrogen Testing Industry Volume (K Unit) Forecast, by Application 2020 & 2033
- Table 57: Australia Pyrogen Testing Industry Revenue (Million) Forecast, by Application 2020 & 2033
- Table 58: Australia Pyrogen Testing Industry Volume (K Unit) Forecast, by Application 2020 & 2033
- Table 59: South Korea Pyrogen Testing Industry Revenue (Million) Forecast, by Application 2020 & 2033
- Table 60: South Korea Pyrogen Testing Industry Volume (K Unit) Forecast, by Application 2020 & 2033
- Table 61: Rest of Asia Pacific Pyrogen Testing Industry Revenue (Million) Forecast, by Application 2020 & 2033
- Table 62: Rest of Asia Pacific Pyrogen Testing Industry Volume (K Unit) Forecast, by Application 2020 & 2033
- Table 63: Global Pyrogen Testing Industry Revenue Million Forecast, by Product 2020 & 2033
- Table 64: Global Pyrogen Testing Industry Volume K Unit Forecast, by Product 2020 & 2033
- Table 65: Global Pyrogen Testing Industry Revenue Million Forecast, by Test Type 2020 & 2033
- Table 66: Global Pyrogen Testing Industry Volume K Unit Forecast, by Test Type 2020 & 2033
- Table 67: Global Pyrogen Testing Industry Revenue Million Forecast, by End User 2020 & 2033
- Table 68: Global Pyrogen Testing Industry Volume K Unit Forecast, by End User 2020 & 2033
- Table 69: Global Pyrogen Testing Industry Revenue Million Forecast, by Country 2020 & 2033
- Table 70: Global Pyrogen Testing Industry Volume K Unit Forecast, by Country 2020 & 2033
- Table 71: GCC Pyrogen Testing Industry Revenue (Million) Forecast, by Application 2020 & 2033
- Table 72: GCC Pyrogen Testing Industry Volume (K Unit) Forecast, by Application 2020 & 2033
- Table 73: South Africa Pyrogen Testing Industry Revenue (Million) Forecast, by Application 2020 & 2033
- Table 74: South Africa Pyrogen Testing Industry Volume (K Unit) Forecast, by Application 2020 & 2033
- Table 75: Rest of Middle East and Africa Pyrogen Testing Industry Revenue (Million) Forecast, by Application 2020 & 2033
- Table 76: Rest of Middle East and Africa Pyrogen Testing Industry Volume (K Unit) Forecast, by Application 2020 & 2033
- Table 77: Global Pyrogen Testing Industry Revenue Million Forecast, by Product 2020 & 2033
- Table 78: Global Pyrogen Testing Industry Volume K Unit Forecast, by Product 2020 & 2033
- Table 79: Global Pyrogen Testing Industry Revenue Million Forecast, by Test Type 2020 & 2033
- Table 80: Global Pyrogen Testing Industry Volume K Unit Forecast, by Test Type 2020 & 2033
- Table 81: Global Pyrogen Testing Industry Revenue Million Forecast, by End User 2020 & 2033
- Table 82: Global Pyrogen Testing Industry Volume K Unit Forecast, by End User 2020 & 2033
- Table 83: Global Pyrogen Testing Industry Revenue Million Forecast, by Country 2020 & 2033
- Table 84: Global Pyrogen Testing Industry Volume K Unit Forecast, by Country 2020 & 2033
- Table 85: Brazil Pyrogen Testing Industry Revenue (Million) Forecast, by Application 2020 & 2033
- Table 86: Brazil Pyrogen Testing Industry Volume (K Unit) Forecast, by Application 2020 & 2033
- Table 87: Argentina Pyrogen Testing Industry Revenue (Million) Forecast, by Application 2020 & 2033
- Table 88: Argentina Pyrogen Testing Industry Volume (K Unit) Forecast, by Application 2020 & 2033
- Table 89: Rest of South America Pyrogen Testing Industry Revenue (Million) Forecast, by Application 2020 & 2033
- Table 90: Rest of South America Pyrogen Testing Industry Volume (K Unit) Forecast, by Application 2020 & 2033
Frequently Asked Questions
1. What is the projected Compound Annual Growth Rate (CAGR) of the Pyrogen Testing Industry?
The projected CAGR is approximately 7.13%.
2. Which companies are prominent players in the Pyrogen Testing Industry?
Key companies in the market include Microcoat Biotechnologie GmbH, BioMerieux SA, Merck Kgaa, Lonza Group, Sotera Health (Nelson Laboratories LLC), Fujifilm Holdings Corporation (FUJIFILM Wako Pure Chemical Corporation), Eurofins Scientific, Thermo Fisher Scientific Inc, WUXI Pharmatech (Cayman) Inc, Genscript, Associates of Cape Cod Inc (Seikagaku Biobusiness Corporation), Microcoat Biotechnologie GmbH, Charles River Laboratories Inc, Sanquin, Pyrostar, Ellab AS.
3. What are the main segments of the Pyrogen Testing Industry?
The market segments include Product, Test Type, End User.
4. Can you provide details about the market size?
The market size is estimated to be USD 1.48 Million as of 2022.
5. What are some drivers contributing to market growth?
Rapid Growth in Pharmaceutical and Biotechnology Industries; Rising R&D Expenditure in Life Science.
6. What are the notable trends driving market growth?
The Monocyte Activation Test Segment is Expected to Witness Good Growth Over the Forecast Period.
7. Are there any restraints impacting market growth?
Stringent Government Regulations.
8. Can you provide examples of recent developments in the market?
N/A
9. What pricing options are available for accessing the report?
Pricing options include single-user, multi-user, and enterprise licenses priced at USD 4750, USD 5250, and USD 8750 respectively.
10. Is the market size provided in terms of value or volume?
The market size is provided in terms of value, measured in Million and volume, measured in K Unit.
11. Are there any specific market keywords associated with the report?
Yes, the market keyword associated with the report is "Pyrogen Testing Industry," which aids in identifying and referencing the specific market segment covered.
12. How do I determine which pricing option suits my needs best?
The pricing options vary based on user requirements and access needs. Individual users may opt for single-user licenses, while businesses requiring broader access may choose multi-user or enterprise licenses for cost-effective access to the report.
13. Are there any additional resources or data provided in the Pyrogen Testing Industry report?
While the report offers comprehensive insights, it's advisable to review the specific contents or supplementary materials provided to ascertain if additional resources or data are available.
14. How can I stay updated on further developments or reports in the Pyrogen Testing Industry?
To stay informed about further developments, trends, and reports in the Pyrogen Testing Industry, consider subscribing to industry newsletters, following relevant companies and organizations, or regularly checking reputable industry news sources and publications.
Methodology
Step 1 - Identification of Relevant Samples Size from Population Database


Step 2 - Approaches for Defining Global Market Size (Value, Volume* & Price*)

Note*: In applicable scenarios
Step 3 - Data Sources
Primary Research
- Web Analytics
- Survey Reports
- Research Institute
- Latest Research Reports
- Opinion Leaders
Secondary Research
- Annual Reports
- White Paper
- Latest Press Release
- Industry Association
- Paid Database
- Investor Presentations

Step 4 - Data Triangulation
Involves using different sources of information in order to increase the validity of a study
These sources are likely to be stakeholders in a program - participants, other researchers, program staff, other community members, and so on.
Then we put all data in single framework & apply various statistical tools to find out the dynamic on the market.
During the analysis stage, feedback from the stakeholder groups would be compared to determine areas of agreement as well as areas of divergence