

Key Insights
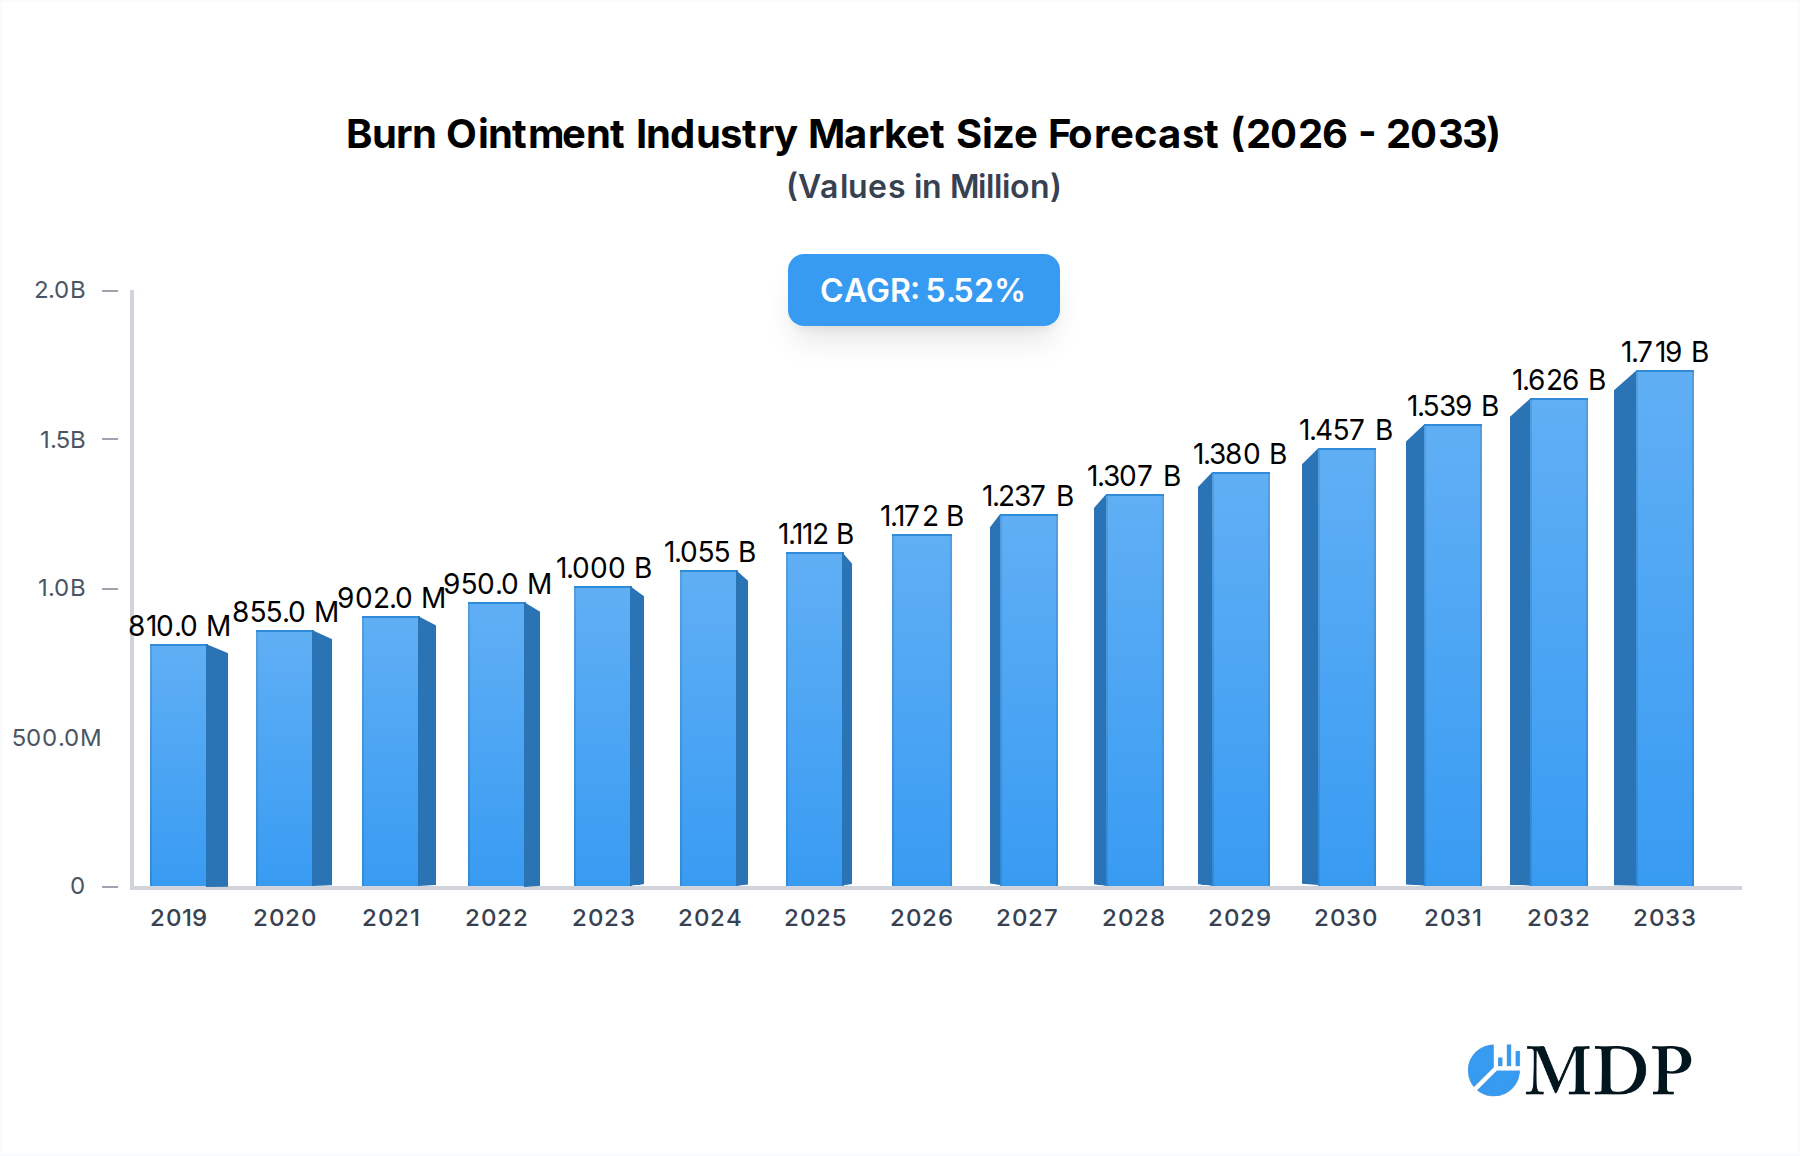
The global Burn Ointment Market is poised for significant expansion, projected to reach $1.1 Billion by 2025, with a robust Compound Annual Growth Rate (CAGR) of 5.95% through 2033. This growth is primarily fueled by an increasing incidence of burn injuries, driven by factors such as accidental fires in homes and industrial settings, as well as a rising awareness regarding advanced wound care solutions. The growing emphasis on faster healing, infection prevention, and scar reduction is propelling the demand for specialized burn ointments. Furthermore, advancements in pharmaceutical research and development, leading to the introduction of novel formulations with enhanced efficacy and reduced side effects, are contributing to market buoyancy. The rising healthcare expenditure globally, coupled with improved access to medical facilities, particularly in emerging economies, will further stimulate market growth.

Burn Ointment Industry Market Size (In Million)
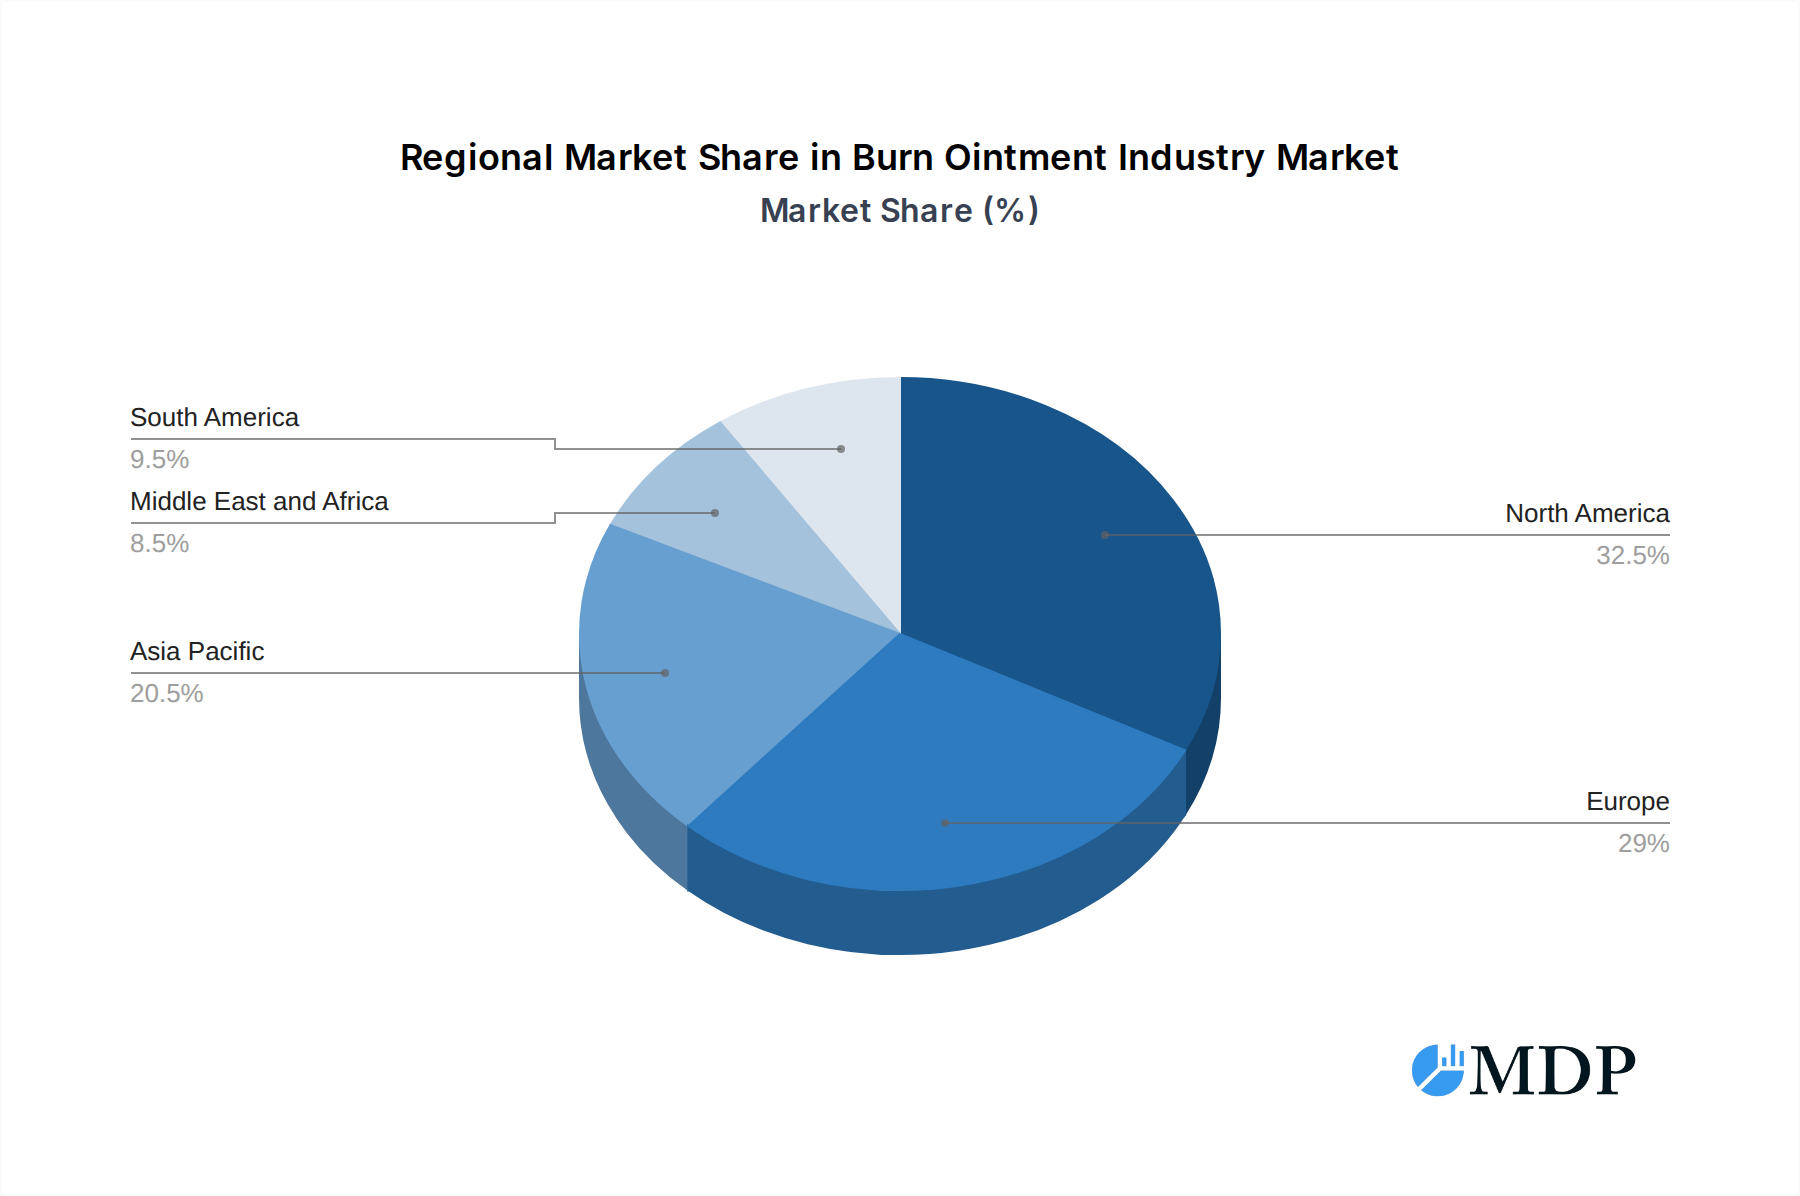
The market is segmented across various product types, including topical antibiotics, silver-based treatments, and iodine-based preparations, catering to diverse burn severity levels from minor to full-thickness burns. Hospitals and clinics represent a dominant end-user segment due to the high volume of burn patients treated in these facilities, while other end-users, including home healthcare providers and specialized wound care centers, are also exhibiting steady growth. Geographically, North America and Europe currently hold substantial market shares, driven by advanced healthcare infrastructure and high patient awareness. However, the Asia Pacific region is expected to witness the fastest growth, propelled by increasing industrialization, a growing population, and improving healthcare accessibility. Key market players are actively engaged in strategic collaborations, product innovations, and market expansions to capitalize on these burgeoning opportunities, although challenges such as the availability of generic alternatives and stringent regulatory approvals may moderate growth.
Burn Ointment Industry Company Market Share
Burn Ointment Market: Comprehensive Analysis & Future Outlook (2019-2033)
**Gain unparalleled insights into the global burn ointment market with this in-depth report. Spanning the historical period of 2019–2024, the base year of 2025, and a detailed forecast period of 2025–2033, this analysis provides a critical understanding of market dynamics, key players, emerging trends, and strategic opportunities. Essential for pharmaceutical companies, wound care specialists, investors, and regulatory bodies, this report offers actionable intelligence to navigate the evolving burn treatment landscape and capitalize on its significant growth potential. The global burn ointment market is projected to reach *Billion* by 2025, with a projected Compound Annual Growth Rate (CAGR) of xx% during the forecast period.**
Burn Ointment Industry Market Dynamics & Concentration
The global burn ointment market exhibits a moderate to high concentration, driven by established pharmaceutical giants and specialized wound care companies. Innovation remains a key driver, with continuous research and development focused on advanced wound healing technologies, antimicrobial efficacy, and patient comfort. Regulatory frameworks, particularly those governing drug approvals and clinical trials by bodies like the FDA and EMA, significantly influence market entry and product commercialization. Product substitutes, including advanced wound dressings, regenerative therapies, and skin grafting techniques, present a competitive challenge, necessitating continuous product differentiation and efficacy demonstration. End-user trends are shifting towards minimally invasive and pain-reducing treatments, fueling demand for advanced burn ointments. Mergers and acquisitions (M&A) activities are strategic tools for market consolidation and expansion, with an estimated Billion in M&A deal counts projected over the forecast period. Key market share players include Smith & Nephew PLC, Perrigo Company PLC, and Johnson & Johnson, collectively holding an estimated xx% of the market share.
Burn Ointment Industry Industry Trends & Analysis
The burn ointment industry is experiencing robust growth, fueled by a confluence of factors including an increasing incidence of burn injuries worldwide, a rising elderly population more susceptible to burns, and advancements in medical technology. The market penetration of advanced burn ointments is steadily increasing, driven by a growing awareness of their superior efficacy in promoting faster healing, reducing infection risk, and minimizing scarring. Technological disruptions, such as the development of bioengineered dressings and nano-based delivery systems for active ingredients, are revolutionizing burn management. Consumer preferences are leaning towards formulations that offer pain relief, ease of application, and reduced healing times. Competitive dynamics are intensifying, with companies actively investing in R&D to develop novel formulations and expand their product portfolios. The Compound Annual Growth Rate (CAGR) for the burn ointment market is estimated to be xx% during the forecast period, indicating a significant expansion trajectory.
Leading Markets & Segments in Burn Ointment Industry
The global burn ointment market is segmented across various product types, burn depths, and end-users, with North America currently dominating the market in terms of revenue.
- Dominant Region & Country: North America, particularly the United States, leads the market due to a high prevalence of burn injuries, advanced healthcare infrastructure, and significant R&D investments. Economic policies supporting healthcare access and technological adoption further bolster its position.
- Product Type Dominance:
- Topical Antibiotics: These remain a cornerstone of burn treatment, widely prescribed to prevent and manage bacterial infections, a critical concern in burn wound care.
- Silver-Based Ointments: Silver ions are highly effective antimicrobials, and silver-based formulations are increasingly favored for their broad-spectrum efficacy against antibiotic-resistant bacteria, especially in partial and full-thickness burns.
- Iodine-Based Ointments: While historically significant, iodine-based ointments are seeing a more niche application, often used for their antiseptic properties in specific burn management protocols.
- Depth of Burn:
- Partial Thickness Burns: This segment holds a substantial market share due to its high incidence and the need for specialized wound management to prevent infection and promote optimal healing.
- Minor Burns: While less severe, the sheer volume of minor burn incidents contributes significantly to the market, with a demand for readily available and effective over-the-counter (OTC) burn ointments.
- Full Thickness Burns: These severe burns require intensive medical intervention, driving the demand for advanced and specialized burn ointments in hospital settings.
- End User Dominance:
- Hospitals and Clinics: This segment is the largest consumer of burn ointments, utilizing them in emergency rooms, burn centers, and surgical units for acute and chronic burn management.
- Other End Users: This includes home healthcare settings and retail pharmacies, where OTC burn ointments cater to self-treatment of minor burns.
Burn Ointment Industry Product Developments
Product development in the burn ointment industry is focused on enhancing antimicrobial efficacy, promoting faster wound healing, and improving patient experience. Innovations include the integration of advanced antimicrobial agents, such as silver nanoparticles and novel antibiotics, to combat resistant strains. Formulations are also evolving to include ingredients that reduce pain and inflammation, minimize scarring, and facilitate moist wound healing. The incorporation of bio-active compounds and growth factors is a key technological trend aimed at accelerating tissue regeneration. These developments aim to offer competitive advantages by providing more effective, safer, and user-friendly burn treatment solutions that align with market demand for improved patient outcomes.
Key Drivers of Burn Ointment Industry Growth
Several factors are propelling the growth of the burn ointment industry. Technologically, advancements in nanotechnology for drug delivery and the development of novel antimicrobial compounds are expanding treatment possibilities. Economically, increasing healthcare expenditure globally and a growing number of burn treatment facilities are creating a larger market. Regulatory bodies are also facilitating the approval of new and improved burn care products, provided they demonstrate clear clinical benefits. Furthermore, the rising incidence of accidents and intentional burn injuries contributes to sustained demand for effective burn ointments.
Challenges in the Burn Ointment Industry Market
The burn ointment industry faces several challenges. Stringent regulatory hurdles for new drug approvals can be time-consuming and costly, impacting time-to-market for innovative products. Supply chain disruptions, particularly for specialized raw materials, can affect production and availability. Intense competition from both established players and emerging companies, as well as the availability of alternative wound care modalities, exerts significant pricing pressure. The high cost of some advanced burn ointments can also limit accessibility in certain healthcare systems, impacting market penetration.
Emerging Opportunities in Burn Ointment Industry
Emerging opportunities in the burn ointment industry lie in the development of advanced wound healing technologies, such as bio-engineered skin substitutes and regenerative medicine-based treatments. Strategic partnerships between pharmaceutical companies and research institutions can accelerate innovation and clinical validation. Market expansion into developing economies with a growing burden of burn injuries and improving healthcare infrastructure presents significant untapped potential. The increasing demand for personalized medicine and targeted therapies for specific burn types and patient profiles also offers a promising avenue for future growth.
Leading Players in the Burn Ointment Industry Sector
- Smith & Nephew PLC
- Perrigo Company PLC
- DeRoyal Industries Inc
- Integra LifeSciences
- 3M
- ConvaTec Group PLC
- Dr Morepen
- Mankind Pharma
- Cardinal Health
- Cipla Limited
- Trio Lifescience Pvt Ltd
- Johnson & Johnson
- Sun Pharmaceutical Industries Ltd (Ranbaxy Laboratories Limited)
- GlaxoSmithKline PLC
- Pfizer Inc
Key Milestones in Burn Ointment Industry Industry
- May 2022: Molncyke Healthcare submitted clinical evidence in Wound International 2022 on the use of Mediplex Ag for the management of partial thickness burns. The soft silicone wound contact layer in Mediplex, designed to minimize wound and peri-wound trauma and associated pain, aided in burn healing.
- April 2022: The Hospices Civils de Lyon sponsored a clinical trial examining the use of silver sulphadiazine as an ointment for treating second-degree fibrinous burns. The study was estimated to start by September 2022.
Strategic Outlook for Burn Ointment Industry Market
The strategic outlook for the burn ointment market is highly positive, driven by ongoing innovation and unmet clinical needs. Future growth accelerators include the increasing adoption of advanced wound care technologies, such as smart dressings and biologics, that promote faster and more effective healing. Companies are expected to focus on developing patient-centric formulations that offer pain relief and reduce scarring. Strategic collaborations and potential acquisitions will continue to shape the competitive landscape, enabling market players to expand their product portfolios and geographic reach. Addressing the growing burden of antibiotic resistance will also be a key focus, driving the development of novel antimicrobial burn ointments.
Burn Ointment Industry Segmentation
-
1. Product Type
- 1.1. Topical Antibiotics
- 1.2. Silver
- 1.3. Iodine
-
2. Depth of Burn
- 2.1. Minor Burns
- 2.2. Partial Thickness Burns
- 2.3. Full Thickness Burns
-
3. End User
- 3.1. Hospitals and Clinics
- 3.2. Other End Users
Burn Ointment Industry Segmentation By Geography
-
1. North America
- 1.1. United States
- 1.2. Canada
- 1.3. Mexico
-
2. Europe
- 2.1. Germany
- 2.2. United Kingdom
- 2.3. France
- 2.4. Italy
- 2.5. Spain
- 2.6. Rest of Europe
-
3. Asia Pacific
- 3.1. China
- 3.2. Japan
- 3.3. India
- 3.4. Australia
- 3.5. South Korea
- 3.6. Rest of Asia Pacific
-
4. Middle East and Africa
- 4.1. GCC
- 4.2. South Africa
- 4.3. Rest of Middle East and Africa
-
5. South America
- 5.1. Brazil
- 5.2. Argentina
- 5.3. Rest of South America
Burn Ointment Industry Regional Market Share
Geographic Coverage of Burn Ointment Industry
Burn Ointment Industry REPORT HIGHLIGHTS
| Aspects | Details |
|---|---|
| Study Period | 2020-2034 |
| Base Year | 2025 |
| Estimated Year | 2026 |
| Forecast Period | 2026-2034 |
| Historical Period | 2020-2025 |
| Growth Rate | CAGR of 5.95% from 2020-2034 |
| Segmentation |
|
Table of Contents
- 1. Introduction
- 1.1. Research Scope
- 1.2. Market Segmentation
- 1.3. Research Objective
- 1.4. Definitions and Assumptions
- 2. Executive Summary
- 2.1. Market Snapshot
- 3. Market Dynamics
- 3.1. Market Drivers
- 3.2. Market Restrains
- 3.3. Market Trends
- 3.4. Market Opportunities
- 4. Market Factor Analysis
- 4.1. Porters Five Forces
- 4.1.1. Bargaining Power of Suppliers
- 4.1.2. Bargaining Power of Buyers
- 4.1.3. Threat of New Entrants
- 4.1.4. Threat of Substitutes
- 4.1.5. Competitive Rivalry
- 4.2. PESTEL analysis
- 4.3. BCG Analysis
- 4.3.1. Stars (High Growth, High Market Share)
- 4.3.2. Cash Cows (Low Growth, High Market Share)
- 4.3.3. Question Mark (High Growth, Low Market Share)
- 4.3.4. Dogs (Low Growth, Low Market Share)
- 4.4. Ansoff Matrix Analysis
- 4.5. Supply Chain Analysis
- 4.6. Regulatory Landscape
- 4.7. Current Market Potential and Opportunity Assessment (TAM–SAM–SOM Framework)
- 4.8. MDP Analyst Note
- 4.1. Porters Five Forces
- 5. Market Analysis, Insights and Forecast 2021-2033
- 5.1. Market Analysis, Insights and Forecast - by Product Type
- 5.1.1. Topical Antibiotics
- 5.1.2. Silver
- 5.1.3. Iodine
- 5.2. Market Analysis, Insights and Forecast - by Depth of Burn
- 5.2.1. Minor Burns
- 5.2.2. Partial Thickness Burns
- 5.2.3. Full Thickness Burns
- 5.3. Market Analysis, Insights and Forecast - by End User
- 5.3.1. Hospitals and Clinics
- 5.3.2. Other End Users
- 5.4. Market Analysis, Insights and Forecast - by Region
- 5.4.1. North America
- 5.4.2. Europe
- 5.4.3. Asia Pacific
- 5.4.4. Middle East and Africa
- 5.4.5. South America
- 5.1. Market Analysis, Insights and Forecast - by Product Type
- 6. Global Burn Ointment Industry Analysis, Insights and Forecast, 2021-2033
- 6.1. Market Analysis, Insights and Forecast - by Product Type
- 6.1.1. Topical Antibiotics
- 6.1.2. Silver
- 6.1.3. Iodine
- 6.2. Market Analysis, Insights and Forecast - by Depth of Burn
- 6.2.1. Minor Burns
- 6.2.2. Partial Thickness Burns
- 6.2.3. Full Thickness Burns
- 6.3. Market Analysis, Insights and Forecast - by End User
- 6.3.1. Hospitals and Clinics
- 6.3.2. Other End Users
- 6.1. Market Analysis, Insights and Forecast - by Product Type
- 7. North America Burn Ointment Industry Analysis, Insights and Forecast, 2020-2032
- 7.1. Market Analysis, Insights and Forecast - by Product Type
- 7.1.1. Topical Antibiotics
- 7.1.2. Silver
- 7.1.3. Iodine
- 7.2. Market Analysis, Insights and Forecast - by Depth of Burn
- 7.2.1. Minor Burns
- 7.2.2. Partial Thickness Burns
- 7.2.3. Full Thickness Burns
- 7.3. Market Analysis, Insights and Forecast - by End User
- 7.3.1. Hospitals and Clinics
- 7.3.2. Other End Users
- 7.1. Market Analysis, Insights and Forecast - by Product Type
- 8. Europe Burn Ointment Industry Analysis, Insights and Forecast, 2020-2032
- 8.1. Market Analysis, Insights and Forecast - by Product Type
- 8.1.1. Topical Antibiotics
- 8.1.2. Silver
- 8.1.3. Iodine
- 8.2. Market Analysis, Insights and Forecast - by Depth of Burn
- 8.2.1. Minor Burns
- 8.2.2. Partial Thickness Burns
- 8.2.3. Full Thickness Burns
- 8.3. Market Analysis, Insights and Forecast - by End User
- 8.3.1. Hospitals and Clinics
- 8.3.2. Other End Users
- 8.1. Market Analysis, Insights and Forecast - by Product Type
- 9. Asia Pacific Burn Ointment Industry Analysis, Insights and Forecast, 2020-2032
- 9.1. Market Analysis, Insights and Forecast - by Product Type
- 9.1.1. Topical Antibiotics
- 9.1.2. Silver
- 9.1.3. Iodine
- 9.2. Market Analysis, Insights and Forecast - by Depth of Burn
- 9.2.1. Minor Burns
- 9.2.2. Partial Thickness Burns
- 9.2.3. Full Thickness Burns
- 9.3. Market Analysis, Insights and Forecast - by End User
- 9.3.1. Hospitals and Clinics
- 9.3.2. Other End Users
- 9.1. Market Analysis, Insights and Forecast - by Product Type
- 10. Middle East and Africa Burn Ointment Industry Analysis, Insights and Forecast, 2020-2032
- 10.1. Market Analysis, Insights and Forecast - by Product Type
- 10.1.1. Topical Antibiotics
- 10.1.2. Silver
- 10.1.3. Iodine
- 10.2. Market Analysis, Insights and Forecast - by Depth of Burn
- 10.2.1. Minor Burns
- 10.2.2. Partial Thickness Burns
- 10.2.3. Full Thickness Burns
- 10.3. Market Analysis, Insights and Forecast - by End User
- 10.3.1. Hospitals and Clinics
- 10.3.2. Other End Users
- 10.1. Market Analysis, Insights and Forecast - by Product Type
- 11. South America Burn Ointment Industry Analysis, Insights and Forecast, 2020-2032
- 11.1. Market Analysis, Insights and Forecast - by Product Type
- 11.1.1. Topical Antibiotics
- 11.1.2. Silver
- 11.1.3. Iodine
- 11.2. Market Analysis, Insights and Forecast - by Depth of Burn
- 11.2.1. Minor Burns
- 11.2.2. Partial Thickness Burns
- 11.2.3. Full Thickness Burns
- 11.3. Market Analysis, Insights and Forecast - by End User
- 11.3.1. Hospitals and Clinics
- 11.3.2. Other End Users
- 11.1. Market Analysis, Insights and Forecast - by Product Type
- 12. Competitive Analysis
- 12.1. Company Profiles
- 12.1.1 Smith & Nephew PLC
- 12.1.1.1. Company Overview
- 12.1.1.2. Products
- 12.1.1.3. Company Financials
- 12.1.1.4. SWOT Analysis
- 12.1.2 Perrigo Company PLC
- 12.1.2.1. Company Overview
- 12.1.2.2. Products
- 12.1.2.3. Company Financials
- 12.1.2.4. SWOT Analysis
- 12.1.3 DeRoyal Industries Inc
- 12.1.3.1. Company Overview
- 12.1.3.2. Products
- 12.1.3.3. Company Financials
- 12.1.3.4. SWOT Analysis
- 12.1.4 Intergra LifeSciences
- 12.1.4.1. Company Overview
- 12.1.4.2. Products
- 12.1.4.3. Company Financials
- 12.1.4.4. SWOT Analysis
- 12.1.5 3M
- 12.1.5.1. Company Overview
- 12.1.5.2. Products
- 12.1.5.3. Company Financials
- 12.1.5.4. SWOT Analysis
- 12.1.6 ConvaTec Group PLC
- 12.1.6.1. Company Overview
- 12.1.6.2. Products
- 12.1.6.3. Company Financials
- 12.1.6.4. SWOT Analysis
- 12.1.7 Dr Morepen
- 12.1.7.1. Company Overview
- 12.1.7.2. Products
- 12.1.7.3. Company Financials
- 12.1.7.4. SWOT Analysis
- 12.1.8 Mankind Pharma
- 12.1.8.1. Company Overview
- 12.1.8.2. Products
- 12.1.8.3. Company Financials
- 12.1.8.4. SWOT Analysis
- 12.1.9 Cardinal Health
- 12.1.9.1. Company Overview
- 12.1.9.2. Products
- 12.1.9.3. Company Financials
- 12.1.9.4. SWOT Analysis
- 12.1.10 Cipla Limited
- 12.1.10.1. Company Overview
- 12.1.10.2. Products
- 12.1.10.3. Company Financials
- 12.1.10.4. SWOT Analysis
- 12.1.11 Trio Lifescience Pvt Ltd
- 12.1.11.1. Company Overview
- 12.1.11.2. Products
- 12.1.11.3. Company Financials
- 12.1.11.4. SWOT Analysis
- 12.1.12 Johnson & Johnson
- 12.1.12.1. Company Overview
- 12.1.12.2. Products
- 12.1.12.3. Company Financials
- 12.1.12.4. SWOT Analysis
- 12.1.13 Sun Pharmaceutical Industries Ltd (Ranbaxy Laboratories Limited)
- 12.1.13.1. Company Overview
- 12.1.13.2. Products
- 12.1.13.3. Company Financials
- 12.1.13.4. SWOT Analysis
- 12.1.14 GlaxoSmithKline PLC
- 12.1.14.1. Company Overview
- 12.1.14.2. Products
- 12.1.14.3. Company Financials
- 12.1.14.4. SWOT Analysis
- 12.1.15 Pfizer Inc
- 12.1.15.1. Company Overview
- 12.1.15.2. Products
- 12.1.15.3. Company Financials
- 12.1.15.4. SWOT Analysis
- 12.1.1 Smith & Nephew PLC
- 12.2. Market Entropy
- 12.2.1 Company's Key Areas Served
- 12.2.2 Recent Developments
- 12.3. Company Market Share Analysis 2025
- 12.3.1 Top 5 Companies Market Share Analysis
- 12.3.2 Top 3 Companies Market Share Analysis
- 12.4. List of Potential Customers
- 13. Research Methodology
List of Figures
- Figure 1: Global Burn Ointment Industry Revenue Breakdown (Billion, %) by Region 2025 & 2033
- Figure 2: Global Burn Ointment Industry Volume Breakdown (K Tons, %) by Region 2025 & 2033
- Figure 3: North America Burn Ointment Industry Revenue (Billion), by Product Type 2025 & 2033
- Figure 4: North America Burn Ointment Industry Volume (K Tons), by Product Type 2025 & 2033
- Figure 5: North America Burn Ointment Industry Revenue Share (%), by Product Type 2025 & 2033
- Figure 6: North America Burn Ointment Industry Volume Share (%), by Product Type 2025 & 2033
- Figure 7: North America Burn Ointment Industry Revenue (Billion), by Depth of Burn 2025 & 2033
- Figure 8: North America Burn Ointment Industry Volume (K Tons), by Depth of Burn 2025 & 2033
- Figure 9: North America Burn Ointment Industry Revenue Share (%), by Depth of Burn 2025 & 2033
- Figure 10: North America Burn Ointment Industry Volume Share (%), by Depth of Burn 2025 & 2033
- Figure 11: North America Burn Ointment Industry Revenue (Billion), by End User 2025 & 2033
- Figure 12: North America Burn Ointment Industry Volume (K Tons), by End User 2025 & 2033
- Figure 13: North America Burn Ointment Industry Revenue Share (%), by End User 2025 & 2033
- Figure 14: North America Burn Ointment Industry Volume Share (%), by End User 2025 & 2033
- Figure 15: North America Burn Ointment Industry Revenue (Billion), by Country 2025 & 2033
- Figure 16: North America Burn Ointment Industry Volume (K Tons), by Country 2025 & 2033
- Figure 17: North America Burn Ointment Industry Revenue Share (%), by Country 2025 & 2033
- Figure 18: North America Burn Ointment Industry Volume Share (%), by Country 2025 & 2033
- Figure 19: Europe Burn Ointment Industry Revenue (Billion), by Product Type 2025 & 2033
- Figure 20: Europe Burn Ointment Industry Volume (K Tons), by Product Type 2025 & 2033
- Figure 21: Europe Burn Ointment Industry Revenue Share (%), by Product Type 2025 & 2033
- Figure 22: Europe Burn Ointment Industry Volume Share (%), by Product Type 2025 & 2033
- Figure 23: Europe Burn Ointment Industry Revenue (Billion), by Depth of Burn 2025 & 2033
- Figure 24: Europe Burn Ointment Industry Volume (K Tons), by Depth of Burn 2025 & 2033
- Figure 25: Europe Burn Ointment Industry Revenue Share (%), by Depth of Burn 2025 & 2033
- Figure 26: Europe Burn Ointment Industry Volume Share (%), by Depth of Burn 2025 & 2033
- Figure 27: Europe Burn Ointment Industry Revenue (Billion), by End User 2025 & 2033
- Figure 28: Europe Burn Ointment Industry Volume (K Tons), by End User 2025 & 2033
- Figure 29: Europe Burn Ointment Industry Revenue Share (%), by End User 2025 & 2033
- Figure 30: Europe Burn Ointment Industry Volume Share (%), by End User 2025 & 2033
- Figure 31: Europe Burn Ointment Industry Revenue (Billion), by Country 2025 & 2033
- Figure 32: Europe Burn Ointment Industry Volume (K Tons), by Country 2025 & 2033
- Figure 33: Europe Burn Ointment Industry Revenue Share (%), by Country 2025 & 2033
- Figure 34: Europe Burn Ointment Industry Volume Share (%), by Country 2025 & 2033
- Figure 35: Asia Pacific Burn Ointment Industry Revenue (Billion), by Product Type 2025 & 2033
- Figure 36: Asia Pacific Burn Ointment Industry Volume (K Tons), by Product Type 2025 & 2033
- Figure 37: Asia Pacific Burn Ointment Industry Revenue Share (%), by Product Type 2025 & 2033
- Figure 38: Asia Pacific Burn Ointment Industry Volume Share (%), by Product Type 2025 & 2033
- Figure 39: Asia Pacific Burn Ointment Industry Revenue (Billion), by Depth of Burn 2025 & 2033
- Figure 40: Asia Pacific Burn Ointment Industry Volume (K Tons), by Depth of Burn 2025 & 2033
- Figure 41: Asia Pacific Burn Ointment Industry Revenue Share (%), by Depth of Burn 2025 & 2033
- Figure 42: Asia Pacific Burn Ointment Industry Volume Share (%), by Depth of Burn 2025 & 2033
- Figure 43: Asia Pacific Burn Ointment Industry Revenue (Billion), by End User 2025 & 2033
- Figure 44: Asia Pacific Burn Ointment Industry Volume (K Tons), by End User 2025 & 2033
- Figure 45: Asia Pacific Burn Ointment Industry Revenue Share (%), by End User 2025 & 2033
- Figure 46: Asia Pacific Burn Ointment Industry Volume Share (%), by End User 2025 & 2033
- Figure 47: Asia Pacific Burn Ointment Industry Revenue (Billion), by Country 2025 & 2033
- Figure 48: Asia Pacific Burn Ointment Industry Volume (K Tons), by Country 2025 & 2033
- Figure 49: Asia Pacific Burn Ointment Industry Revenue Share (%), by Country 2025 & 2033
- Figure 50: Asia Pacific Burn Ointment Industry Volume Share (%), by Country 2025 & 2033
- Figure 51: Middle East and Africa Burn Ointment Industry Revenue (Billion), by Product Type 2025 & 2033
- Figure 52: Middle East and Africa Burn Ointment Industry Volume (K Tons), by Product Type 2025 & 2033
- Figure 53: Middle East and Africa Burn Ointment Industry Revenue Share (%), by Product Type 2025 & 2033
- Figure 54: Middle East and Africa Burn Ointment Industry Volume Share (%), by Product Type 2025 & 2033
- Figure 55: Middle East and Africa Burn Ointment Industry Revenue (Billion), by Depth of Burn 2025 & 2033
- Figure 56: Middle East and Africa Burn Ointment Industry Volume (K Tons), by Depth of Burn 2025 & 2033
- Figure 57: Middle East and Africa Burn Ointment Industry Revenue Share (%), by Depth of Burn 2025 & 2033
- Figure 58: Middle East and Africa Burn Ointment Industry Volume Share (%), by Depth of Burn 2025 & 2033
- Figure 59: Middle East and Africa Burn Ointment Industry Revenue (Billion), by End User 2025 & 2033
- Figure 60: Middle East and Africa Burn Ointment Industry Volume (K Tons), by End User 2025 & 2033
- Figure 61: Middle East and Africa Burn Ointment Industry Revenue Share (%), by End User 2025 & 2033
- Figure 62: Middle East and Africa Burn Ointment Industry Volume Share (%), by End User 2025 & 2033
- Figure 63: Middle East and Africa Burn Ointment Industry Revenue (Billion), by Country 2025 & 2033
- Figure 64: Middle East and Africa Burn Ointment Industry Volume (K Tons), by Country 2025 & 2033
- Figure 65: Middle East and Africa Burn Ointment Industry Revenue Share (%), by Country 2025 & 2033
- Figure 66: Middle East and Africa Burn Ointment Industry Volume Share (%), by Country 2025 & 2033
- Figure 67: South America Burn Ointment Industry Revenue (Billion), by Product Type 2025 & 2033
- Figure 68: South America Burn Ointment Industry Volume (K Tons), by Product Type 2025 & 2033
- Figure 69: South America Burn Ointment Industry Revenue Share (%), by Product Type 2025 & 2033
- Figure 70: South America Burn Ointment Industry Volume Share (%), by Product Type 2025 & 2033
- Figure 71: South America Burn Ointment Industry Revenue (Billion), by Depth of Burn 2025 & 2033
- Figure 72: South America Burn Ointment Industry Volume (K Tons), by Depth of Burn 2025 & 2033
- Figure 73: South America Burn Ointment Industry Revenue Share (%), by Depth of Burn 2025 & 2033
- Figure 74: South America Burn Ointment Industry Volume Share (%), by Depth of Burn 2025 & 2033
- Figure 75: South America Burn Ointment Industry Revenue (Billion), by End User 2025 & 2033
- Figure 76: South America Burn Ointment Industry Volume (K Tons), by End User 2025 & 2033
- Figure 77: South America Burn Ointment Industry Revenue Share (%), by End User 2025 & 2033
- Figure 78: South America Burn Ointment Industry Volume Share (%), by End User 2025 & 2033
- Figure 79: South America Burn Ointment Industry Revenue (Billion), by Country 2025 & 2033
- Figure 80: South America Burn Ointment Industry Volume (K Tons), by Country 2025 & 2033
- Figure 81: South America Burn Ointment Industry Revenue Share (%), by Country 2025 & 2033
- Figure 82: South America Burn Ointment Industry Volume Share (%), by Country 2025 & 2033
List of Tables
- Table 1: Global Burn Ointment Industry Revenue Billion Forecast, by Product Type 2020 & 2033
- Table 2: Global Burn Ointment Industry Volume K Tons Forecast, by Product Type 2020 & 2033
- Table 3: Global Burn Ointment Industry Revenue Billion Forecast, by Depth of Burn 2020 & 2033
- Table 4: Global Burn Ointment Industry Volume K Tons Forecast, by Depth of Burn 2020 & 2033
- Table 5: Global Burn Ointment Industry Revenue Billion Forecast, by End User 2020 & 2033
- Table 6: Global Burn Ointment Industry Volume K Tons Forecast, by End User 2020 & 2033
- Table 7: Global Burn Ointment Industry Revenue Billion Forecast, by Region 2020 & 2033
- Table 8: Global Burn Ointment Industry Volume K Tons Forecast, by Region 2020 & 2033
- Table 9: Global Burn Ointment Industry Revenue Billion Forecast, by Product Type 2020 & 2033
- Table 10: Global Burn Ointment Industry Volume K Tons Forecast, by Product Type 2020 & 2033
- Table 11: Global Burn Ointment Industry Revenue Billion Forecast, by Depth of Burn 2020 & 2033
- Table 12: Global Burn Ointment Industry Volume K Tons Forecast, by Depth of Burn 2020 & 2033
- Table 13: Global Burn Ointment Industry Revenue Billion Forecast, by End User 2020 & 2033
- Table 14: Global Burn Ointment Industry Volume K Tons Forecast, by End User 2020 & 2033
- Table 15: Global Burn Ointment Industry Revenue Billion Forecast, by Country 2020 & 2033
- Table 16: Global Burn Ointment Industry Volume K Tons Forecast, by Country 2020 & 2033
- Table 17: United States Burn Ointment Industry Revenue (Billion) Forecast, by Application 2020 & 2033
- Table 18: United States Burn Ointment Industry Volume (K Tons) Forecast, by Application 2020 & 2033
- Table 19: Canada Burn Ointment Industry Revenue (Billion) Forecast, by Application 2020 & 2033
- Table 20: Canada Burn Ointment Industry Volume (K Tons) Forecast, by Application 2020 & 2033
- Table 21: Mexico Burn Ointment Industry Revenue (Billion) Forecast, by Application 2020 & 2033
- Table 22: Mexico Burn Ointment Industry Volume (K Tons) Forecast, by Application 2020 & 2033
- Table 23: Global Burn Ointment Industry Revenue Billion Forecast, by Product Type 2020 & 2033
- Table 24: Global Burn Ointment Industry Volume K Tons Forecast, by Product Type 2020 & 2033
- Table 25: Global Burn Ointment Industry Revenue Billion Forecast, by Depth of Burn 2020 & 2033
- Table 26: Global Burn Ointment Industry Volume K Tons Forecast, by Depth of Burn 2020 & 2033
- Table 27: Global Burn Ointment Industry Revenue Billion Forecast, by End User 2020 & 2033
- Table 28: Global Burn Ointment Industry Volume K Tons Forecast, by End User 2020 & 2033
- Table 29: Global Burn Ointment Industry Revenue Billion Forecast, by Country 2020 & 2033
- Table 30: Global Burn Ointment Industry Volume K Tons Forecast, by Country 2020 & 2033
- Table 31: Germany Burn Ointment Industry Revenue (Billion) Forecast, by Application 2020 & 2033
- Table 32: Germany Burn Ointment Industry Volume (K Tons) Forecast, by Application 2020 & 2033
- Table 33: United Kingdom Burn Ointment Industry Revenue (Billion) Forecast, by Application 2020 & 2033
- Table 34: United Kingdom Burn Ointment Industry Volume (K Tons) Forecast, by Application 2020 & 2033
- Table 35: France Burn Ointment Industry Revenue (Billion) Forecast, by Application 2020 & 2033
- Table 36: France Burn Ointment Industry Volume (K Tons) Forecast, by Application 2020 & 2033
- Table 37: Italy Burn Ointment Industry Revenue (Billion) Forecast, by Application 2020 & 2033
- Table 38: Italy Burn Ointment Industry Volume (K Tons) Forecast, by Application 2020 & 2033
- Table 39: Spain Burn Ointment Industry Revenue (Billion) Forecast, by Application 2020 & 2033
- Table 40: Spain Burn Ointment Industry Volume (K Tons) Forecast, by Application 2020 & 2033
- Table 41: Rest of Europe Burn Ointment Industry Revenue (Billion) Forecast, by Application 2020 & 2033
- Table 42: Rest of Europe Burn Ointment Industry Volume (K Tons) Forecast, by Application 2020 & 2033
- Table 43: Global Burn Ointment Industry Revenue Billion Forecast, by Product Type 2020 & 2033
- Table 44: Global Burn Ointment Industry Volume K Tons Forecast, by Product Type 2020 & 2033
- Table 45: Global Burn Ointment Industry Revenue Billion Forecast, by Depth of Burn 2020 & 2033
- Table 46: Global Burn Ointment Industry Volume K Tons Forecast, by Depth of Burn 2020 & 2033
- Table 47: Global Burn Ointment Industry Revenue Billion Forecast, by End User 2020 & 2033
- Table 48: Global Burn Ointment Industry Volume K Tons Forecast, by End User 2020 & 2033
- Table 49: Global Burn Ointment Industry Revenue Billion Forecast, by Country 2020 & 2033
- Table 50: Global Burn Ointment Industry Volume K Tons Forecast, by Country 2020 & 2033
- Table 51: China Burn Ointment Industry Revenue (Billion) Forecast, by Application 2020 & 2033
- Table 52: China Burn Ointment Industry Volume (K Tons) Forecast, by Application 2020 & 2033
- Table 53: Japan Burn Ointment Industry Revenue (Billion) Forecast, by Application 2020 & 2033
- Table 54: Japan Burn Ointment Industry Volume (K Tons) Forecast, by Application 2020 & 2033
- Table 55: India Burn Ointment Industry Revenue (Billion) Forecast, by Application 2020 & 2033
- Table 56: India Burn Ointment Industry Volume (K Tons) Forecast, by Application 2020 & 2033
- Table 57: Australia Burn Ointment Industry Revenue (Billion) Forecast, by Application 2020 & 2033
- Table 58: Australia Burn Ointment Industry Volume (K Tons) Forecast, by Application 2020 & 2033
- Table 59: South Korea Burn Ointment Industry Revenue (Billion) Forecast, by Application 2020 & 2033
- Table 60: South Korea Burn Ointment Industry Volume (K Tons) Forecast, by Application 2020 & 2033
- Table 61: Rest of Asia Pacific Burn Ointment Industry Revenue (Billion) Forecast, by Application 2020 & 2033
- Table 62: Rest of Asia Pacific Burn Ointment Industry Volume (K Tons) Forecast, by Application 2020 & 2033
- Table 63: Global Burn Ointment Industry Revenue Billion Forecast, by Product Type 2020 & 2033
- Table 64: Global Burn Ointment Industry Volume K Tons Forecast, by Product Type 2020 & 2033
- Table 65: Global Burn Ointment Industry Revenue Billion Forecast, by Depth of Burn 2020 & 2033
- Table 66: Global Burn Ointment Industry Volume K Tons Forecast, by Depth of Burn 2020 & 2033
- Table 67: Global Burn Ointment Industry Revenue Billion Forecast, by End User 2020 & 2033
- Table 68: Global Burn Ointment Industry Volume K Tons Forecast, by End User 2020 & 2033
- Table 69: Global Burn Ointment Industry Revenue Billion Forecast, by Country 2020 & 2033
- Table 70: Global Burn Ointment Industry Volume K Tons Forecast, by Country 2020 & 2033
- Table 71: GCC Burn Ointment Industry Revenue (Billion) Forecast, by Application 2020 & 2033
- Table 72: GCC Burn Ointment Industry Volume (K Tons) Forecast, by Application 2020 & 2033
- Table 73: South Africa Burn Ointment Industry Revenue (Billion) Forecast, by Application 2020 & 2033
- Table 74: South Africa Burn Ointment Industry Volume (K Tons) Forecast, by Application 2020 & 2033
- Table 75: Rest of Middle East and Africa Burn Ointment Industry Revenue (Billion) Forecast, by Application 2020 & 2033
- Table 76: Rest of Middle East and Africa Burn Ointment Industry Volume (K Tons) Forecast, by Application 2020 & 2033
- Table 77: Global Burn Ointment Industry Revenue Billion Forecast, by Product Type 2020 & 2033
- Table 78: Global Burn Ointment Industry Volume K Tons Forecast, by Product Type 2020 & 2033
- Table 79: Global Burn Ointment Industry Revenue Billion Forecast, by Depth of Burn 2020 & 2033
- Table 80: Global Burn Ointment Industry Volume K Tons Forecast, by Depth of Burn 2020 & 2033
- Table 81: Global Burn Ointment Industry Revenue Billion Forecast, by End User 2020 & 2033
- Table 82: Global Burn Ointment Industry Volume K Tons Forecast, by End User 2020 & 2033
- Table 83: Global Burn Ointment Industry Revenue Billion Forecast, by Country 2020 & 2033
- Table 84: Global Burn Ointment Industry Volume K Tons Forecast, by Country 2020 & 2033
- Table 85: Brazil Burn Ointment Industry Revenue (Billion) Forecast, by Application 2020 & 2033
- Table 86: Brazil Burn Ointment Industry Volume (K Tons) Forecast, by Application 2020 & 2033
- Table 87: Argentina Burn Ointment Industry Revenue (Billion) Forecast, by Application 2020 & 2033
- Table 88: Argentina Burn Ointment Industry Volume (K Tons) Forecast, by Application 2020 & 2033
- Table 89: Rest of South America Burn Ointment Industry Revenue (Billion) Forecast, by Application 2020 & 2033
- Table 90: Rest of South America Burn Ointment Industry Volume (K Tons) Forecast, by Application 2020 & 2033
Frequently Asked Questions
1. What is the projected Compound Annual Growth Rate (CAGR) of the Burn Ointment Industry?
The projected CAGR is approximately 5.95%.
2. Which companies are prominent players in the Burn Ointment Industry?
Key companies in the market include Smith & Nephew PLC, Perrigo Company PLC, DeRoyal Industries Inc, Intergra LifeSciences, 3M, ConvaTec Group PLC, Dr Morepen, Mankind Pharma, Cardinal Health, Cipla Limited, Trio Lifescience Pvt Ltd, Johnson & Johnson, Sun Pharmaceutical Industries Ltd (Ranbaxy Laboratories Limited), GlaxoSmithKline PLC, Pfizer Inc.
3. What are the main segments of the Burn Ointment Industry?
The market segments include Product Type, Depth of Burn, End User.
4. Can you provide details about the market size?
The market size is estimated to be USD 1.1 Billion as of 2022.
5. What are some drivers contributing to market growth?
Rising Incidences of Burn; Increasing Awareness Regarding Treatment Options.
6. What are the notable trends driving market growth?
The Topical Antibiotics Segment is Expected to Hold a Significant Market Share Over the Forecast Period.
7. Are there any restraints impacting market growth?
Side Effects Associated with Burn Ointment.
8. Can you provide examples of recent developments in the market?
In May 2022, Molncyke Healthcare sunmitted the clinical evidence in Wound International 2022 on the use of Mediplex Ag for the management of partial thickness burns. The soft silicone wound contact layer in Mediplex designed to help minimise wound and peri-wound trauma and associated pain aided in the burn healing.
9. What pricing options are available for accessing the report?
Pricing options include single-user, multi-user, and enterprise licenses priced at USD 4750, USD 5250, and USD 8750 respectively.
10. Is the market size provided in terms of value or volume?
The market size is provided in terms of value, measured in Billion and volume, measured in K Tons.
11. Are there any specific market keywords associated with the report?
Yes, the market keyword associated with the report is "Burn Ointment Industry," which aids in identifying and referencing the specific market segment covered.
12. How do I determine which pricing option suits my needs best?
The pricing options vary based on user requirements and access needs. Individual users may opt for single-user licenses, while businesses requiring broader access may choose multi-user or enterprise licenses for cost-effective access to the report.
13. Are there any additional resources or data provided in the Burn Ointment Industry report?
While the report offers comprehensive insights, it's advisable to review the specific contents or supplementary materials provided to ascertain if additional resources or data are available.
14. How can I stay updated on further developments or reports in the Burn Ointment Industry?
To stay informed about further developments, trends, and reports in the Burn Ointment Industry, consider subscribing to industry newsletters, following relevant companies and organizations, or regularly checking reputable industry news sources and publications.
Methodology
Step 1 - Identification of Relevant Samples Size from Population Database


Step 2 - Approaches for Defining Global Market Size (Value, Volume* & Price*)

Note*: In applicable scenarios
Step 3 - Data Sources
Primary Research
- Web Analytics
- Survey Reports
- Research Institute
- Latest Research Reports
- Opinion Leaders
Secondary Research
- Annual Reports
- White Paper
- Latest Press Release
- Industry Association
- Paid Database
- Investor Presentations

Step 4 - Data Triangulation
Involves using different sources of information in order to increase the validity of a study
These sources are likely to be stakeholders in a program - participants, other researchers, program staff, other community members, and so on.
Then we put all data in single framework & apply various statistical tools to find out the dynamic on the market.
During the analysis stage, feedback from the stakeholder groups would be compared to determine areas of agreement as well as areas of divergence