

Key Insights
The Postoperative Pain Medication market is poised for significant expansion, projecting a current market size of $40.46 Million and a robust Compound Annual Growth Rate (CAGR) of 5.79%. This growth trajectory is driven by several key factors. An increasing volume of surgical procedures globally, driven by an aging population and advancements in medical technology, directly fuels the demand for effective pain management solutions. Furthermore, heightened awareness among both healthcare professionals and patients regarding the importance of adequate postoperative pain control for improved patient outcomes, reduced hospital stays, and enhanced recovery experiences is a major catalyst. The expanding pipeline of innovative drug formulations, including novel non-opioid analgesics and targeted delivery systems, also contributes to market dynamism. Addressing the rising prevalence of chronic pain conditions that often require surgical intervention further solidifies the market's upward trend.
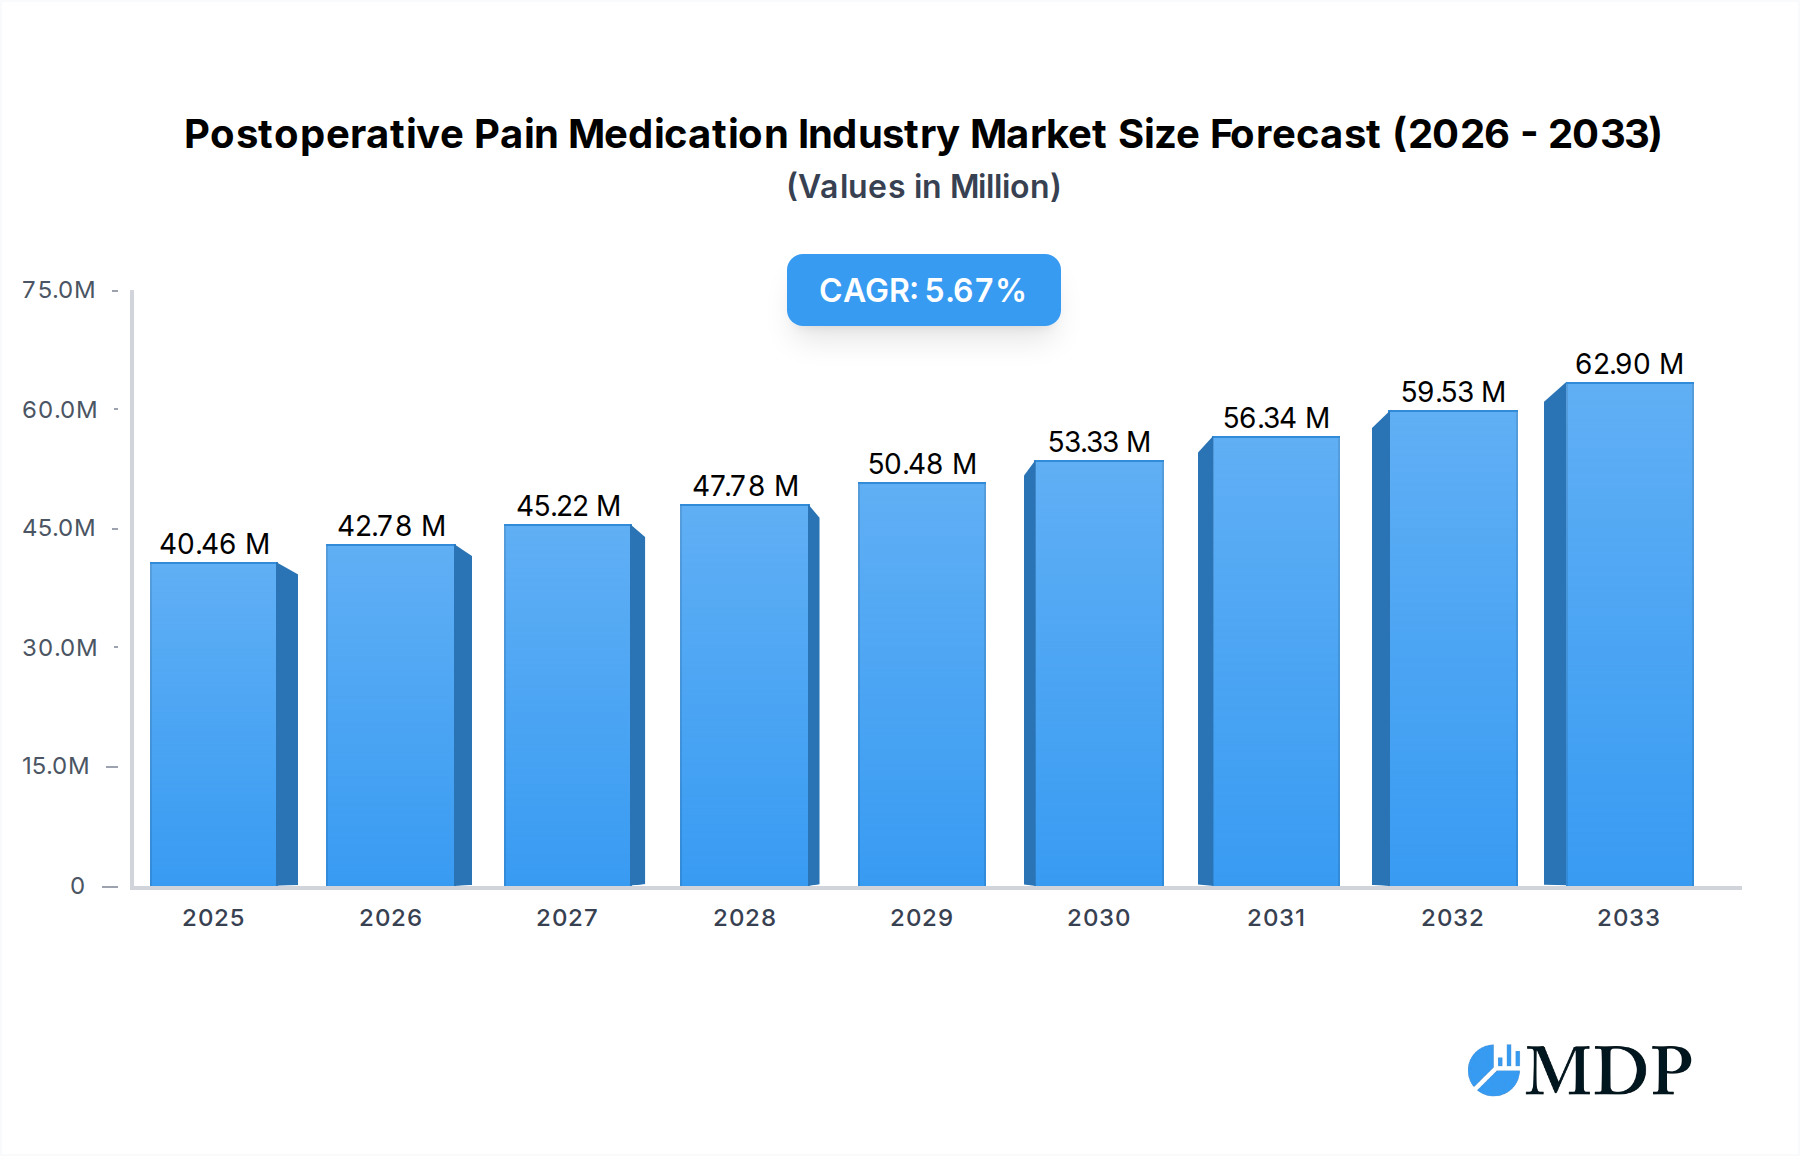
Postoperative Pain Medication Industry Market Size (In Million)
Despite the optimistic outlook, certain factors could influence the pace of market development. While opioids have historically dominated the pain management landscape, concerns regarding addiction and side effects are driving a shift towards alternative analgesic classes. Stricter regulatory frameworks and the increasing emphasis on multimodal pain management strategies, which combine various therapeutic approaches, represent both opportunities and challenges for market players. High research and development costs associated with bringing new pain medications to market, coupled with lengthy approval processes, can also pose significant hurdles. Nonetheless, the continuous innovation in drug delivery systems and the development of safer, more effective pain relief options are expected to propel the market forward, creating substantial opportunities for companies focused on improving patient care post-surgery. The market's segmentation by drug class, route of administration, and distribution channel reflects diverse patient needs and healthcare delivery models.

Postoperative Pain Medication Industry Company Market Share
Postoperative Pain Medication Industry Market Dynamics & Concentration
The postoperative pain medication market is characterized by a moderate level of concentration, with a mix of large pharmaceutical giants and specialized biotechnology firms vying for market share. Innovation serves as a primary driver, fueled by the continuous pursuit of more effective, safer, and less addictive pain management solutions. Regulatory frameworks, particularly those concerning opioid control and drug approval processes, significantly shape market entry and product development strategies. The threat of product substitutes, including non-pharmacological pain management techniques, necessitates ongoing innovation. End-user trends reveal a growing preference for multimodal analgesia, combining different drug classes and routes of administration to optimize efficacy and minimize side effects. Merger and acquisition (M&A) activities are observed, indicating strategic consolidation and an effort to acquire novel technologies and market access. The historical period from 2019 to 2024 has seen significant shifts, with the base year of 2025 setting the stage for the forecast period of 2025–2033. The estimated year of 2025 is crucial for understanding current market positioning.
- Market Share: Dominant players hold significant market share, with estimations suggesting a collective share of over 60% held by the top five companies.
- M&A Deal Counts: The historical period witnessed approximately 10-15 significant M&A deals, averaging around 2-3 per year, with an estimated total deal value exceeding $5 Billion.
Postoperative Pain Medication Industry Industry Trends & Analysis
The postoperative pain medication industry is poised for substantial growth, driven by an increasing number of surgical procedures globally and a rising demand for effective pain relief solutions. The market is projected to experience a Compound Annual Growth Rate (CAGR) of approximately 6.5% during the forecast period of 2025–2033. Technological disruptions are playing a pivotal role, with advancements in drug delivery systems, such as long-acting formulations and targeted drug release mechanisms, gaining significant traction. These innovations aim to improve patient compliance, reduce the frequency of dosing, and enhance pain management outcomes, thereby leading to increased market penetration of advanced therapies. Consumer preferences are shifting towards non-opioid alternatives and multimodal pain management strategies, reflecting growing concerns about opioid addiction and side effects. This trend is pushing research and development towards novel non-opioid analgesics and adjunctive therapies. Competitive dynamics are intensifying, with established pharmaceutical companies investing heavily in R&D and emerging biotech firms focusing on niche therapeutic areas and innovative drug candidates. The market penetration of advanced pain management solutions is expected to rise, driven by both technological innovation and evolving patient and physician expectations. The estimated year of 2025 represents a critical juncture, with current market penetration of non-opioid alternatives estimated at around 30%.
Leading Markets & Segments in Postoperative Pain Medication Industry
The global postoperative pain medication market is segmented by drug class, route of administration, and distribution channel, with significant regional variations influencing segment dominance.
Drug Class Dominance:
- Non-steroidal anti-inflammatory drugs (NSAIDS): This segment is expected to maintain a leading position due to its broad efficacy in managing mild to moderate postoperative pain and its relatively favorable safety profile compared to opioids. Factors contributing to this dominance include established clinical use, cost-effectiveness, and a growing preference for non-opioid options. The market share for NSAIDs in postoperative pain management is estimated to be around 35% in 2025.
- Opioids: While still a crucial component for severe pain management, the opioid segment's dominance is gradually declining due to concerns about addiction and regulatory crackdowns. However, their efficacy in managing acute, severe postoperative pain ensures continued market presence.
- Other Drug Classes: This includes muscle relaxants, anticonvulsants, and local anesthetics, which play vital roles in multimodal analgesia strategies, often used in combination with NSAIDs and opioids.
Route of Administration Dominance:
- Injectable: This route remains dominant for immediate and potent pain relief, particularly in hospital settings post-surgery. The effectiveness of injectable formulations in providing rapid analgesia contributes significantly to their market share, estimated at 45% in 2025.
- Oral: Oral formulations offer convenience for outpatient management and are gaining traction as patients transition from hospital care. The increasing adoption of same-day surgery and enhanced recovery protocols further boosts the oral segment.
- Topical: Topical applications are gaining popularity for localized pain relief, offering a targeted approach with reduced systemic side effects.
Distribution Channel Dominance:
- Hospital Pharmacies: These remain the primary distribution channel, given the inpatient nature of many surgical procedures and the immediate need for medications. The control and administration of potent pain relievers in a supervised environment make hospital pharmacies central to the market.
- Retail Pharmacies: As outpatient surgeries increase and patients are discharged with prescriptions, retail pharmacies are experiencing growing importance in the distribution of postoperative pain medications.
The North American region, particularly the United States, is projected to be the leading market due to a high volume of surgical procedures, advanced healthcare infrastructure, and significant R&D investments. Economic policies supporting healthcare access and technological advancements in pain management further bolster its dominance.
Postoperative Pain Medication Industry Product Developments
Product innovation in the postoperative pain medication industry is focused on enhancing efficacy, reducing side effects, and addressing the opioid crisis. Developments include long-acting injectable formulations that provide sustained pain relief for extended periods, minimizing the need for frequent dosing. Novel non-opioid analgesics targeting different pain pathways are emerging, offering safer alternatives. Combination therapies, integrating multiple drug classes or novel delivery mechanisms, are also gaining traction to achieve synergistic effects and optimize pain management. These advancements aim to improve patient outcomes, reduce hospital readmissions, and enhance the overall surgical recovery experience.
Key Drivers of Postoperative Pain Medication Industry Growth
Several key drivers are propelling the growth of the postoperative pain medication industry. The increasing global incidence of surgical procedures, driven by an aging population and advancements in medical technology, directly translates to a higher demand for pain management solutions. Technological innovations, particularly in drug delivery systems and the development of non-opioid analgesics, are creating new market opportunities and improving treatment efficacy. Furthermore, growing awareness and concern regarding opioid addiction are fueling the demand for safer and more effective alternative pain management strategies, pushing the market towards multimodal approaches. Favorable regulatory pathways for novel pain relief medications also contribute to market expansion.
Challenges in the Postoperative Pain Medication Industry Market
Despite its growth trajectory, the postoperative pain medication industry faces significant challenges. Stringent regulatory hurdles and lengthy approval processes for new drug entities can delay market entry and increase development costs. The ongoing opioid crisis continues to cast a shadow, leading to increased scrutiny and tighter prescribing guidelines for opioid analgesics, impacting their market share. Moreover, competition from established players and the potential for new entrants with innovative products create a dynamic and challenging competitive landscape. Ensuring equitable access to advanced pain management solutions across different socioeconomic strata and geographical regions also remains a hurdle.
Emerging Opportunities in Postoperative Pain Medication Industry
Emerging opportunities in the postoperative pain medication industry are driven by a confluence of scientific breakthroughs and evolving healthcare paradigms. The development of targeted therapies that focus on specific pain mechanisms and the exploration of novel non-pharmacological interventions present significant avenues for growth. Strategic partnerships between pharmaceutical companies and research institutions are crucial for accelerating the discovery and development of next-generation pain management solutions. Furthermore, the increasing adoption of value-based healthcare models encourages the development of cost-effective and outcome-oriented pain management strategies, creating a fertile ground for innovative products that demonstrate clear clinical and economic benefits.
Leading Players in the Postoperative Pain Medication Industry Sector
- Innocoll
- Bayer AG
- Johnson & Johnson (Janssen Pharmaceuticals)
- Cali Biosciences
- Alembic Pharmaceuticals
- AFT Pharmaceuticals
- SiteOne Therapeutics
- Pfizer Inc
- Haleon PLC (GSK)
- AbbVie (Allergan)
- Cipla Inc (InvaGen Pharmaceuticals Inc)
- Heron Therapeutics
- Pacira Pharmaceuticals Inc
Key Milestones in Postoperative Pain Medication Industry Industry
- April 2023: Cali Biosciences Co., Ltd. initiated Phase III studies of its core product, CPL-01 (long-acting ropivacaine), with dosing in hernia patients already begun and dosing in bunion patients scheduled to start next month. This development highlights progress in long-acting local anesthetic formulations.
- March 2022: Health Canada issued a Notice of Compliance (NOC) to commercialize Heron Therapeutics' ZYNRELEF (bupivacaine, an amide local anesthetic, and meloxicam, a nonsteroidal anti-inflammatory drug (NSAID) extended-release solution) for instillation into the surgical wound for postoperative analgesia after a bunionectomy, open inguinal herniorrhaphy, and total knee arthroplasty surgical procedures. This signifies a key regulatory approval for a novel multimodal pain management solution.
Strategic Outlook for Postoperative Pain Medication Industry Market
The strategic outlook for the postoperative pain medication industry is highly promising, driven by a robust pipeline of innovative therapies and a growing global demand for effective pain management. Companies are focusing on developing non-opioid alternatives, long-acting formulations, and multimodal pain management strategies to address unmet clinical needs and patient preferences. Strategic collaborations and acquisitions are anticipated to play a crucial role in expanding market reach and accessing new technologies. The increasing emphasis on patient-centric care and evidence-based medicine will further accelerate the adoption of advanced pain relief solutions, ensuring sustained growth and market expansion in the coming years.
Postoperative Pain Medication Industry Segmentation
-
1. Drug Class
- 1.1. Opioids
- 1.2. Non-steroidal anti-inflammatory drugs (NSAIDS)
- 1.3. Cyclooxy
- 1.4. Other Drug Classes
-
2. Route of Administration
- 2.1. Injectable
- 2.2. Oral
- 2.3. Topical
- 2.4. Other Routes of Administration
-
3. Distribution Channel
- 3.1. Hospital Pharmacies
- 3.2. Retail Pharmacies
- 3.3. Other Distribution Channels
Postoperative Pain Medication Industry Segmentation By Geography
-
1. North America
- 1.1. United States
- 1.2. Canada
- 1.3. Mexico
-
2. Europe
- 2.1. Germany
- 2.2. United Kingdom
- 2.3. France
- 2.4. Italy
- 2.5. Spain
- 2.6. Rest of Europe
-
3. Asia Pacific
- 3.1. China
- 3.2. Japan
- 3.3. India
- 3.4. Australia
- 3.5. South Korea
- 3.6. Rest of Asia Pacific
-
4. Middle East and Africa
- 4.1. GCC
- 4.2. South Africa
- 4.3. Rest of Middle East and Africa
-
5. South America
- 5.1. Brazil
- 5.2. Argentina
- 5.3. Rest of South America
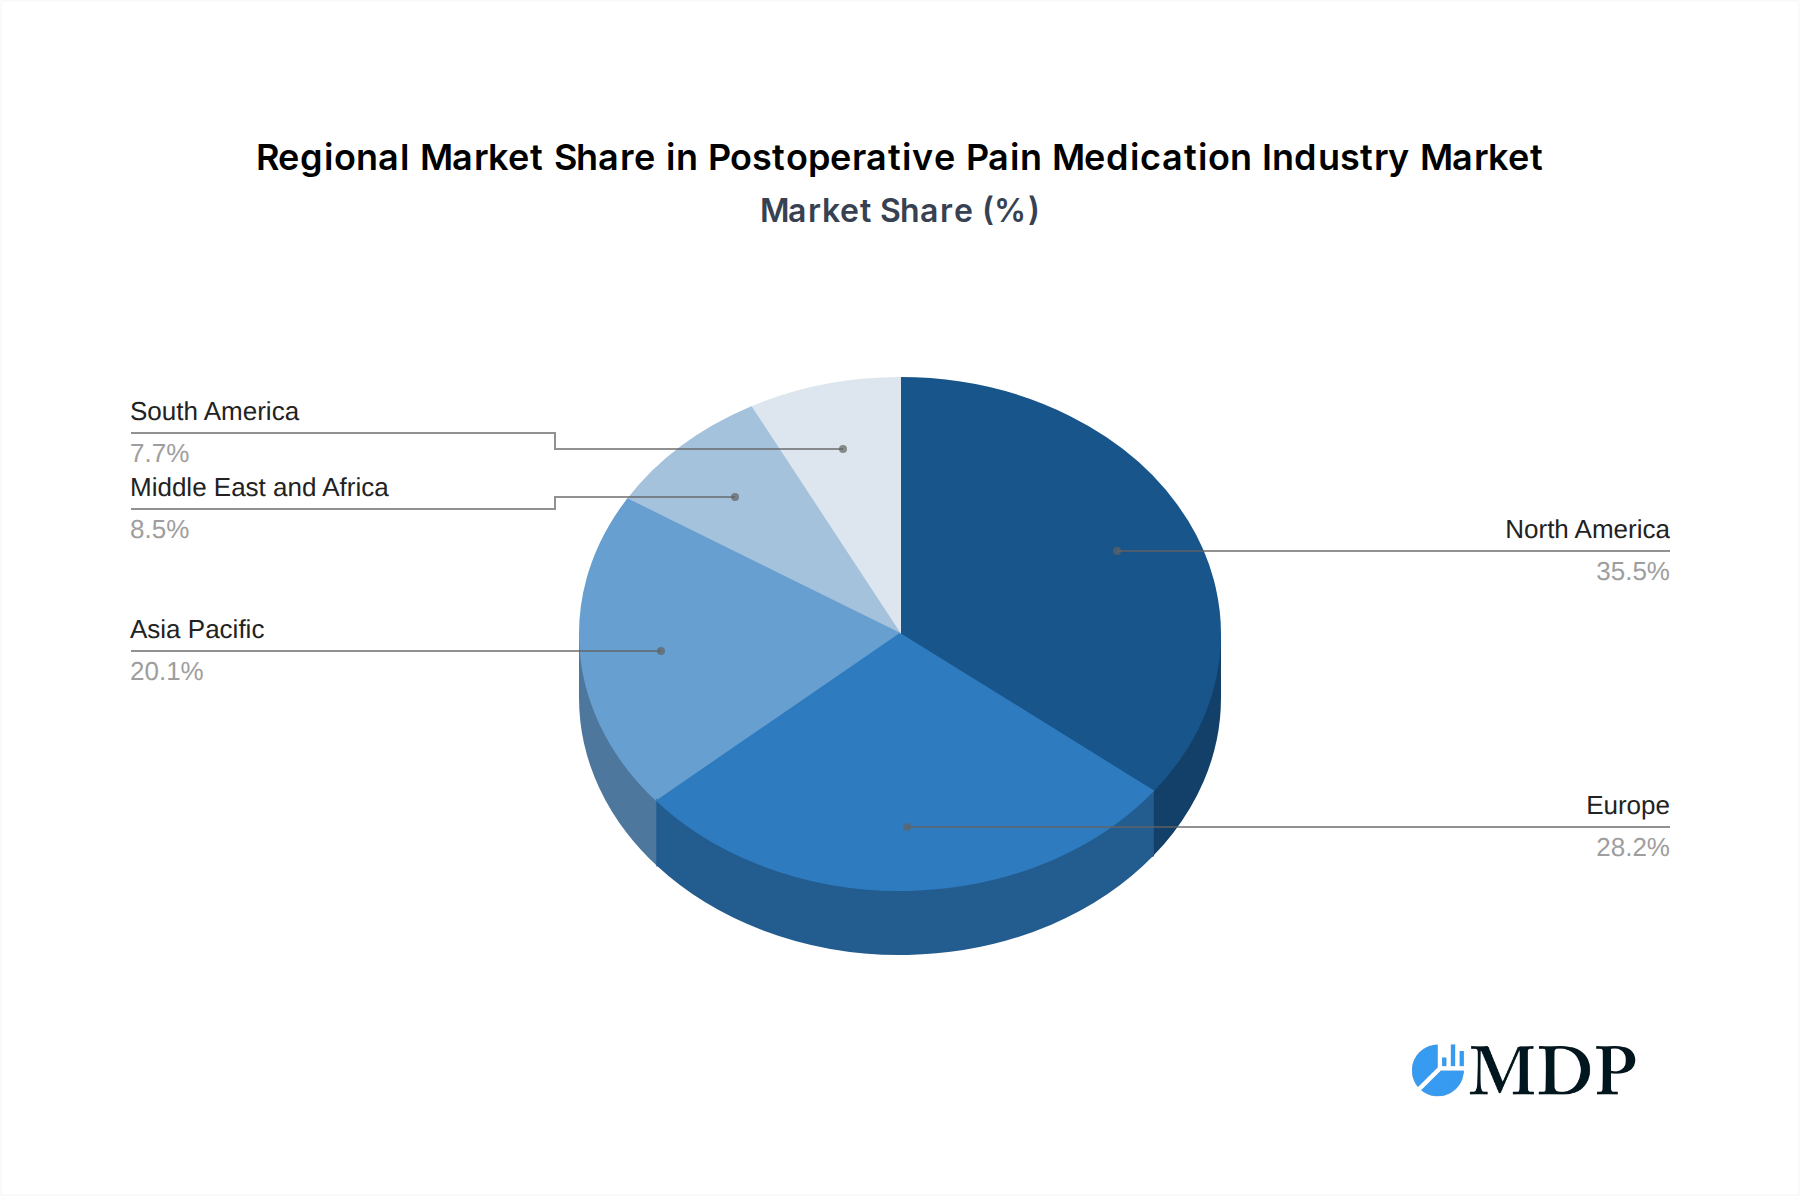
Postoperative Pain Medication Industry Regional Market Share
Geographic Coverage of Postoperative Pain Medication Industry
Postoperative Pain Medication Industry REPORT HIGHLIGHTS
| Aspects | Details |
|---|---|
| Study Period | 2020-2034 |
| Base Year | 2025 |
| Estimated Year | 2026 |
| Forecast Period | 2026-2034 |
| Historical Period | 2020-2025 |
| Growth Rate | CAGR of 5.79% from 2020-2034 |
| Segmentation |
|
Table of Contents
- 1. Introduction
- 1.1. Research Scope
- 1.2. Market Segmentation
- 1.3. Research Objective
- 1.4. Definitions and Assumptions
- 2. Executive Summary
- 2.1. Market Snapshot
- 3. Market Dynamics
- 3.1. Market Drivers
- 3.2. Market Restrains
- 3.3. Market Trends
- 3.4. Market Opportunities
- 4. Market Factor Analysis
- 4.1. Porters Five Forces
- 4.1.1. Bargaining Power of Suppliers
- 4.1.2. Bargaining Power of Buyers
- 4.1.3. Threat of New Entrants
- 4.1.4. Threat of Substitutes
- 4.1.5. Competitive Rivalry
- 4.2. PESTEL analysis
- 4.3. BCG Analysis
- 4.3.1. Stars (High Growth, High Market Share)
- 4.3.2. Cash Cows (Low Growth, High Market Share)
- 4.3.3. Question Mark (High Growth, Low Market Share)
- 4.3.4. Dogs (Low Growth, Low Market Share)
- 4.4. Ansoff Matrix Analysis
- 4.5. Supply Chain Analysis
- 4.6. Regulatory Landscape
- 4.7. Current Market Potential and Opportunity Assessment (TAM–SAM–SOM Framework)
- 4.8. MDP Analyst Note
- 4.1. Porters Five Forces
- 5. Market Analysis, Insights and Forecast 2021-2033
- 5.1. Market Analysis, Insights and Forecast - by Drug Class
- 5.1.1. Opioids
- 5.1.2. Non-steroidal anti-inflammatory drugs (NSAIDS)
- 5.1.3. Cyclooxy
- 5.1.4. Other Drug Classes
- 5.2. Market Analysis, Insights and Forecast - by Route of Administration
- 5.2.1. Injectable
- 5.2.2. Oral
- 5.2.3. Topical
- 5.2.4. Other Routes of Administration
- 5.3. Market Analysis, Insights and Forecast - by Distribution Channel
- 5.3.1. Hospital Pharmacies
- 5.3.2. Retail Pharmacies
- 5.3.3. Other Distribution Channels
- 5.4. Market Analysis, Insights and Forecast - by Region
- 5.4.1. North America
- 5.4.2. Europe
- 5.4.3. Asia Pacific
- 5.4.4. Middle East and Africa
- 5.4.5. South America
- 5.1. Market Analysis, Insights and Forecast - by Drug Class
- 6. Global Postoperative Pain Medication Industry Analysis, Insights and Forecast, 2021-2033
- 6.1. Market Analysis, Insights and Forecast - by Drug Class
- 6.1.1. Opioids
- 6.1.2. Non-steroidal anti-inflammatory drugs (NSAIDS)
- 6.1.3. Cyclooxy
- 6.1.4. Other Drug Classes
- 6.2. Market Analysis, Insights and Forecast - by Route of Administration
- 6.2.1. Injectable
- 6.2.2. Oral
- 6.2.3. Topical
- 6.2.4. Other Routes of Administration
- 6.3. Market Analysis, Insights and Forecast - by Distribution Channel
- 6.3.1. Hospital Pharmacies
- 6.3.2. Retail Pharmacies
- 6.3.3. Other Distribution Channels
- 6.1. Market Analysis, Insights and Forecast - by Drug Class
- 7. North America Postoperative Pain Medication Industry Analysis, Insights and Forecast, 2020-2032
- 7.1. Market Analysis, Insights and Forecast - by Drug Class
- 7.1.1. Opioids
- 7.1.2. Non-steroidal anti-inflammatory drugs (NSAIDS)
- 7.1.3. Cyclooxy
- 7.1.4. Other Drug Classes
- 7.2. Market Analysis, Insights and Forecast - by Route of Administration
- 7.2.1. Injectable
- 7.2.2. Oral
- 7.2.3. Topical
- 7.2.4. Other Routes of Administration
- 7.3. Market Analysis, Insights and Forecast - by Distribution Channel
- 7.3.1. Hospital Pharmacies
- 7.3.2. Retail Pharmacies
- 7.3.3. Other Distribution Channels
- 7.1. Market Analysis, Insights and Forecast - by Drug Class
- 8. Europe Postoperative Pain Medication Industry Analysis, Insights and Forecast, 2020-2032
- 8.1. Market Analysis, Insights and Forecast - by Drug Class
- 8.1.1. Opioids
- 8.1.2. Non-steroidal anti-inflammatory drugs (NSAIDS)
- 8.1.3. Cyclooxy
- 8.1.4. Other Drug Classes
- 8.2. Market Analysis, Insights and Forecast - by Route of Administration
- 8.2.1. Injectable
- 8.2.2. Oral
- 8.2.3. Topical
- 8.2.4. Other Routes of Administration
- 8.3. Market Analysis, Insights and Forecast - by Distribution Channel
- 8.3.1. Hospital Pharmacies
- 8.3.2. Retail Pharmacies
- 8.3.3. Other Distribution Channels
- 8.1. Market Analysis, Insights and Forecast - by Drug Class
- 9. Asia Pacific Postoperative Pain Medication Industry Analysis, Insights and Forecast, 2020-2032
- 9.1. Market Analysis, Insights and Forecast - by Drug Class
- 9.1.1. Opioids
- 9.1.2. Non-steroidal anti-inflammatory drugs (NSAIDS)
- 9.1.3. Cyclooxy
- 9.1.4. Other Drug Classes
- 9.2. Market Analysis, Insights and Forecast - by Route of Administration
- 9.2.1. Injectable
- 9.2.2. Oral
- 9.2.3. Topical
- 9.2.4. Other Routes of Administration
- 9.3. Market Analysis, Insights and Forecast - by Distribution Channel
- 9.3.1. Hospital Pharmacies
- 9.3.2. Retail Pharmacies
- 9.3.3. Other Distribution Channels
- 9.1. Market Analysis, Insights and Forecast - by Drug Class
- 10. Middle East and Africa Postoperative Pain Medication Industry Analysis, Insights and Forecast, 2020-2032
- 10.1. Market Analysis, Insights and Forecast - by Drug Class
- 10.1.1. Opioids
- 10.1.2. Non-steroidal anti-inflammatory drugs (NSAIDS)
- 10.1.3. Cyclooxy
- 10.1.4. Other Drug Classes
- 10.2. Market Analysis, Insights and Forecast - by Route of Administration
- 10.2.1. Injectable
- 10.2.2. Oral
- 10.2.3. Topical
- 10.2.4. Other Routes of Administration
- 10.3. Market Analysis, Insights and Forecast - by Distribution Channel
- 10.3.1. Hospital Pharmacies
- 10.3.2. Retail Pharmacies
- 10.3.3. Other Distribution Channels
- 10.1. Market Analysis, Insights and Forecast - by Drug Class
- 11. South America Postoperative Pain Medication Industry Analysis, Insights and Forecast, 2020-2032
- 11.1. Market Analysis, Insights and Forecast - by Drug Class
- 11.1.1. Opioids
- 11.1.2. Non-steroidal anti-inflammatory drugs (NSAIDS)
- 11.1.3. Cyclooxy
- 11.1.4. Other Drug Classes
- 11.2. Market Analysis, Insights and Forecast - by Route of Administration
- 11.2.1. Injectable
- 11.2.2. Oral
- 11.2.3. Topical
- 11.2.4. Other Routes of Administration
- 11.3. Market Analysis, Insights and Forecast - by Distribution Channel
- 11.3.1. Hospital Pharmacies
- 11.3.2. Retail Pharmacies
- 11.3.3. Other Distribution Channels
- 11.1. Market Analysis, Insights and Forecast - by Drug Class
- 12. Competitive Analysis
- 12.1. Company Profiles
- 12.1.1 Innocoll
- 12.1.1.1. Company Overview
- 12.1.1.2. Products
- 12.1.1.3. Company Financials
- 12.1.1.4. SWOT Analysis
- 12.1.2 Bayer AG
- 12.1.2.1. Company Overview
- 12.1.2.2. Products
- 12.1.2.3. Company Financials
- 12.1.2.4. SWOT Analysis
- 12.1.3 Johnson & Johnson (Janssen Pharmaceuticals)
- 12.1.3.1. Company Overview
- 12.1.3.2. Products
- 12.1.3.3. Company Financials
- 12.1.3.4. SWOT Analysis
- 12.1.4 Cali Biosciences
- 12.1.4.1. Company Overview
- 12.1.4.2. Products
- 12.1.4.3. Company Financials
- 12.1.4.4. SWOT Analysis
- 12.1.5 Alembic Pharmaceuticals
- 12.1.5.1. Company Overview
- 12.1.5.2. Products
- 12.1.5.3. Company Financials
- 12.1.5.4. SWOT Analysis
- 12.1.6 AFT Pharmaceuticals
- 12.1.6.1. Company Overview
- 12.1.6.2. Products
- 12.1.6.3. Company Financials
- 12.1.6.4. SWOT Analysis
- 12.1.7 SiteOne Therapeutics
- 12.1.7.1. Company Overview
- 12.1.7.2. Products
- 12.1.7.3. Company Financials
- 12.1.7.4. SWOT Analysis
- 12.1.8 Pfizer Inc
- 12.1.8.1. Company Overview
- 12.1.8.2. Products
- 12.1.8.3. Company Financials
- 12.1.8.4. SWOT Analysis
- 12.1.9 Haleon PLC (GSK)
- 12.1.9.1. Company Overview
- 12.1.9.2. Products
- 12.1.9.3. Company Financials
- 12.1.9.4. SWOT Analysis
- 12.1.10 AbbVie (Allergan)
- 12.1.10.1. Company Overview
- 12.1.10.2. Products
- 12.1.10.3. Company Financials
- 12.1.10.4. SWOT Analysis
- 12.1.11 Cipla Inc (InvaGen Pharmaceuticals Inc )
- 12.1.11.1. Company Overview
- 12.1.11.2. Products
- 12.1.11.3. Company Financials
- 12.1.11.4. SWOT Analysis
- 12.1.12 Heron Therapeutics
- 12.1.12.1. Company Overview
- 12.1.12.2. Products
- 12.1.12.3. Company Financials
- 12.1.12.4. SWOT Analysis
- 12.1.13 Pacira Pharmaceuticals Inc
- 12.1.13.1. Company Overview
- 12.1.13.2. Products
- 12.1.13.3. Company Financials
- 12.1.13.4. SWOT Analysis
- 12.1.1 Innocoll
- 12.2. Market Entropy
- 12.2.1 Company's Key Areas Served
- 12.2.2 Recent Developments
- 12.3. Company Market Share Analysis 2025
- 12.3.1 Top 5 Companies Market Share Analysis
- 12.3.2 Top 3 Companies Market Share Analysis
- 12.4. List of Potential Customers
- 13. Research Methodology
List of Figures
- Figure 1: Global Postoperative Pain Medication Industry Revenue Breakdown (Million, %) by Region 2025 & 2033
- Figure 2: Global Postoperative Pain Medication Industry Volume Breakdown (K Unit, %) by Region 2025 & 2033
- Figure 3: North America Postoperative Pain Medication Industry Revenue (Million), by Drug Class 2025 & 2033
- Figure 4: North America Postoperative Pain Medication Industry Volume (K Unit), by Drug Class 2025 & 2033
- Figure 5: North America Postoperative Pain Medication Industry Revenue Share (%), by Drug Class 2025 & 2033
- Figure 6: North America Postoperative Pain Medication Industry Volume Share (%), by Drug Class 2025 & 2033
- Figure 7: North America Postoperative Pain Medication Industry Revenue (Million), by Route of Administration 2025 & 2033
- Figure 8: North America Postoperative Pain Medication Industry Volume (K Unit), by Route of Administration 2025 & 2033
- Figure 9: North America Postoperative Pain Medication Industry Revenue Share (%), by Route of Administration 2025 & 2033
- Figure 10: North America Postoperative Pain Medication Industry Volume Share (%), by Route of Administration 2025 & 2033
- Figure 11: North America Postoperative Pain Medication Industry Revenue (Million), by Distribution Channel 2025 & 2033
- Figure 12: North America Postoperative Pain Medication Industry Volume (K Unit), by Distribution Channel 2025 & 2033
- Figure 13: North America Postoperative Pain Medication Industry Revenue Share (%), by Distribution Channel 2025 & 2033
- Figure 14: North America Postoperative Pain Medication Industry Volume Share (%), by Distribution Channel 2025 & 2033
- Figure 15: North America Postoperative Pain Medication Industry Revenue (Million), by Country 2025 & 2033
- Figure 16: North America Postoperative Pain Medication Industry Volume (K Unit), by Country 2025 & 2033
- Figure 17: North America Postoperative Pain Medication Industry Revenue Share (%), by Country 2025 & 2033
- Figure 18: North America Postoperative Pain Medication Industry Volume Share (%), by Country 2025 & 2033
- Figure 19: Europe Postoperative Pain Medication Industry Revenue (Million), by Drug Class 2025 & 2033
- Figure 20: Europe Postoperative Pain Medication Industry Volume (K Unit), by Drug Class 2025 & 2033
- Figure 21: Europe Postoperative Pain Medication Industry Revenue Share (%), by Drug Class 2025 & 2033
- Figure 22: Europe Postoperative Pain Medication Industry Volume Share (%), by Drug Class 2025 & 2033
- Figure 23: Europe Postoperative Pain Medication Industry Revenue (Million), by Route of Administration 2025 & 2033
- Figure 24: Europe Postoperative Pain Medication Industry Volume (K Unit), by Route of Administration 2025 & 2033
- Figure 25: Europe Postoperative Pain Medication Industry Revenue Share (%), by Route of Administration 2025 & 2033
- Figure 26: Europe Postoperative Pain Medication Industry Volume Share (%), by Route of Administration 2025 & 2033
- Figure 27: Europe Postoperative Pain Medication Industry Revenue (Million), by Distribution Channel 2025 & 2033
- Figure 28: Europe Postoperative Pain Medication Industry Volume (K Unit), by Distribution Channel 2025 & 2033
- Figure 29: Europe Postoperative Pain Medication Industry Revenue Share (%), by Distribution Channel 2025 & 2033
- Figure 30: Europe Postoperative Pain Medication Industry Volume Share (%), by Distribution Channel 2025 & 2033
- Figure 31: Europe Postoperative Pain Medication Industry Revenue (Million), by Country 2025 & 2033
- Figure 32: Europe Postoperative Pain Medication Industry Volume (K Unit), by Country 2025 & 2033
- Figure 33: Europe Postoperative Pain Medication Industry Revenue Share (%), by Country 2025 & 2033
- Figure 34: Europe Postoperative Pain Medication Industry Volume Share (%), by Country 2025 & 2033
- Figure 35: Asia Pacific Postoperative Pain Medication Industry Revenue (Million), by Drug Class 2025 & 2033
- Figure 36: Asia Pacific Postoperative Pain Medication Industry Volume (K Unit), by Drug Class 2025 & 2033
- Figure 37: Asia Pacific Postoperative Pain Medication Industry Revenue Share (%), by Drug Class 2025 & 2033
- Figure 38: Asia Pacific Postoperative Pain Medication Industry Volume Share (%), by Drug Class 2025 & 2033
- Figure 39: Asia Pacific Postoperative Pain Medication Industry Revenue (Million), by Route of Administration 2025 & 2033
- Figure 40: Asia Pacific Postoperative Pain Medication Industry Volume (K Unit), by Route of Administration 2025 & 2033
- Figure 41: Asia Pacific Postoperative Pain Medication Industry Revenue Share (%), by Route of Administration 2025 & 2033
- Figure 42: Asia Pacific Postoperative Pain Medication Industry Volume Share (%), by Route of Administration 2025 & 2033
- Figure 43: Asia Pacific Postoperative Pain Medication Industry Revenue (Million), by Distribution Channel 2025 & 2033
- Figure 44: Asia Pacific Postoperative Pain Medication Industry Volume (K Unit), by Distribution Channel 2025 & 2033
- Figure 45: Asia Pacific Postoperative Pain Medication Industry Revenue Share (%), by Distribution Channel 2025 & 2033
- Figure 46: Asia Pacific Postoperative Pain Medication Industry Volume Share (%), by Distribution Channel 2025 & 2033
- Figure 47: Asia Pacific Postoperative Pain Medication Industry Revenue (Million), by Country 2025 & 2033
- Figure 48: Asia Pacific Postoperative Pain Medication Industry Volume (K Unit), by Country 2025 & 2033
- Figure 49: Asia Pacific Postoperative Pain Medication Industry Revenue Share (%), by Country 2025 & 2033
- Figure 50: Asia Pacific Postoperative Pain Medication Industry Volume Share (%), by Country 2025 & 2033
- Figure 51: Middle East and Africa Postoperative Pain Medication Industry Revenue (Million), by Drug Class 2025 & 2033
- Figure 52: Middle East and Africa Postoperative Pain Medication Industry Volume (K Unit), by Drug Class 2025 & 2033
- Figure 53: Middle East and Africa Postoperative Pain Medication Industry Revenue Share (%), by Drug Class 2025 & 2033
- Figure 54: Middle East and Africa Postoperative Pain Medication Industry Volume Share (%), by Drug Class 2025 & 2033
- Figure 55: Middle East and Africa Postoperative Pain Medication Industry Revenue (Million), by Route of Administration 2025 & 2033
- Figure 56: Middle East and Africa Postoperative Pain Medication Industry Volume (K Unit), by Route of Administration 2025 & 2033
- Figure 57: Middle East and Africa Postoperative Pain Medication Industry Revenue Share (%), by Route of Administration 2025 & 2033
- Figure 58: Middle East and Africa Postoperative Pain Medication Industry Volume Share (%), by Route of Administration 2025 & 2033
- Figure 59: Middle East and Africa Postoperative Pain Medication Industry Revenue (Million), by Distribution Channel 2025 & 2033
- Figure 60: Middle East and Africa Postoperative Pain Medication Industry Volume (K Unit), by Distribution Channel 2025 & 2033
- Figure 61: Middle East and Africa Postoperative Pain Medication Industry Revenue Share (%), by Distribution Channel 2025 & 2033
- Figure 62: Middle East and Africa Postoperative Pain Medication Industry Volume Share (%), by Distribution Channel 2025 & 2033
- Figure 63: Middle East and Africa Postoperative Pain Medication Industry Revenue (Million), by Country 2025 & 2033
- Figure 64: Middle East and Africa Postoperative Pain Medication Industry Volume (K Unit), by Country 2025 & 2033
- Figure 65: Middle East and Africa Postoperative Pain Medication Industry Revenue Share (%), by Country 2025 & 2033
- Figure 66: Middle East and Africa Postoperative Pain Medication Industry Volume Share (%), by Country 2025 & 2033
- Figure 67: South America Postoperative Pain Medication Industry Revenue (Million), by Drug Class 2025 & 2033
- Figure 68: South America Postoperative Pain Medication Industry Volume (K Unit), by Drug Class 2025 & 2033
- Figure 69: South America Postoperative Pain Medication Industry Revenue Share (%), by Drug Class 2025 & 2033
- Figure 70: South America Postoperative Pain Medication Industry Volume Share (%), by Drug Class 2025 & 2033
- Figure 71: South America Postoperative Pain Medication Industry Revenue (Million), by Route of Administration 2025 & 2033
- Figure 72: South America Postoperative Pain Medication Industry Volume (K Unit), by Route of Administration 2025 & 2033
- Figure 73: South America Postoperative Pain Medication Industry Revenue Share (%), by Route of Administration 2025 & 2033
- Figure 74: South America Postoperative Pain Medication Industry Volume Share (%), by Route of Administration 2025 & 2033
- Figure 75: South America Postoperative Pain Medication Industry Revenue (Million), by Distribution Channel 2025 & 2033
- Figure 76: South America Postoperative Pain Medication Industry Volume (K Unit), by Distribution Channel 2025 & 2033
- Figure 77: South America Postoperative Pain Medication Industry Revenue Share (%), by Distribution Channel 2025 & 2033
- Figure 78: South America Postoperative Pain Medication Industry Volume Share (%), by Distribution Channel 2025 & 2033
- Figure 79: South America Postoperative Pain Medication Industry Revenue (Million), by Country 2025 & 2033
- Figure 80: South America Postoperative Pain Medication Industry Volume (K Unit), by Country 2025 & 2033
- Figure 81: South America Postoperative Pain Medication Industry Revenue Share (%), by Country 2025 & 2033
- Figure 82: South America Postoperative Pain Medication Industry Volume Share (%), by Country 2025 & 2033
List of Tables
- Table 1: Global Postoperative Pain Medication Industry Revenue Million Forecast, by Drug Class 2020 & 2033
- Table 2: Global Postoperative Pain Medication Industry Volume K Unit Forecast, by Drug Class 2020 & 2033
- Table 3: Global Postoperative Pain Medication Industry Revenue Million Forecast, by Route of Administration 2020 & 2033
- Table 4: Global Postoperative Pain Medication Industry Volume K Unit Forecast, by Route of Administration 2020 & 2033
- Table 5: Global Postoperative Pain Medication Industry Revenue Million Forecast, by Distribution Channel 2020 & 2033
- Table 6: Global Postoperative Pain Medication Industry Volume K Unit Forecast, by Distribution Channel 2020 & 2033
- Table 7: Global Postoperative Pain Medication Industry Revenue Million Forecast, by Region 2020 & 2033
- Table 8: Global Postoperative Pain Medication Industry Volume K Unit Forecast, by Region 2020 & 2033
- Table 9: Global Postoperative Pain Medication Industry Revenue Million Forecast, by Drug Class 2020 & 2033
- Table 10: Global Postoperative Pain Medication Industry Volume K Unit Forecast, by Drug Class 2020 & 2033
- Table 11: Global Postoperative Pain Medication Industry Revenue Million Forecast, by Route of Administration 2020 & 2033
- Table 12: Global Postoperative Pain Medication Industry Volume K Unit Forecast, by Route of Administration 2020 & 2033
- Table 13: Global Postoperative Pain Medication Industry Revenue Million Forecast, by Distribution Channel 2020 & 2033
- Table 14: Global Postoperative Pain Medication Industry Volume K Unit Forecast, by Distribution Channel 2020 & 2033
- Table 15: Global Postoperative Pain Medication Industry Revenue Million Forecast, by Country 2020 & 2033
- Table 16: Global Postoperative Pain Medication Industry Volume K Unit Forecast, by Country 2020 & 2033
- Table 17: United States Postoperative Pain Medication Industry Revenue (Million) Forecast, by Application 2020 & 2033
- Table 18: United States Postoperative Pain Medication Industry Volume (K Unit) Forecast, by Application 2020 & 2033
- Table 19: Canada Postoperative Pain Medication Industry Revenue (Million) Forecast, by Application 2020 & 2033
- Table 20: Canada Postoperative Pain Medication Industry Volume (K Unit) Forecast, by Application 2020 & 2033
- Table 21: Mexico Postoperative Pain Medication Industry Revenue (Million) Forecast, by Application 2020 & 2033
- Table 22: Mexico Postoperative Pain Medication Industry Volume (K Unit) Forecast, by Application 2020 & 2033
- Table 23: Global Postoperative Pain Medication Industry Revenue Million Forecast, by Drug Class 2020 & 2033
- Table 24: Global Postoperative Pain Medication Industry Volume K Unit Forecast, by Drug Class 2020 & 2033
- Table 25: Global Postoperative Pain Medication Industry Revenue Million Forecast, by Route of Administration 2020 & 2033
- Table 26: Global Postoperative Pain Medication Industry Volume K Unit Forecast, by Route of Administration 2020 & 2033
- Table 27: Global Postoperative Pain Medication Industry Revenue Million Forecast, by Distribution Channel 2020 & 2033
- Table 28: Global Postoperative Pain Medication Industry Volume K Unit Forecast, by Distribution Channel 2020 & 2033
- Table 29: Global Postoperative Pain Medication Industry Revenue Million Forecast, by Country 2020 & 2033
- Table 30: Global Postoperative Pain Medication Industry Volume K Unit Forecast, by Country 2020 & 2033
- Table 31: Germany Postoperative Pain Medication Industry Revenue (Million) Forecast, by Application 2020 & 2033
- Table 32: Germany Postoperative Pain Medication Industry Volume (K Unit) Forecast, by Application 2020 & 2033
- Table 33: United Kingdom Postoperative Pain Medication Industry Revenue (Million) Forecast, by Application 2020 & 2033
- Table 34: United Kingdom Postoperative Pain Medication Industry Volume (K Unit) Forecast, by Application 2020 & 2033
- Table 35: France Postoperative Pain Medication Industry Revenue (Million) Forecast, by Application 2020 & 2033
- Table 36: France Postoperative Pain Medication Industry Volume (K Unit) Forecast, by Application 2020 & 2033
- Table 37: Italy Postoperative Pain Medication Industry Revenue (Million) Forecast, by Application 2020 & 2033
- Table 38: Italy Postoperative Pain Medication Industry Volume (K Unit) Forecast, by Application 2020 & 2033
- Table 39: Spain Postoperative Pain Medication Industry Revenue (Million) Forecast, by Application 2020 & 2033
- Table 40: Spain Postoperative Pain Medication Industry Volume (K Unit) Forecast, by Application 2020 & 2033
- Table 41: Rest of Europe Postoperative Pain Medication Industry Revenue (Million) Forecast, by Application 2020 & 2033
- Table 42: Rest of Europe Postoperative Pain Medication Industry Volume (K Unit) Forecast, by Application 2020 & 2033
- Table 43: Global Postoperative Pain Medication Industry Revenue Million Forecast, by Drug Class 2020 & 2033
- Table 44: Global Postoperative Pain Medication Industry Volume K Unit Forecast, by Drug Class 2020 & 2033
- Table 45: Global Postoperative Pain Medication Industry Revenue Million Forecast, by Route of Administration 2020 & 2033
- Table 46: Global Postoperative Pain Medication Industry Volume K Unit Forecast, by Route of Administration 2020 & 2033
- Table 47: Global Postoperative Pain Medication Industry Revenue Million Forecast, by Distribution Channel 2020 & 2033
- Table 48: Global Postoperative Pain Medication Industry Volume K Unit Forecast, by Distribution Channel 2020 & 2033
- Table 49: Global Postoperative Pain Medication Industry Revenue Million Forecast, by Country 2020 & 2033
- Table 50: Global Postoperative Pain Medication Industry Volume K Unit Forecast, by Country 2020 & 2033
- Table 51: China Postoperative Pain Medication Industry Revenue (Million) Forecast, by Application 2020 & 2033
- Table 52: China Postoperative Pain Medication Industry Volume (K Unit) Forecast, by Application 2020 & 2033
- Table 53: Japan Postoperative Pain Medication Industry Revenue (Million) Forecast, by Application 2020 & 2033
- Table 54: Japan Postoperative Pain Medication Industry Volume (K Unit) Forecast, by Application 2020 & 2033
- Table 55: India Postoperative Pain Medication Industry Revenue (Million) Forecast, by Application 2020 & 2033
- Table 56: India Postoperative Pain Medication Industry Volume (K Unit) Forecast, by Application 2020 & 2033
- Table 57: Australia Postoperative Pain Medication Industry Revenue (Million) Forecast, by Application 2020 & 2033
- Table 58: Australia Postoperative Pain Medication Industry Volume (K Unit) Forecast, by Application 2020 & 2033
- Table 59: South Korea Postoperative Pain Medication Industry Revenue (Million) Forecast, by Application 2020 & 2033
- Table 60: South Korea Postoperative Pain Medication Industry Volume (K Unit) Forecast, by Application 2020 & 2033
- Table 61: Rest of Asia Pacific Postoperative Pain Medication Industry Revenue (Million) Forecast, by Application 2020 & 2033
- Table 62: Rest of Asia Pacific Postoperative Pain Medication Industry Volume (K Unit) Forecast, by Application 2020 & 2033
- Table 63: Global Postoperative Pain Medication Industry Revenue Million Forecast, by Drug Class 2020 & 2033
- Table 64: Global Postoperative Pain Medication Industry Volume K Unit Forecast, by Drug Class 2020 & 2033
- Table 65: Global Postoperative Pain Medication Industry Revenue Million Forecast, by Route of Administration 2020 & 2033
- Table 66: Global Postoperative Pain Medication Industry Volume K Unit Forecast, by Route of Administration 2020 & 2033
- Table 67: Global Postoperative Pain Medication Industry Revenue Million Forecast, by Distribution Channel 2020 & 2033
- Table 68: Global Postoperative Pain Medication Industry Volume K Unit Forecast, by Distribution Channel 2020 & 2033
- Table 69: Global Postoperative Pain Medication Industry Revenue Million Forecast, by Country 2020 & 2033
- Table 70: Global Postoperative Pain Medication Industry Volume K Unit Forecast, by Country 2020 & 2033
- Table 71: GCC Postoperative Pain Medication Industry Revenue (Million) Forecast, by Application 2020 & 2033
- Table 72: GCC Postoperative Pain Medication Industry Volume (K Unit) Forecast, by Application 2020 & 2033
- Table 73: South Africa Postoperative Pain Medication Industry Revenue (Million) Forecast, by Application 2020 & 2033
- Table 74: South Africa Postoperative Pain Medication Industry Volume (K Unit) Forecast, by Application 2020 & 2033
- Table 75: Rest of Middle East and Africa Postoperative Pain Medication Industry Revenue (Million) Forecast, by Application 2020 & 2033
- Table 76: Rest of Middle East and Africa Postoperative Pain Medication Industry Volume (K Unit) Forecast, by Application 2020 & 2033
- Table 77: Global Postoperative Pain Medication Industry Revenue Million Forecast, by Drug Class 2020 & 2033
- Table 78: Global Postoperative Pain Medication Industry Volume K Unit Forecast, by Drug Class 2020 & 2033
- Table 79: Global Postoperative Pain Medication Industry Revenue Million Forecast, by Route of Administration 2020 & 2033
- Table 80: Global Postoperative Pain Medication Industry Volume K Unit Forecast, by Route of Administration 2020 & 2033
- Table 81: Global Postoperative Pain Medication Industry Revenue Million Forecast, by Distribution Channel 2020 & 2033
- Table 82: Global Postoperative Pain Medication Industry Volume K Unit Forecast, by Distribution Channel 2020 & 2033
- Table 83: Global Postoperative Pain Medication Industry Revenue Million Forecast, by Country 2020 & 2033
- Table 84: Global Postoperative Pain Medication Industry Volume K Unit Forecast, by Country 2020 & 2033
- Table 85: Brazil Postoperative Pain Medication Industry Revenue (Million) Forecast, by Application 2020 & 2033
- Table 86: Brazil Postoperative Pain Medication Industry Volume (K Unit) Forecast, by Application 2020 & 2033
- Table 87: Argentina Postoperative Pain Medication Industry Revenue (Million) Forecast, by Application 2020 & 2033
- Table 88: Argentina Postoperative Pain Medication Industry Volume (K Unit) Forecast, by Application 2020 & 2033
- Table 89: Rest of South America Postoperative Pain Medication Industry Revenue (Million) Forecast, by Application 2020 & 2033
- Table 90: Rest of South America Postoperative Pain Medication Industry Volume (K Unit) Forecast, by Application 2020 & 2033
Frequently Asked Questions
1. What is the projected Compound Annual Growth Rate (CAGR) of the Postoperative Pain Medication Industry?
The projected CAGR is approximately 5.79%.
2. Which companies are prominent players in the Postoperative Pain Medication Industry?
Key companies in the market include Innocoll, Bayer AG, Johnson & Johnson (Janssen Pharmaceuticals), Cali Biosciences, Alembic Pharmaceuticals, AFT Pharmaceuticals, SiteOne Therapeutics, Pfizer Inc , Haleon PLC (GSK), AbbVie (Allergan), Cipla Inc (InvaGen Pharmaceuticals Inc ), Heron Therapeutics, Pacira Pharmaceuticals Inc.
3. What are the main segments of the Postoperative Pain Medication Industry?
The market segments include Drug Class, Route of Administration, Distribution Channel.
4. Can you provide details about the market size?
The market size is estimated to be USD 40.46 Million as of 2022.
5. What are some drivers contributing to market growth?
Growing Number of Surgical Procedures; Increasing Demand for Non-Opioid Based Anaelgesics; Increasing Focus Towards Palliative Care.
6. What are the notable trends driving market growth?
Non-steroidal anti-inflammatory drugs (NSAIDs) Segment is Expected to Hold a Significant Share in the Postoperative Pain Management Market.
7. Are there any restraints impacting market growth?
Concerns Pertaining to the Overuse of Opioids.
8. Can you provide examples of recent developments in the market?
April 2023: Cali Biosciences Co., Ltd. initiated Phase III studies of its core product, CPL-01 (long-acting ropivacaine), with dosing in hernia patients already begun and dosing in bunion patients scheduled to start next month.
9. What pricing options are available for accessing the report?
Pricing options include single-user, multi-user, and enterprise licenses priced at USD 4750, USD 5250, and USD 8750 respectively.
10. Is the market size provided in terms of value or volume?
The market size is provided in terms of value, measured in Million and volume, measured in K Unit.
11. Are there any specific market keywords associated with the report?
Yes, the market keyword associated with the report is "Postoperative Pain Medication Industry," which aids in identifying and referencing the specific market segment covered.
12. How do I determine which pricing option suits my needs best?
The pricing options vary based on user requirements and access needs. Individual users may opt for single-user licenses, while businesses requiring broader access may choose multi-user or enterprise licenses for cost-effective access to the report.
13. Are there any additional resources or data provided in the Postoperative Pain Medication Industry report?
While the report offers comprehensive insights, it's advisable to review the specific contents or supplementary materials provided to ascertain if additional resources or data are available.
14. How can I stay updated on further developments or reports in the Postoperative Pain Medication Industry?
To stay informed about further developments, trends, and reports in the Postoperative Pain Medication Industry, consider subscribing to industry newsletters, following relevant companies and organizations, or regularly checking reputable industry news sources and publications.
Methodology
Step 1 - Identification of Relevant Samples Size from Population Database


Step 2 - Approaches for Defining Global Market Size (Value, Volume* & Price*)

Note*: In applicable scenarios
Step 3 - Data Sources
Primary Research
- Web Analytics
- Survey Reports
- Research Institute
- Latest Research Reports
- Opinion Leaders
Secondary Research
- Annual Reports
- White Paper
- Latest Press Release
- Industry Association
- Paid Database
- Investor Presentations

Step 4 - Data Triangulation
Involves using different sources of information in order to increase the validity of a study
These sources are likely to be stakeholders in a program - participants, other researchers, program staff, other community members, and so on.
Then we put all data in single framework & apply various statistical tools to find out the dynamic on the market.
During the analysis stage, feedback from the stakeholder groups would be compared to determine areas of agreement as well as areas of divergence