

Key Insights
The Asia-Pacific Acute Myeloid Leukemia (AML) Treatment market is poised for robust expansion, projected to reach USD 338.96 Million by 2025 and expand at a significant CAGR of 6.46% throughout the forecast period. This growth is propelled by a confluence of escalating cancer incidence rates, advancements in therapeutic modalities, and increasing healthcare expenditure across the region. The market is characterized by a dynamic segmentation, with chemotherapy, particularly anthracycline drugs, alkylating agents, and anti-metabolites, forming a substantial portion of current treatments. However, the growing adoption of targeted therapies and the potential of stem cell transplants are key emerging trends that will shape the future treatment landscape. The increasing awareness and early diagnosis of AML, coupled with the introduction of novel and more effective treatment options, are expected to further fuel market growth. Additionally, government initiatives aimed at improving cancer care infrastructure and accessibility are contributing to a more favorable market environment.
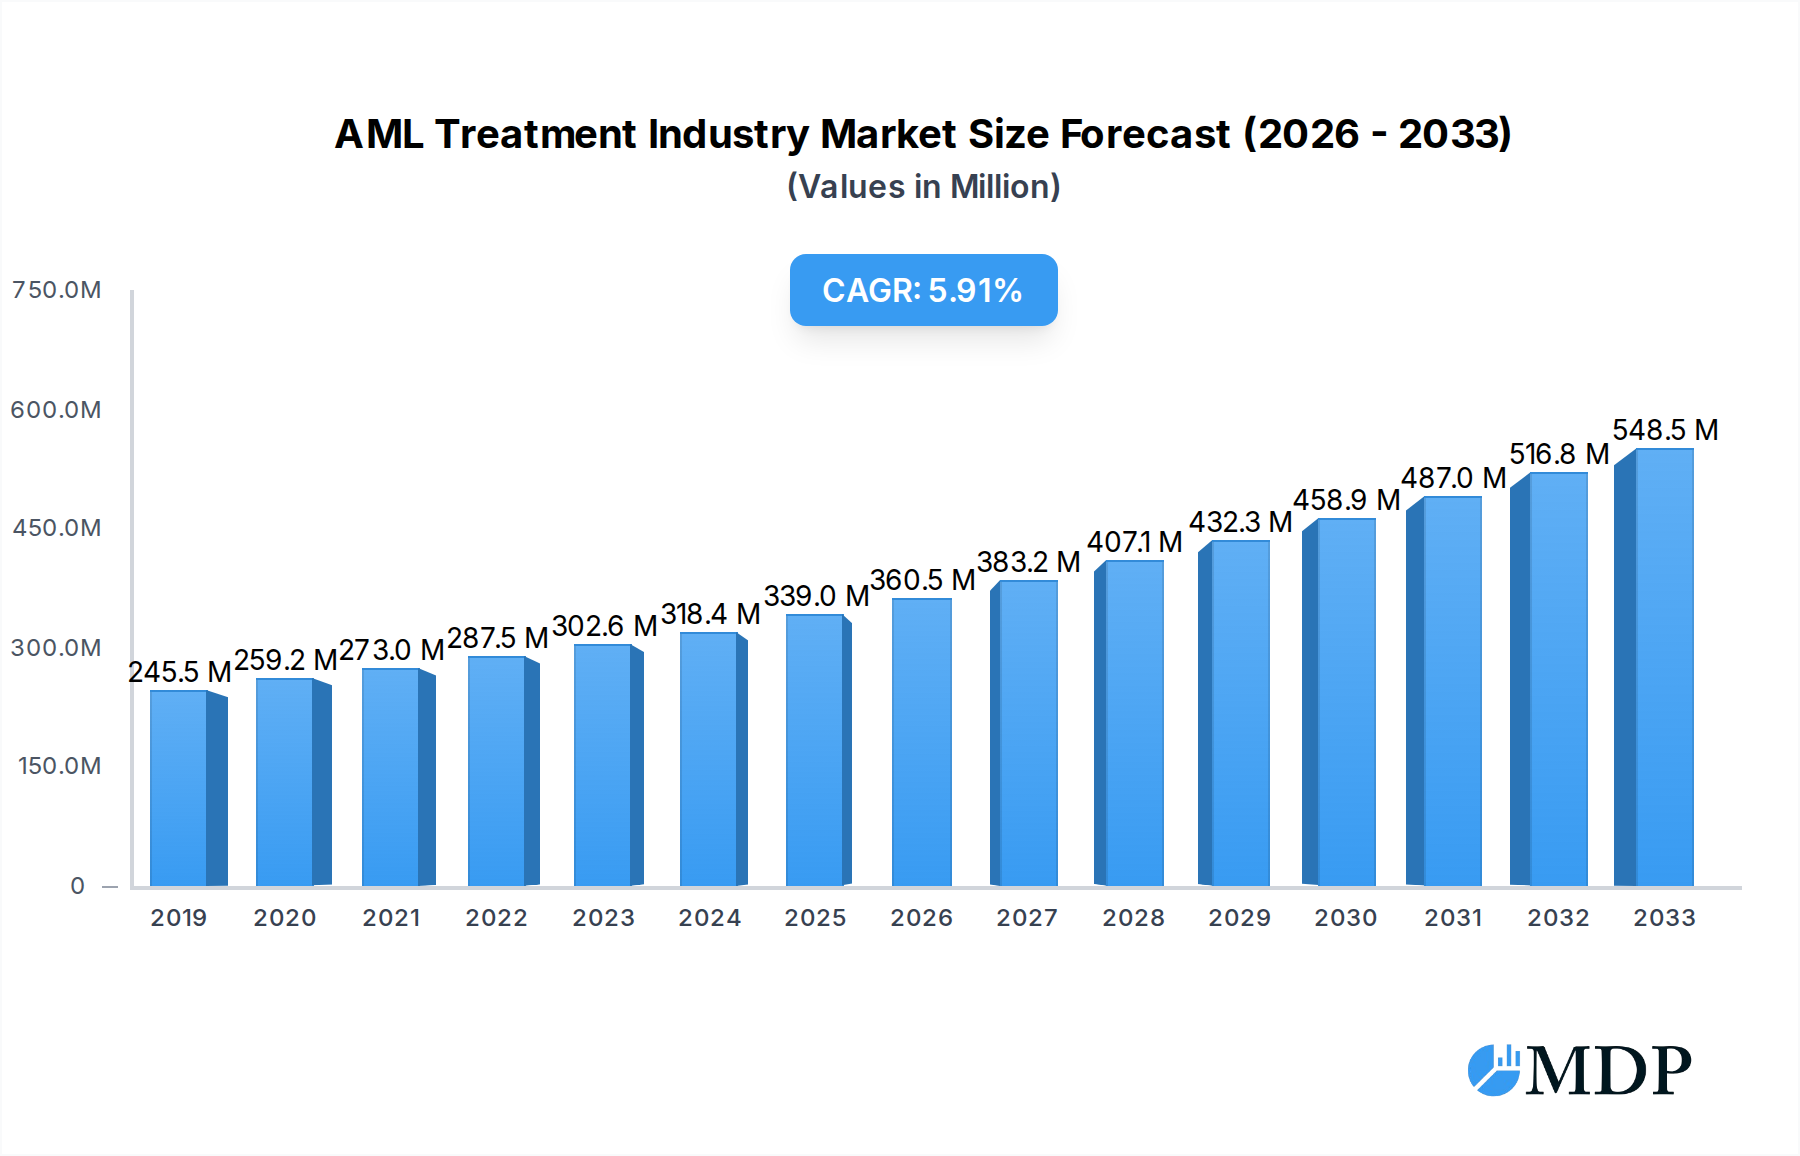
AML Treatment Industry Market Size (In Million)
The competitive landscape is populated by prominent global pharmaceutical players, including Daiichi Sankyo, Celgene, Novartis, and Pfizer, alongside burgeoning regional companies. These entities are actively engaged in research and development to introduce innovative therapies and expand their market reach. Restraints such as the high cost of advanced treatments and the potential for treatment resistance are being addressed through continuous innovation and a focus on personalized medicine approaches. China and India are anticipated to be significant growth drivers within the Asia-Pacific region due to their large populations and increasing focus on healthcare development. Japan and South Korea, with their advanced healthcare systems and R&D capabilities, will also play crucial roles. The evolving treatment paradigms, moving towards more targeted and less toxic therapies, alongside an increasing demand for effective AML management solutions, will continue to define the trajectory of this vital market.

AML Treatment Industry Company Market Share
Unlock critical insights into the rapidly evolving Acute Myeloid Leukemia (AML) treatment market with this in-depth industry report. Covering the historical period of 2019–2024, the base year of 2025, and a robust forecast period extending to 2033, this report provides a definitive analysis of market dynamics, leading players, product innovations, and emerging opportunities. Essential for pharmaceutical companies, healthcare providers, investors, and researchers seeking to understand and capitalize on the AML treatment market size, leukemia drug market, and hematology oncology market. This report features a detailed breakdown of the AML treatment market share, cancer therapy market, and targeted cancer therapy market in the Asia-Pacific region, including key markets like China, Japan, India, Australia, and South Korea.
AML Treatment Industry Market Dynamics & Concentration
The AML treatment industry exhibits a moderate market concentration, with a significant presence of both large pharmaceutical giants and specialized biotechnology firms. Innovation drivers are primarily fueled by advancements in targeted AML therapies, immunotherapies for leukemia, and the development of novel drug delivery systems. Regulatory frameworks, particularly stringent in regions like Japan and South Korea, play a crucial role in market access and drug approvals, influencing market entry strategies for new AML drugs. Product substitutes, while present, are increasingly being outpaced by the efficacy of advanced treatments, especially in cases of relapsed or refractory AML. End-user trends indicate a growing demand for personalized medicine and less toxic treatment options, pushing for innovation in chemotherapy for AML and stem cell transplant for leukemia. Merger and acquisition (M&A) activities are moderately prevalent, with an estimated XX deal counts during the historical period, indicating a strategic consolidation of R&D capabilities and market reach. Key players are investing heavily in pipeline development to secure AML treatment market share.
AML Treatment Industry Industry Trends & Analysis
The AML treatment industry is poised for substantial growth, driven by an increasing global incidence of leukemia and a rising emphasis on early diagnosis and advanced treatment modalities. The global AML market is projected to witness a Compound Annual Growth Rate (CAGR) of approximately X.XX% between 2025 and 2033. This growth is significantly propelled by technological disruptions, including breakthroughs in genetic sequencing for personalized treatment selection and the development of novel AML targeted therapies such as FLT3 inhibitors and IDH inhibitors. Consumer preferences are shifting towards therapies with improved quality of life and reduced side effects, creating a strong demand for next-generation AML treatments and supportive care. Competitive dynamics are intensifying, characterized by aggressive R&D investment, strategic partnerships, and patent expirations of older chemotherapy drugs for leukemia. Market penetration of innovative therapies is expected to rise as healthcare systems adapt to incorporating more advanced and often higher-cost treatment options, influencing the overall oncology drug market. The demand for hematologic malignancy treatments is set to expand with improved survival rates and longer remission periods achieved by modern interventions. The market penetration for targeted therapies is growing as their efficacy and reduced toxicity become more evident compared to traditional chemotherapy regimens for certain AML subtypes. The overall hematology market is experiencing a paradigm shift towards precision medicine.
Leading Markets & Segments in AML Treatment Industry
The Asia-Pacific region is emerging as a dominant force in the AML treatment industry, driven by a confluence of factors including a large and aging population, increasing healthcare expenditure, and a growing awareness of hematological malignancies. Within this dynamic region, China stands out as a leading market due to its vast patient pool and a rapidly expanding healthcare infrastructure focused on advanced cancer care. Japan and South Korea also represent significant markets, characterized by high adoption rates of novel therapies and robust clinical research.
- Dominant Region: Asia-Pacific
- Key Markets: China, Japan, India, Australia, South Korea
Therapy Segment Dominance:
- Targeted Therapy: This segment is experiencing the most rapid growth. The development of precision medicines targeting specific genetic mutations prevalent in AML, such as FLT3, IDH1/2, and NPM1, is revolutionizing treatment protocols.
- Key Drivers: Improved efficacy, reduced systemic toxicity compared to traditional chemotherapy, increasing availability of genetic testing to identify targetable mutations.
- Chemotherapy (Anthracycline Drugs, Alkylating Agents, Anti-metabolites, Other Chemotherapies): While traditional chemotherapy remains a cornerstone of AML treatment, its dominance is gradually being challenged by targeted therapies and immunotherapies. However, combination regimens incorporating these agents with newer drugs are still vital.
- Key Drivers: Established efficacy, cost-effectiveness for certain patient populations, role in induction and consolidation therapy.
- Stem Cell Transplant: Allogeneic stem cell transplantation continues to be a curative option for many AML patients, particularly those with high-risk disease. Advancements in graft-versus-host disease prophylaxis and donor selection are expanding its applicability.
- Key Drivers: Curative potential, established protocols, ongoing research into reducing transplant-related mortality.
- Other Therapies: This includes emerging treatments like immunotherapy (e.g., antibody-drug conjugates, CAR T-cell therapy), which are showing promising results in clinical trials and gaining market approval for specific AML subtypes.
- Key Drivers: Novel mechanisms of action, potential for durable remissions, addressing unmet needs in relapsed/refractory AML.
Geographical Drivers:
- China: Rapidly increasing healthcare investments, growing cancer registries, and a substantial patient population contribute to its market leadership.
- Japan: High prevalence of AML, advanced medical infrastructure, and a proactive approach to adopting new drug technologies.
- India: Growing middle class, increasing access to private healthcare, and a large pool of undiagnosed or undertreated AML cases represent significant growth potential.
- Australia & South Korea: Strong R&D capabilities, well-established healthcare systems, and high adoption of innovative medical technologies.
AML Treatment Industry Product Developments
The AML treatment landscape is continually being reshaped by groundbreaking product developments. Innovations focus on enhancing drug efficacy, minimizing toxicity, and addressing specific molecular targets. Daiichi Sankyo Company Limited and Novartis AG are at the forefront with novel targeted therapies, while Nippon Shinyaku Co., Ltd.'s introduction of Vyxeos Combination exemplifies advancements in liposomal drug delivery for high-risk AML. These developments aim to improve patient outcomes through precision medicine, offering a competitive edge and expanding treatment options beyond conventional chemotherapy. The focus is on therapies that offer durable remissions and improved quality of life for AML patients.
Key Drivers of AML Treatment Industry Growth
The AML treatment industry is propelled by several key drivers. Technological advancements, particularly in genomics and molecular diagnostics, enable more precise identification of AML subtypes and personalized treatment strategies. Increased global incidence of AML, coupled with an aging population, expands the potential patient pool. Favorable regulatory pathways for novel therapies and supportive government initiatives aimed at improving cancer care infrastructure are also significant growth catalysts. Furthermore, ongoing clinical trials and pharmaceutical company investments in R&D for leukemia cancer treatment are consistently introducing more effective and less toxic AML therapies, driving market expansion. The growing awareness and early diagnosis of AML also contribute to increased treatment rates and market demand.
Challenges in the AML Treatment Industry Market
Despite significant progress, the AML treatment industry faces several challenges. The high cost of novel targeted therapies and advanced treatments can be a barrier to accessibility, particularly in resource-limited settings, impacting AML treatment cost dynamics. Stringent and lengthy regulatory approval processes for new drugs, while ensuring safety, can delay market entry. The complexity of AML, with its diverse genetic mutations and potential for resistance, requires continuous innovation and development of combination therapies. Supply chain disruptions and manufacturing complexities for specialized biologics and cell therapies also pose challenges. Furthermore, the competitive landscape, with multiple companies vying for market share, can lead to pricing pressures and the need for sustained R&D investment.
Emerging Opportunities in AML Treatment Industry
Emerging opportunities in the AML treatment industry lie in the continued advancement of immunotherapies for leukemia, including CAR T-cell therapies and bispecific antibodies, which hold promise for durable remissions in challenging cases. The expansion of targeted AML therapies to address a wider range of genetic mutations presents a significant growth avenue. Strategic partnerships between pharmaceutical companies, academic institutions, and diagnostic providers can accelerate drug development and biomarker discovery. Furthermore, the growing demand for home-based AML treatment solutions and digital health platforms for patient monitoring and support offers new avenues for market penetration. Exploring unmet needs in pediatric AML and specific patient subgroups also presents considerable potential for specialized treatment development.
Leading Players in the AML Treatment Industry Sector
- Daiichi Sankyo Company Limited
- Celgene Corporation
- Novartis AG
- Astellas Pharma Inc
- Teva Pharmaceutical Industries Ltd
- AbbVie Inc
- Sun Pharmaceutical Industries Ltd
- Fresenius SE & Co KGaA
- Viatris (Mylan NV)
- Pfizer Inc
Key Milestones in AML Treatment Industry Industry
- May 2024: Nippon Shinyaku Co., Ltd. introduced Vyxeos Combination, an I.V. injection (comprising Daunorubicin hydrochloride and cytarabine in a liposomal formulation), specifically targeting high-risk acute myeloid leukemia (AML) patients in Japan, marking a significant advancement in localized drug delivery for a challenging AML subtype.
- March 2024: Novartis India, the Indian subsidiary of the Swiss pharmaceutical powerhouse Novartis AG, secured a distribution partner for the upcoming launch of Asciminib designed to combat chronic myeloid leukemia (CML) by specifically targeting the ABL myristoyl pocket (STAMP). This strategic move signals a broader market entry strategy for targeted CML therapies in a key emerging market.
Strategic Outlook for AML Treatment Industry Market
The strategic outlook for the AML treatment industry is characterized by sustained innovation and market expansion. Future growth will be fueled by the development of novel targeted therapies and the wider adoption of personalized medicine approaches, driven by advancements in companion diagnostics. Increased investment in R&D for hematologic oncology treatments, coupled with strategic collaborations to accelerate drug development and market access, will be critical. The Asia-Pacific region, particularly China and India, presents significant untapped potential for market growth. Furthermore, a continued focus on improving the efficacy and tolerability of existing treatments through combination therapies and novel formulations will remain a key strategic imperative, ensuring improved patient outcomes and shaping the future of leukemia treatment options.
AML Treatment Industry Segmentation
-
1. Therapy
-
1.1. Chemotherapy
- 1.1.1. Anthracycline Drugs
- 1.1.2. Alkylating Agents
- 1.1.3. Anti-metabolites
- 1.1.4. Other Chemotherapies
- 1.2. Targeted Therapy
- 1.3. Stem Cell Transplant
- 1.4. Other Therapies
-
1.1. Chemotherapy
-
2. Geography
- 2.1. China
- 2.2. Japan
- 2.3. India
- 2.4. Australia
- 2.5. South Korea
- 2.6. Rest of Asia-Pacific
AML Treatment Industry Segmentation By Geography
- 1. China
- 2. Japan
- 3. India
- 4. Australia
- 5. South Korea
- 6. Rest of Asia Pacific
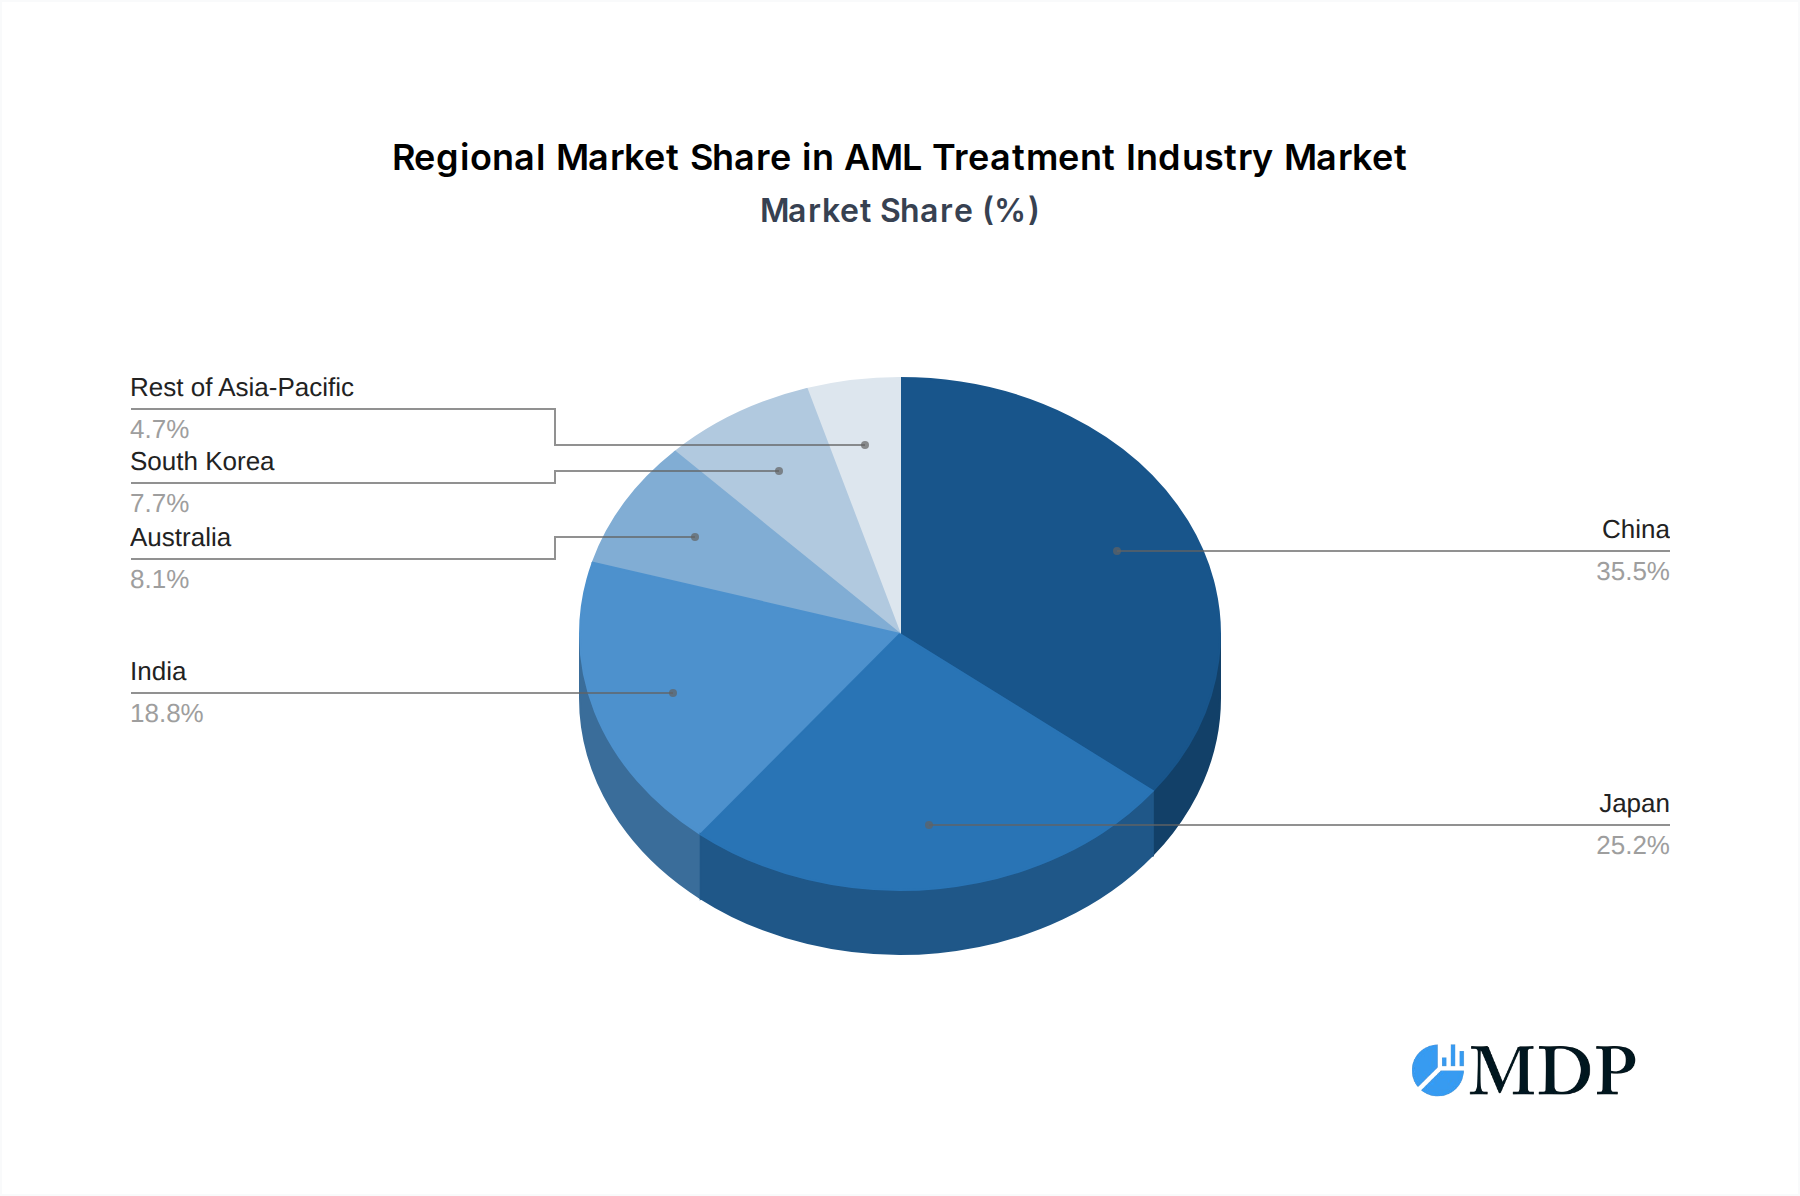
AML Treatment Industry Regional Market Share
Geographic Coverage of AML Treatment Industry
AML Treatment Industry REPORT HIGHLIGHTS
| Aspects | Details |
|---|---|
| Study Period | 2020-2034 |
| Base Year | 2025 |
| Estimated Year | 2026 |
| Forecast Period | 2026-2034 |
| Historical Period | 2020-2025 |
| Growth Rate | CAGR of 6.46% from 2020-2034 |
| Segmentation |
|
Table of Contents
- 1. Introduction
- 1.1. Research Scope
- 1.2. Market Segmentation
- 1.3. Research Objective
- 1.4. Definitions and Assumptions
- 2. Executive Summary
- 2.1. Market Snapshot
- 3. Market Dynamics
- 3.1. Market Drivers
- 3.2. Market Restrains
- 3.3. Market Trends
- 3.4. Market Opportunities
- 4. Market Factor Analysis
- 4.1. Porters Five Forces
- 4.1.1. Bargaining Power of Suppliers
- 4.1.2. Bargaining Power of Buyers
- 4.1.3. Threat of New Entrants
- 4.1.4. Threat of Substitutes
- 4.1.5. Competitive Rivalry
- 4.2. PESTEL analysis
- 4.3. BCG Analysis
- 4.3.1. Stars (High Growth, High Market Share)
- 4.3.2. Cash Cows (Low Growth, High Market Share)
- 4.3.3. Question Mark (High Growth, Low Market Share)
- 4.3.4. Dogs (Low Growth, Low Market Share)
- 4.4. Ansoff Matrix Analysis
- 4.5. Supply Chain Analysis
- 4.6. Regulatory Landscape
- 4.7. Current Market Potential and Opportunity Assessment (TAM–SAM–SOM Framework)
- 4.8. MDP Analyst Note
- 4.1. Porters Five Forces
- 5. Market Analysis, Insights and Forecast 2021-2033
- 5.1. Market Analysis, Insights and Forecast - by Therapy
- 5.1.1. Chemotherapy
- 5.1.1.1. Anthracycline Drugs
- 5.1.1.2. Alkylating Agents
- 5.1.1.3. Anti-metabolites
- 5.1.1.4. Other Chemotherapies
- 5.1.2. Targeted Therapy
- 5.1.3. Stem Cell Transplant
- 5.1.4. Other Therapies
- 5.1.1. Chemotherapy
- 5.2. Market Analysis, Insights and Forecast - by Geography
- 5.2.1. China
- 5.2.2. Japan
- 5.2.3. India
- 5.2.4. Australia
- 5.2.5. South Korea
- 5.2.6. Rest of Asia-Pacific
- 5.3. Market Analysis, Insights and Forecast - by Region
- 5.3.1. China
- 5.3.2. Japan
- 5.3.3. India
- 5.3.4. Australia
- 5.3.5. South Korea
- 5.3.6. Rest of Asia Pacific
- 5.1. Market Analysis, Insights and Forecast - by Therapy
- 6. Global AML Treatment Industry Analysis, Insights and Forecast, 2021-2033
- 6.1. Market Analysis, Insights and Forecast - by Therapy
- 6.1.1. Chemotherapy
- 6.1.1.1. Anthracycline Drugs
- 6.1.1.2. Alkylating Agents
- 6.1.1.3. Anti-metabolites
- 6.1.1.4. Other Chemotherapies
- 6.1.2. Targeted Therapy
- 6.1.3. Stem Cell Transplant
- 6.1.4. Other Therapies
- 6.1.1. Chemotherapy
- 6.2. Market Analysis, Insights and Forecast - by Geography
- 6.2.1. China
- 6.2.2. Japan
- 6.2.3. India
- 6.2.4. Australia
- 6.2.5. South Korea
- 6.2.6. Rest of Asia-Pacific
- 6.1. Market Analysis, Insights and Forecast - by Therapy
- 7. China AML Treatment Industry Analysis, Insights and Forecast, 2020-2032
- 7.1. Market Analysis, Insights and Forecast - by Therapy
- 7.1.1. Chemotherapy
- 7.1.1.1. Anthracycline Drugs
- 7.1.1.2. Alkylating Agents
- 7.1.1.3. Anti-metabolites
- 7.1.1.4. Other Chemotherapies
- 7.1.2. Targeted Therapy
- 7.1.3. Stem Cell Transplant
- 7.1.4. Other Therapies
- 7.1.1. Chemotherapy
- 7.2. Market Analysis, Insights and Forecast - by Geography
- 7.2.1. China
- 7.2.2. Japan
- 7.2.3. India
- 7.2.4. Australia
- 7.2.5. South Korea
- 7.2.6. Rest of Asia-Pacific
- 7.1. Market Analysis, Insights and Forecast - by Therapy
- 8. Japan AML Treatment Industry Analysis, Insights and Forecast, 2020-2032
- 8.1. Market Analysis, Insights and Forecast - by Therapy
- 8.1.1. Chemotherapy
- 8.1.1.1. Anthracycline Drugs
- 8.1.1.2. Alkylating Agents
- 8.1.1.3. Anti-metabolites
- 8.1.1.4. Other Chemotherapies
- 8.1.2. Targeted Therapy
- 8.1.3. Stem Cell Transplant
- 8.1.4. Other Therapies
- 8.1.1. Chemotherapy
- 8.2. Market Analysis, Insights and Forecast - by Geography
- 8.2.1. China
- 8.2.2. Japan
- 8.2.3. India
- 8.2.4. Australia
- 8.2.5. South Korea
- 8.2.6. Rest of Asia-Pacific
- 8.1. Market Analysis, Insights and Forecast - by Therapy
- 9. India AML Treatment Industry Analysis, Insights and Forecast, 2020-2032
- 9.1. Market Analysis, Insights and Forecast - by Therapy
- 9.1.1. Chemotherapy
- 9.1.1.1. Anthracycline Drugs
- 9.1.1.2. Alkylating Agents
- 9.1.1.3. Anti-metabolites
- 9.1.1.4. Other Chemotherapies
- 9.1.2. Targeted Therapy
- 9.1.3. Stem Cell Transplant
- 9.1.4. Other Therapies
- 9.1.1. Chemotherapy
- 9.2. Market Analysis, Insights and Forecast - by Geography
- 9.2.1. China
- 9.2.2. Japan
- 9.2.3. India
- 9.2.4. Australia
- 9.2.5. South Korea
- 9.2.6. Rest of Asia-Pacific
- 9.1. Market Analysis, Insights and Forecast - by Therapy
- 10. Australia AML Treatment Industry Analysis, Insights and Forecast, 2020-2032
- 10.1. Market Analysis, Insights and Forecast - by Therapy
- 10.1.1. Chemotherapy
- 10.1.1.1. Anthracycline Drugs
- 10.1.1.2. Alkylating Agents
- 10.1.1.3. Anti-metabolites
- 10.1.1.4. Other Chemotherapies
- 10.1.2. Targeted Therapy
- 10.1.3. Stem Cell Transplant
- 10.1.4. Other Therapies
- 10.1.1. Chemotherapy
- 10.2. Market Analysis, Insights and Forecast - by Geography
- 10.2.1. China
- 10.2.2. Japan
- 10.2.3. India
- 10.2.4. Australia
- 10.2.5. South Korea
- 10.2.6. Rest of Asia-Pacific
- 10.1. Market Analysis, Insights and Forecast - by Therapy
- 11. South Korea AML Treatment Industry Analysis, Insights and Forecast, 2020-2032
- 11.1. Market Analysis, Insights and Forecast - by Therapy
- 11.1.1. Chemotherapy
- 11.1.1.1. Anthracycline Drugs
- 11.1.1.2. Alkylating Agents
- 11.1.1.3. Anti-metabolites
- 11.1.1.4. Other Chemotherapies
- 11.1.2. Targeted Therapy
- 11.1.3. Stem Cell Transplant
- 11.1.4. Other Therapies
- 11.1.1. Chemotherapy
- 11.2. Market Analysis, Insights and Forecast - by Geography
- 11.2.1. China
- 11.2.2. Japan
- 11.2.3. India
- 11.2.4. Australia
- 11.2.5. South Korea
- 11.2.6. Rest of Asia-Pacific
- 11.1. Market Analysis, Insights and Forecast - by Therapy
- 12. Rest of Asia Pacific AML Treatment Industry Analysis, Insights and Forecast, 2020-2032
- 12.1. Market Analysis, Insights and Forecast - by Therapy
- 12.1.1. Chemotherapy
- 12.1.1.1. Anthracycline Drugs
- 12.1.1.2. Alkylating Agents
- 12.1.1.3. Anti-metabolites
- 12.1.1.4. Other Chemotherapies
- 12.1.2. Targeted Therapy
- 12.1.3. Stem Cell Transplant
- 12.1.4. Other Therapies
- 12.1.1. Chemotherapy
- 12.2. Market Analysis, Insights and Forecast - by Geography
- 12.2.1. China
- 12.2.2. Japan
- 12.2.3. India
- 12.2.4. Australia
- 12.2.5. South Korea
- 12.2.6. Rest of Asia-Pacific
- 12.1. Market Analysis, Insights and Forecast - by Therapy
- 13. Competitive Analysis
- 13.1. Company Profiles
- 13.1.1 Daiichi Sankyo Company Limited
- 13.1.1.1. Company Overview
- 13.1.1.2. Products
- 13.1.1.3. Company Financials
- 13.1.1.4. SWOT Analysis
- 13.1.2 Celgene Corporation
- 13.1.2.1. Company Overview
- 13.1.2.2. Products
- 13.1.2.3. Company Financials
- 13.1.2.4. SWOT Analysis
- 13.1.3 Novartis AG
- 13.1.3.1. Company Overview
- 13.1.3.2. Products
- 13.1.3.3. Company Financials
- 13.1.3.4. SWOT Analysis
- 13.1.4 Astellas Pharma Inc
- 13.1.4.1. Company Overview
- 13.1.4.2. Products
- 13.1.4.3. Company Financials
- 13.1.4.4. SWOT Analysis
- 13.1.5 Teva Pharmaceutical Industries Ltd
- 13.1.5.1. Company Overview
- 13.1.5.2. Products
- 13.1.5.3. Company Financials
- 13.1.5.4. SWOT Analysis
- 13.1.6 AbbVie Inc
- 13.1.6.1. Company Overview
- 13.1.6.2. Products
- 13.1.6.3. Company Financials
- 13.1.6.4. SWOT Analysis
- 13.1.7 Sun Pharmaceutical Industries Ltd
- 13.1.7.1. Company Overview
- 13.1.7.2. Products
- 13.1.7.3. Company Financials
- 13.1.7.4. SWOT Analysis
- 13.1.8 Fresenius SE & Co KGaA
- 13.1.8.1. Company Overview
- 13.1.8.2. Products
- 13.1.8.3. Company Financials
- 13.1.8.4. SWOT Analysis
- 13.1.9 Viatris (Mylan NV)
- 13.1.9.1. Company Overview
- 13.1.9.2. Products
- 13.1.9.3. Company Financials
- 13.1.9.4. SWOT Analysis
- 13.1.10 Pfizer Inc
- 13.1.10.1. Company Overview
- 13.1.10.2. Products
- 13.1.10.3. Company Financials
- 13.1.10.4. SWOT Analysis
- 13.1.1 Daiichi Sankyo Company Limited
- 13.2. Market Entropy
- 13.2.1 Company's Key Areas Served
- 13.2.2 Recent Developments
- 13.3. Company Market Share Analysis 2025
- 13.3.1 Top 5 Companies Market Share Analysis
- 13.3.2 Top 3 Companies Market Share Analysis
- 13.4. List of Potential Customers
- 14. Research Methodology
List of Figures
- Figure 1: Global AML Treatment Industry Revenue Breakdown (Million, %) by Region 2025 & 2033
- Figure 2: Global AML Treatment Industry Volume Breakdown (K Unit, %) by Region 2025 & 2033
- Figure 3: China AML Treatment Industry Revenue (Million), by Therapy 2025 & 2033
- Figure 4: China AML Treatment Industry Volume (K Unit), by Therapy 2025 & 2033
- Figure 5: China AML Treatment Industry Revenue Share (%), by Therapy 2025 & 2033
- Figure 6: China AML Treatment Industry Volume Share (%), by Therapy 2025 & 2033
- Figure 7: China AML Treatment Industry Revenue (Million), by Geography 2025 & 2033
- Figure 8: China AML Treatment Industry Volume (K Unit), by Geography 2025 & 2033
- Figure 9: China AML Treatment Industry Revenue Share (%), by Geography 2025 & 2033
- Figure 10: China AML Treatment Industry Volume Share (%), by Geography 2025 & 2033
- Figure 11: China AML Treatment Industry Revenue (Million), by Country 2025 & 2033
- Figure 12: China AML Treatment Industry Volume (K Unit), by Country 2025 & 2033
- Figure 13: China AML Treatment Industry Revenue Share (%), by Country 2025 & 2033
- Figure 14: China AML Treatment Industry Volume Share (%), by Country 2025 & 2033
- Figure 15: Japan AML Treatment Industry Revenue (Million), by Therapy 2025 & 2033
- Figure 16: Japan AML Treatment Industry Volume (K Unit), by Therapy 2025 & 2033
- Figure 17: Japan AML Treatment Industry Revenue Share (%), by Therapy 2025 & 2033
- Figure 18: Japan AML Treatment Industry Volume Share (%), by Therapy 2025 & 2033
- Figure 19: Japan AML Treatment Industry Revenue (Million), by Geography 2025 & 2033
- Figure 20: Japan AML Treatment Industry Volume (K Unit), by Geography 2025 & 2033
- Figure 21: Japan AML Treatment Industry Revenue Share (%), by Geography 2025 & 2033
- Figure 22: Japan AML Treatment Industry Volume Share (%), by Geography 2025 & 2033
- Figure 23: Japan AML Treatment Industry Revenue (Million), by Country 2025 & 2033
- Figure 24: Japan AML Treatment Industry Volume (K Unit), by Country 2025 & 2033
- Figure 25: Japan AML Treatment Industry Revenue Share (%), by Country 2025 & 2033
- Figure 26: Japan AML Treatment Industry Volume Share (%), by Country 2025 & 2033
- Figure 27: India AML Treatment Industry Revenue (Million), by Therapy 2025 & 2033
- Figure 28: India AML Treatment Industry Volume (K Unit), by Therapy 2025 & 2033
- Figure 29: India AML Treatment Industry Revenue Share (%), by Therapy 2025 & 2033
- Figure 30: India AML Treatment Industry Volume Share (%), by Therapy 2025 & 2033
- Figure 31: India AML Treatment Industry Revenue (Million), by Geography 2025 & 2033
- Figure 32: India AML Treatment Industry Volume (K Unit), by Geography 2025 & 2033
- Figure 33: India AML Treatment Industry Revenue Share (%), by Geography 2025 & 2033
- Figure 34: India AML Treatment Industry Volume Share (%), by Geography 2025 & 2033
- Figure 35: India AML Treatment Industry Revenue (Million), by Country 2025 & 2033
- Figure 36: India AML Treatment Industry Volume (K Unit), by Country 2025 & 2033
- Figure 37: India AML Treatment Industry Revenue Share (%), by Country 2025 & 2033
- Figure 38: India AML Treatment Industry Volume Share (%), by Country 2025 & 2033
- Figure 39: Australia AML Treatment Industry Revenue (Million), by Therapy 2025 & 2033
- Figure 40: Australia AML Treatment Industry Volume (K Unit), by Therapy 2025 & 2033
- Figure 41: Australia AML Treatment Industry Revenue Share (%), by Therapy 2025 & 2033
- Figure 42: Australia AML Treatment Industry Volume Share (%), by Therapy 2025 & 2033
- Figure 43: Australia AML Treatment Industry Revenue (Million), by Geography 2025 & 2033
- Figure 44: Australia AML Treatment Industry Volume (K Unit), by Geography 2025 & 2033
- Figure 45: Australia AML Treatment Industry Revenue Share (%), by Geography 2025 & 2033
- Figure 46: Australia AML Treatment Industry Volume Share (%), by Geography 2025 & 2033
- Figure 47: Australia AML Treatment Industry Revenue (Million), by Country 2025 & 2033
- Figure 48: Australia AML Treatment Industry Volume (K Unit), by Country 2025 & 2033
- Figure 49: Australia AML Treatment Industry Revenue Share (%), by Country 2025 & 2033
- Figure 50: Australia AML Treatment Industry Volume Share (%), by Country 2025 & 2033
- Figure 51: South Korea AML Treatment Industry Revenue (Million), by Therapy 2025 & 2033
- Figure 52: South Korea AML Treatment Industry Volume (K Unit), by Therapy 2025 & 2033
- Figure 53: South Korea AML Treatment Industry Revenue Share (%), by Therapy 2025 & 2033
- Figure 54: South Korea AML Treatment Industry Volume Share (%), by Therapy 2025 & 2033
- Figure 55: South Korea AML Treatment Industry Revenue (Million), by Geography 2025 & 2033
- Figure 56: South Korea AML Treatment Industry Volume (K Unit), by Geography 2025 & 2033
- Figure 57: South Korea AML Treatment Industry Revenue Share (%), by Geography 2025 & 2033
- Figure 58: South Korea AML Treatment Industry Volume Share (%), by Geography 2025 & 2033
- Figure 59: South Korea AML Treatment Industry Revenue (Million), by Country 2025 & 2033
- Figure 60: South Korea AML Treatment Industry Volume (K Unit), by Country 2025 & 2033
- Figure 61: South Korea AML Treatment Industry Revenue Share (%), by Country 2025 & 2033
- Figure 62: South Korea AML Treatment Industry Volume Share (%), by Country 2025 & 2033
- Figure 63: Rest of Asia Pacific AML Treatment Industry Revenue (Million), by Therapy 2025 & 2033
- Figure 64: Rest of Asia Pacific AML Treatment Industry Volume (K Unit), by Therapy 2025 & 2033
- Figure 65: Rest of Asia Pacific AML Treatment Industry Revenue Share (%), by Therapy 2025 & 2033
- Figure 66: Rest of Asia Pacific AML Treatment Industry Volume Share (%), by Therapy 2025 & 2033
- Figure 67: Rest of Asia Pacific AML Treatment Industry Revenue (Million), by Geography 2025 & 2033
- Figure 68: Rest of Asia Pacific AML Treatment Industry Volume (K Unit), by Geography 2025 & 2033
- Figure 69: Rest of Asia Pacific AML Treatment Industry Revenue Share (%), by Geography 2025 & 2033
- Figure 70: Rest of Asia Pacific AML Treatment Industry Volume Share (%), by Geography 2025 & 2033
- Figure 71: Rest of Asia Pacific AML Treatment Industry Revenue (Million), by Country 2025 & 2033
- Figure 72: Rest of Asia Pacific AML Treatment Industry Volume (K Unit), by Country 2025 & 2033
- Figure 73: Rest of Asia Pacific AML Treatment Industry Revenue Share (%), by Country 2025 & 2033
- Figure 74: Rest of Asia Pacific AML Treatment Industry Volume Share (%), by Country 2025 & 2033
List of Tables
- Table 1: Global AML Treatment Industry Revenue Million Forecast, by Therapy 2020 & 2033
- Table 2: Global AML Treatment Industry Volume K Unit Forecast, by Therapy 2020 & 2033
- Table 3: Global AML Treatment Industry Revenue Million Forecast, by Geography 2020 & 2033
- Table 4: Global AML Treatment Industry Volume K Unit Forecast, by Geography 2020 & 2033
- Table 5: Global AML Treatment Industry Revenue Million Forecast, by Region 2020 & 2033
- Table 6: Global AML Treatment Industry Volume K Unit Forecast, by Region 2020 & 2033
- Table 7: Global AML Treatment Industry Revenue Million Forecast, by Therapy 2020 & 2033
- Table 8: Global AML Treatment Industry Volume K Unit Forecast, by Therapy 2020 & 2033
- Table 9: Global AML Treatment Industry Revenue Million Forecast, by Geography 2020 & 2033
- Table 10: Global AML Treatment Industry Volume K Unit Forecast, by Geography 2020 & 2033
- Table 11: Global AML Treatment Industry Revenue Million Forecast, by Country 2020 & 2033
- Table 12: Global AML Treatment Industry Volume K Unit Forecast, by Country 2020 & 2033
- Table 13: Global AML Treatment Industry Revenue Million Forecast, by Therapy 2020 & 2033
- Table 14: Global AML Treatment Industry Volume K Unit Forecast, by Therapy 2020 & 2033
- Table 15: Global AML Treatment Industry Revenue Million Forecast, by Geography 2020 & 2033
- Table 16: Global AML Treatment Industry Volume K Unit Forecast, by Geography 2020 & 2033
- Table 17: Global AML Treatment Industry Revenue Million Forecast, by Country 2020 & 2033
- Table 18: Global AML Treatment Industry Volume K Unit Forecast, by Country 2020 & 2033
- Table 19: Global AML Treatment Industry Revenue Million Forecast, by Therapy 2020 & 2033
- Table 20: Global AML Treatment Industry Volume K Unit Forecast, by Therapy 2020 & 2033
- Table 21: Global AML Treatment Industry Revenue Million Forecast, by Geography 2020 & 2033
- Table 22: Global AML Treatment Industry Volume K Unit Forecast, by Geography 2020 & 2033
- Table 23: Global AML Treatment Industry Revenue Million Forecast, by Country 2020 & 2033
- Table 24: Global AML Treatment Industry Volume K Unit Forecast, by Country 2020 & 2033
- Table 25: Global AML Treatment Industry Revenue Million Forecast, by Therapy 2020 & 2033
- Table 26: Global AML Treatment Industry Volume K Unit Forecast, by Therapy 2020 & 2033
- Table 27: Global AML Treatment Industry Revenue Million Forecast, by Geography 2020 & 2033
- Table 28: Global AML Treatment Industry Volume K Unit Forecast, by Geography 2020 & 2033
- Table 29: Global AML Treatment Industry Revenue Million Forecast, by Country 2020 & 2033
- Table 30: Global AML Treatment Industry Volume K Unit Forecast, by Country 2020 & 2033
- Table 31: Global AML Treatment Industry Revenue Million Forecast, by Therapy 2020 & 2033
- Table 32: Global AML Treatment Industry Volume K Unit Forecast, by Therapy 2020 & 2033
- Table 33: Global AML Treatment Industry Revenue Million Forecast, by Geography 2020 & 2033
- Table 34: Global AML Treatment Industry Volume K Unit Forecast, by Geography 2020 & 2033
- Table 35: Global AML Treatment Industry Revenue Million Forecast, by Country 2020 & 2033
- Table 36: Global AML Treatment Industry Volume K Unit Forecast, by Country 2020 & 2033
- Table 37: Global AML Treatment Industry Revenue Million Forecast, by Therapy 2020 & 2033
- Table 38: Global AML Treatment Industry Volume K Unit Forecast, by Therapy 2020 & 2033
- Table 39: Global AML Treatment Industry Revenue Million Forecast, by Geography 2020 & 2033
- Table 40: Global AML Treatment Industry Volume K Unit Forecast, by Geography 2020 & 2033
- Table 41: Global AML Treatment Industry Revenue Million Forecast, by Country 2020 & 2033
- Table 42: Global AML Treatment Industry Volume K Unit Forecast, by Country 2020 & 2033
Frequently Asked Questions
1. What is the projected Compound Annual Growth Rate (CAGR) of the AML Treatment Industry?
The projected CAGR is approximately 6.46%.
2. Which companies are prominent players in the AML Treatment Industry?
Key companies in the market include Daiichi Sankyo Company Limited, Celgene Corporation, Novartis AG, Astellas Pharma Inc, Teva Pharmaceutical Industries Ltd, AbbVie Inc, Sun Pharmaceutical Industries Ltd, Fresenius SE & Co KGaA, Viatris (Mylan NV), Pfizer Inc.
3. What are the main segments of the AML Treatment Industry?
The market segments include Therapy, Geography.
4. Can you provide details about the market size?
The market size is estimated to be USD 338.96 Million as of 2022.
5. What are some drivers contributing to market growth?
High Incidence and Prevalence of Acute Myeloid Leukemia; Advancement in Pharmacology and Molecular Biology to Promote Drug Development.
6. What are the notable trends driving market growth?
The Chemotherapy Segment is Anticipated to Witness a Growth Over the Forecast Period.
7. Are there any restraints impacting market growth?
Complications Related to Chemotherapy.
8. Can you provide examples of recent developments in the market?
May 2024 : Nippon Shinyaku Co., Ltd. introduced Vyxeos Combination, an I.V. injection (comprising Daunorubicin hydrochloride and cytarabine in a liposomal formulation), specifically targeting high-risk acute myeloid leukemia (AML) patients in Japan.
9. What pricing options are available for accessing the report?
Pricing options include single-user, multi-user, and enterprise licenses priced at USD 4750, USD 5250, and USD 8750 respectively.
10. Is the market size provided in terms of value or volume?
The market size is provided in terms of value, measured in Million and volume, measured in K Unit.
11. Are there any specific market keywords associated with the report?
Yes, the market keyword associated with the report is "AML Treatment Industry," which aids in identifying and referencing the specific market segment covered.
12. How do I determine which pricing option suits my needs best?
The pricing options vary based on user requirements and access needs. Individual users may opt for single-user licenses, while businesses requiring broader access may choose multi-user or enterprise licenses for cost-effective access to the report.
13. Are there any additional resources or data provided in the AML Treatment Industry report?
While the report offers comprehensive insights, it's advisable to review the specific contents or supplementary materials provided to ascertain if additional resources or data are available.
14. How can I stay updated on further developments or reports in the AML Treatment Industry?
To stay informed about further developments, trends, and reports in the AML Treatment Industry, consider subscribing to industry newsletters, following relevant companies and organizations, or regularly checking reputable industry news sources and publications.
Methodology
Step 1 - Identification of Relevant Samples Size from Population Database


Step 2 - Approaches for Defining Global Market Size (Value, Volume* & Price*)

Note*: In applicable scenarios
Step 3 - Data Sources
Primary Research
- Web Analytics
- Survey Reports
- Research Institute
- Latest Research Reports
- Opinion Leaders
Secondary Research
- Annual Reports
- White Paper
- Latest Press Release
- Industry Association
- Paid Database
- Investor Presentations

Step 4 - Data Triangulation
Involves using different sources of information in order to increase the validity of a study
These sources are likely to be stakeholders in a program - participants, other researchers, program staff, other community members, and so on.
Then we put all data in single framework & apply various statistical tools to find out the dynamic on the market.
During the analysis stage, feedback from the stakeholder groups would be compared to determine areas of agreement as well as areas of divergence