

Key Insights
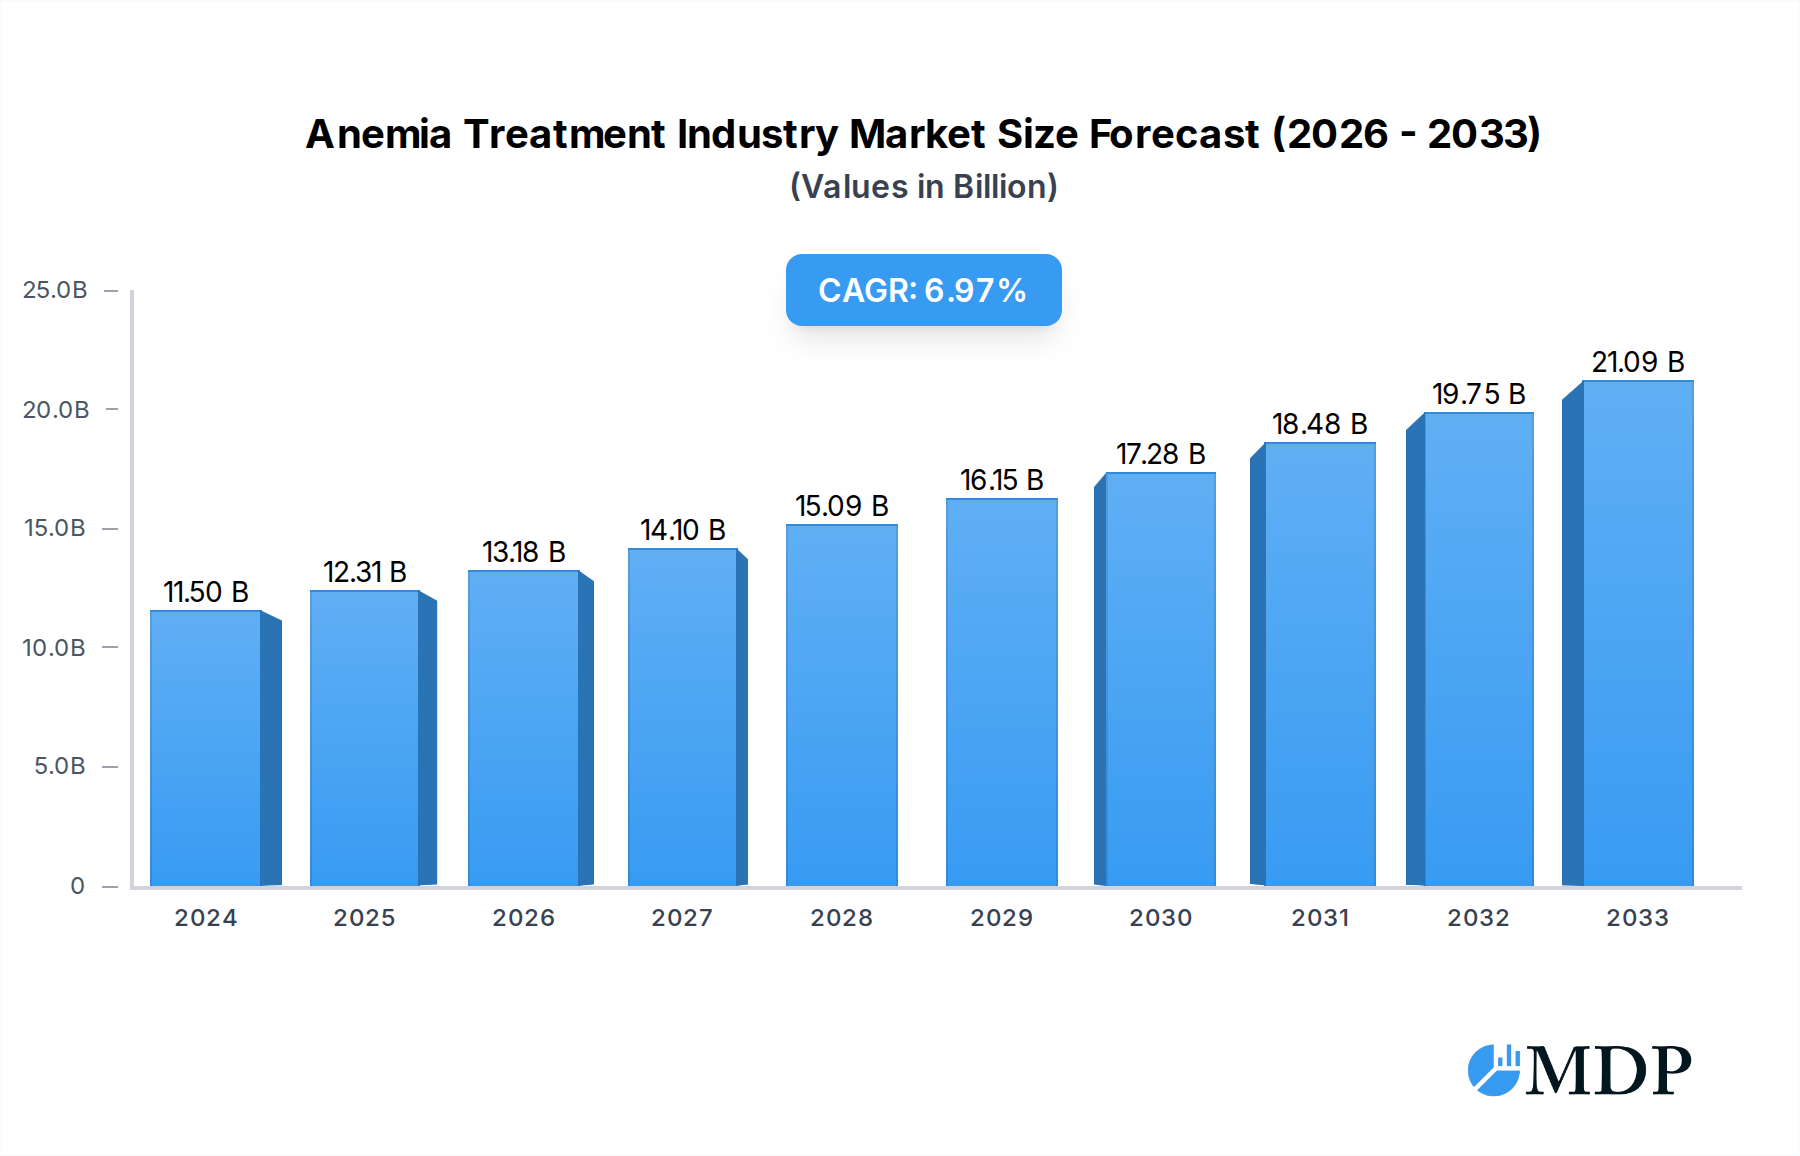
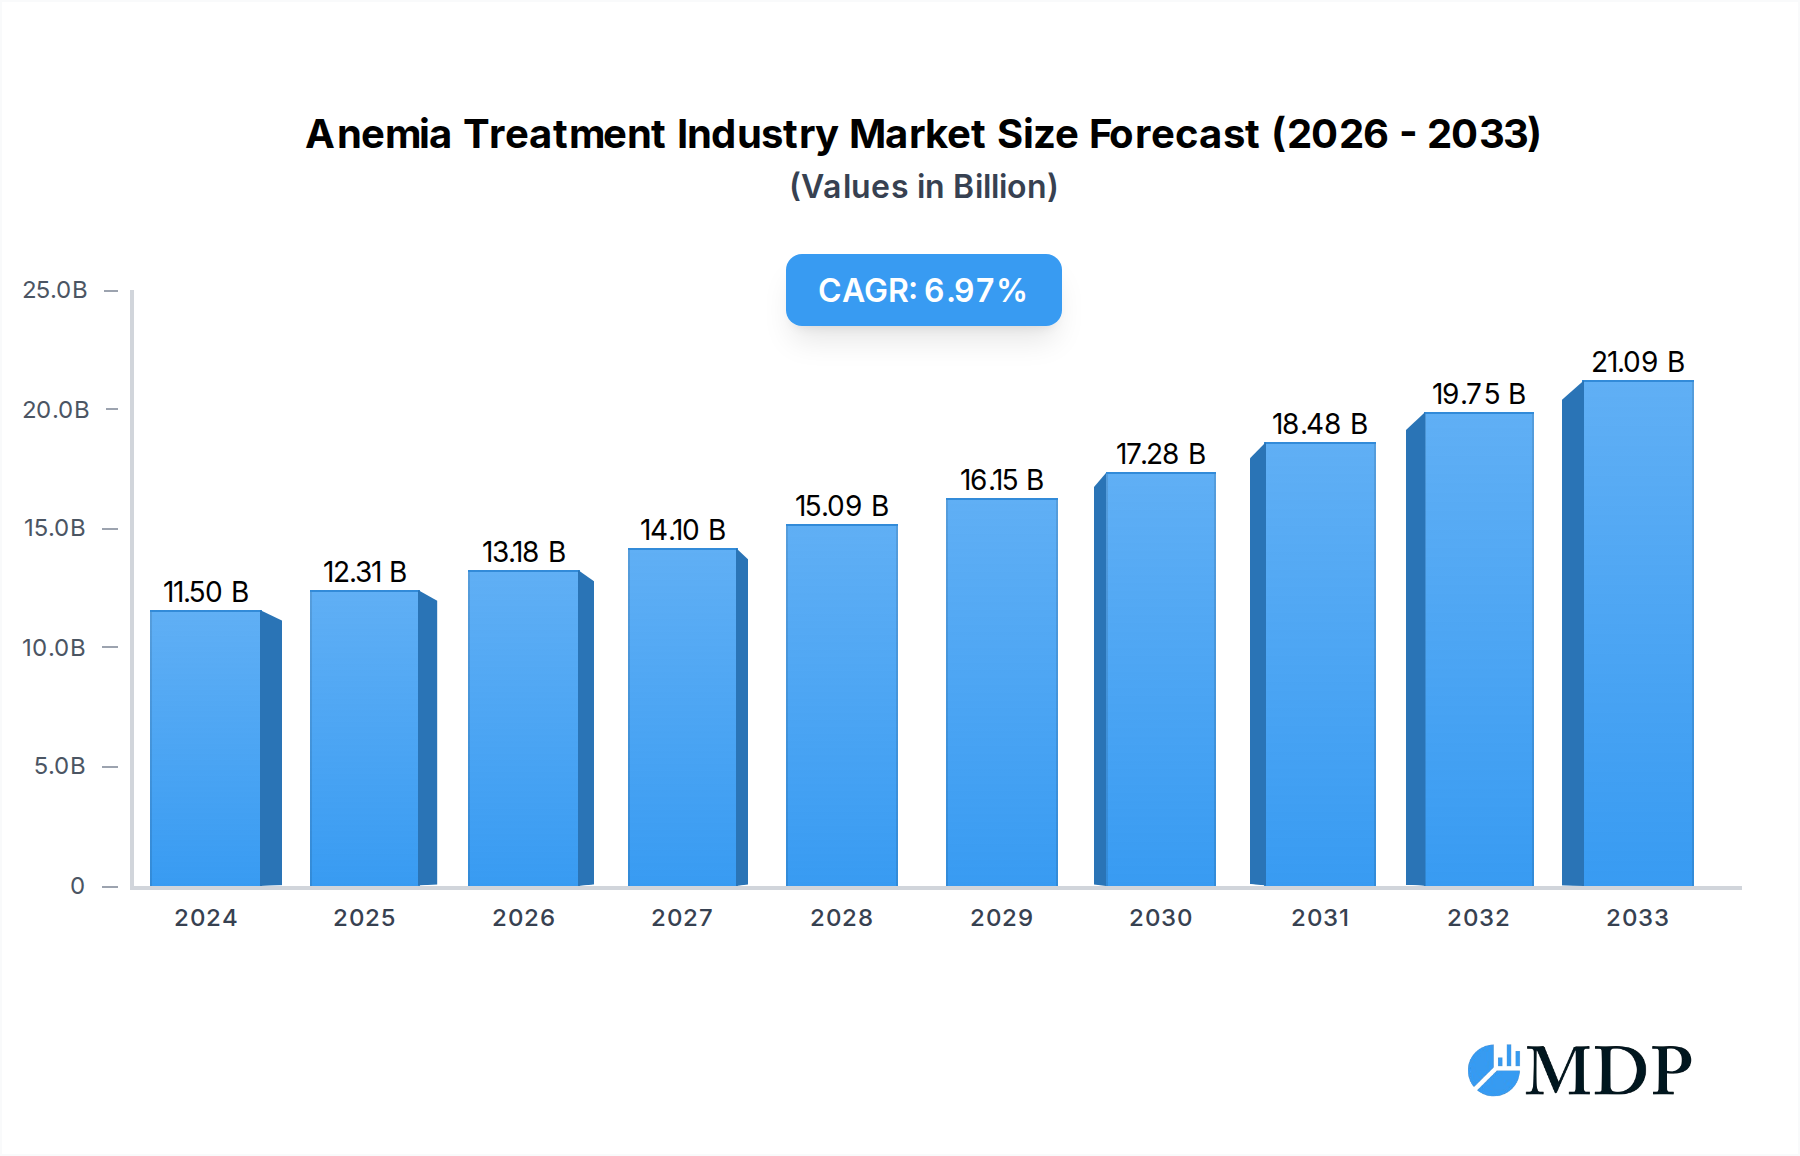
The global Anemia Treatment market is poised for significant expansion, projected to reach $12.31 billion by 2025, with a robust Compound Annual Growth Rate (CAGR) of 7.12%. This impressive growth trajectory is primarily driven by the increasing prevalence of anemia across various patient populations, including those suffering from Iron Deficiency Anemia (IDA), Chronic Kidney Disease (CKD) anemia, and other hematological disorders. Advancements in therapeutic strategies, including the development of novel erythropoiesis-stimulating agents (ESAs), iron supplements, and gene therapies, are further fueling market expansion. The growing awareness among healthcare professionals and patients about the importance of early diagnosis and effective management of anemia is also a key contributing factor. Furthermore, the expanding healthcare infrastructure, particularly in emerging economies, and increasing healthcare expenditure are creating a conducive environment for market growth. The market segmentation by disease type reveals that Iron Deficiency Anemia and CKD-related anemia represent substantial segments due to their widespread occurrence, while emerging treatments for conditions like Sickle Cell Anemia and Aplastic Anemia are expected to witness significant growth.
Anemia Treatment Industry Market Size (In Billion)

Key trends shaping the Anemia Treatment market include the rising adoption of biosimil versions of existing ESAs, offering cost-effective treatment options, and the increasing focus on personalized medicine approaches. The development of oral iron formulations with improved bioavailability and reduced gastrointestinal side effects is also a significant trend. Innovative drug delivery systems and combination therapies are being explored to enhance treatment efficacy and patient compliance. While the market demonstrates strong growth potential, certain restraints such as the high cost of novel therapies and the complexities associated with reimbursement policies in some regions may pose challenges. Additionally, the risk of adverse events associated with some anemia treatments necessitates careful patient monitoring and risk management strategies. Nonetheless, the continuous pipeline of innovative treatments and the unmet medical needs in managing various types of anemia indicate a bright future for the Anemia Treatment industry, with major pharmaceutical players like Sanofi, Pfizer (Global Blood Therapeutics Inc.), and AbbVie Inc. (Allergan Plc) actively investing in research and development to capture a significant share of this expanding market.
Anemia Treatment Industry Company Market Share
Unlocking the Future of Anemia Treatment: A Comprehensive Market Analysis (2019-2033)
This in-depth report provides a definitive analysis of the global Anemia Treatment Industry, projecting significant growth from a market size of $30 billion in 2019 to an estimated $75 billion by 2033. Spanning the historical period of 2019-2024, the base year of 2025, and a comprehensive forecast period from 2025-2033, this report delves into the intricate dynamics shaping the future of anemia therapeutics. We explore market concentration, innovation drivers, regulatory landscapes, and emerging opportunities, offering actionable insights for pharmaceutical companies, biotech innovators, investors, and healthcare providers. Discover the key trends, leading market segments, and strategic imperatives required to navigate this rapidly evolving and high-impact sector.
Anemia Treatment Industry Market Dynamics & Concentration
The Anemia Treatment Industry is characterized by moderate to high market concentration, driven by a mix of established pharmaceutical giants and agile biotech innovators. The market share landscape is influenced by the development of novel therapeutics and the strategic positioning of key players. Innovation drivers include advancements in understanding disease pathology, the development of targeted therapies, and the growing demand for effective treatments for chronic conditions. Regulatory frameworks, while evolving, play a crucial role in market entry and product approval. The threat of product substitutes exists, particularly with the development of biosimilars and alternative treatment modalities, but innovation in specialty anemia treatments remains a significant differentiator. End-user trends favor less invasive and more effective treatments, with a growing emphasis on patient quality of life and disease management. Mergers and acquisitions (M&A) activities are a recurring theme, as larger companies seek to acquire innovative pipelines or expand their therapeutic portfolios. Over the historical period (2019-2024), we observed an average of 15 M&A deals per year with an average deal value of $2 billion, indicating strategic consolidation and investment.
- Market Share Drivers:
- Pipeline strength and R&D investment.
- Approval timelines and market access strategies.
- Patent protection and exclusivity periods.
- Brand recognition and physician adoption.
- M&A Activity:
- Acquisitions of early-stage biotech companies with promising drug candidates.
- Strategic partnerships to co-develop or commercialize therapies.
- Consolidation to achieve economies of scale and market dominance.
Anemia Treatment Industry Industry Trends & Analysis
The Anemia Treatment Industry is poised for substantial growth, with a projected Compound Annual Growth Rate (CAGR) of 8.5% between 2025 and 2033. This expansion is fueled by several key market growth drivers. The increasing prevalence of chronic diseases, such as Chronic Kidney Disease (CKD), and age-related anemias, directly contributes to a larger patient pool requiring effective treatment. Advances in biotechnology and molecular biology are enabling the development of highly targeted and personalized therapies, offering improved efficacy and reduced side effects. Technological disruptions, including the application of artificial intelligence (AI) in drug discovery and development, are accelerating the identification of novel drug targets and optimizing clinical trial designs. Consumer preferences are shifting towards treatments that offer convenience, improved adherence, and enhanced quality of life. Personalized medicine approaches are gaining traction, allowing for tailored treatment regimens based on individual patient genetic profiles and disease characteristics. Competitive dynamics are intensifying, with both established pharmaceutical companies and emerging biotech firms vying for market share through innovation and strategic collaborations. The market penetration of advanced anemia therapies is expected to rise significantly as healthcare systems recognize the long-term economic and clinical benefits of effective anemia management, reducing hospitalizations and improving patient outcomes. The global market size is expected to reach $75 billion by 2033.
Leading Markets & Segments in Anemia Treatment Industry
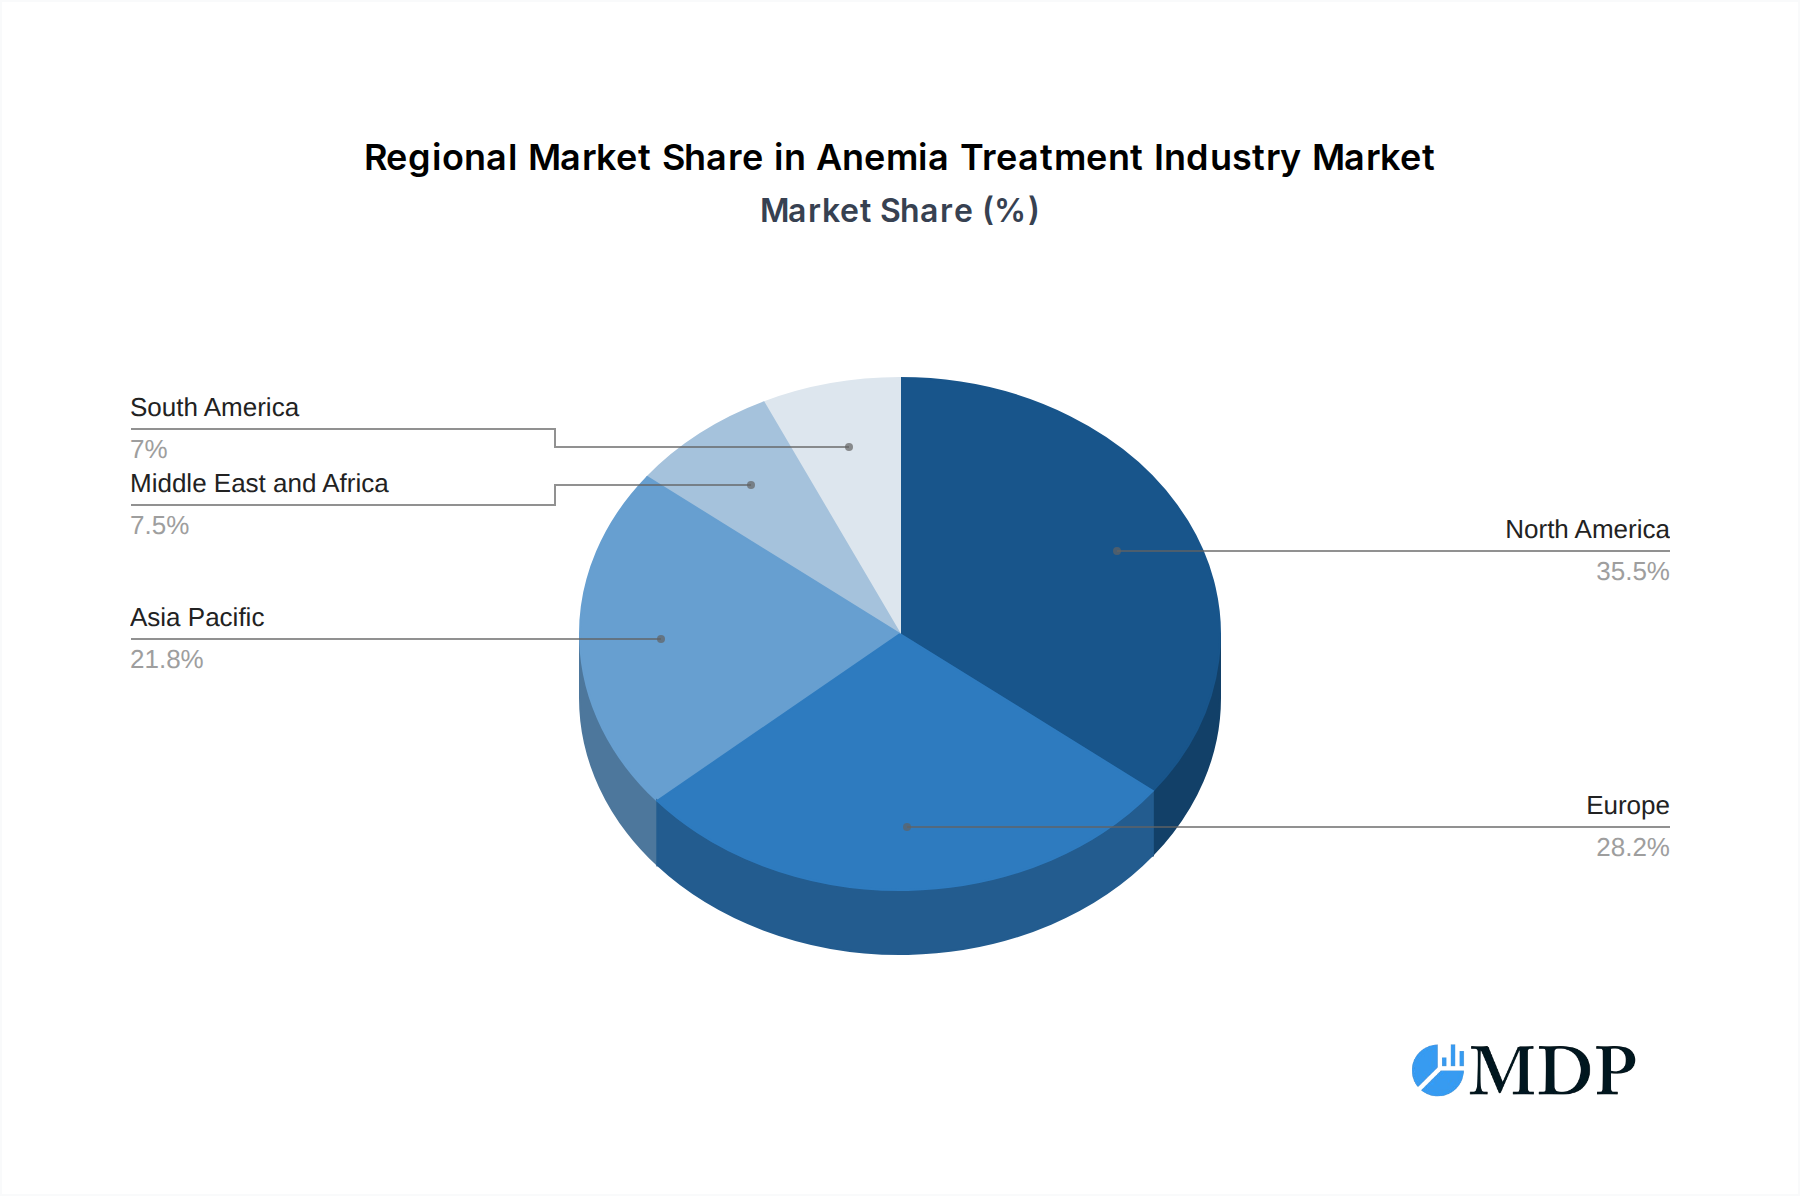
The Anemia Treatment Industry is segmented by the type of disease, with Iron Deficiency Anemia (IDA) currently holding the largest market share, estimated at 45% of the total market in the base year of 2025. This is attributed to its widespread occurrence globally, often linked to poor nutrition, gastrointestinal issues, and heavy menstrual bleeding. Following IDA, CKD (Chronic Kidney Disease) Anemia represents a significant and rapidly growing segment, projected to capture 25% of the market by 2025. The increasing incidence of CKD worldwide and the established link between kidney function and erythropoiesis drive this growth. Sickle Cell Anemia, while affecting a smaller patient population, is witnessing substantial therapeutic advancements, contributing 15% to the market and experiencing a robust CAGR due to novel gene therapies and targeted treatments. Aplastic Anemia and Other Diseases collectively account for the remaining 15%, with the "Other Diseases" category encompassing rare anemias and those associated with specific medical conditions like cancer or inflammatory disorders, which are also seeing dedicated research and development efforts. North America is anticipated to remain the dominant region, driven by a high prevalence of chronic diseases, strong healthcare infrastructure, and significant R&D investments, accounting for approximately 35% of the global market. Europe follows closely with 30%, while the Asia-Pacific region is emerging as a key growth market, projected to witness the highest CAGR due to increasing healthcare expenditure, improving diagnostic capabilities, and a growing patient awareness.
- Dominant Segments by Type of Disease:
- Iron Deficiency Anemia (IDA): High prevalence, diverse causes, and continuous demand for effective iron replenishment therapies.
- CKD (Chronic Kidney Disease) Anemia: Growing burden of CKD, development of erythropoiesis-stimulating agents (ESAs) and novel iron formulations.
- Sickle Cell Anemia: Focus on gene therapies, disease-modifying treatments, and improved patient outcomes.
- Aplastic Anemia: Advancements in bone marrow transplantation and immunosuppressive therapies.
- Other Diseases: Niche markets with potential for targeted therapies and specialized treatments.
Anemia Treatment Industry Product Developments
Product development in the Anemia Treatment Industry is characterized by a focus on enhanced efficacy, improved safety profiles, and patient convenience. Key trends include the innovation of novel oral and intravenous iron formulations with better absorption and reduced side effects, alongside the advancement of erythropoiesis-stimulating agents (ESAs) with longer half-lives and reduced immunogenicity. Furthermore, the emergence of gene therapies and targeted small molecule inhibitors for specific anemia types, such as Sickle Cell Anemia and certain rare anemias, represents a significant technological leap, offering potential for disease modification and long-term remission. These developments aim to address unmet medical needs and provide more personalized treatment options, thereby strengthening competitive advantages in the market.
Key Drivers of Anemia Treatment Industry Growth
The Anemia Treatment Industry is propelled by a confluence of dynamic growth drivers. The escalating global burden of chronic diseases like CKD, coupled with an aging population, directly increases the patient pool requiring anemia management. Technological advancements in drug discovery and development, including gene editing and targeted therapies, are unlocking novel treatment avenues with enhanced efficacy. Supportive regulatory policies and initiatives aimed at expediting the approval of innovative anemia treatments further accelerate market entry. Economic factors, such as increased healthcare spending in emerging economies and greater access to advanced medical care, also contribute significantly to market expansion, making innovative therapies more accessible to a broader patient demographic.
- Technological Advancements: Development of gene therapies, novel iron formulations, and targeted small molecule inhibitors.
- Economic Factors: Rising healthcare expenditure, particularly in emerging markets, and improved patient affordability.
- Regulatory Support: Streamlined approval pathways for novel anemia treatments and orphan drug designations for rare anemias.
Challenges in the Anemia Treatment Industry Market
Despite robust growth prospects, the Anemia Treatment Industry faces several significant challenges. The high cost of developing novel therapeutics, particularly gene therapies, poses a substantial barrier to entry and can impact market accessibility and affordability. Stringent and evolving regulatory hurdles, while ensuring patient safety, can prolong approval timelines and increase development costs. Supply chain complexities, especially for specialized biologics and rare disease treatments, can lead to availability issues. Moreover, the competitive pressure from established generic drugs and the ongoing need for extensive clinical trials to demonstrate superiority over existing treatments present ongoing challenges for market penetration and growth.
- High Development Costs: R&D expenses for novel therapies, especially biologics and gene therapies, are substantial.
- Regulatory Hurdles: Long and complex approval processes can delay market access.
- Supply Chain Issues: Ensuring consistent and timely availability of specialized treatments globally.
- Pricing Pressures: Balancing innovation with affordability for diverse healthcare systems.
Emerging Opportunities in Anemia Treatment Industry
The Anemia Treatment Industry is ripe with emerging opportunities poised to drive long-term growth. The exploration of novel therapeutic targets for refractory anemias and the development of patient-centric delivery systems offer significant potential. Strategic partnerships between pharmaceutical giants and innovative biotech startups are accelerating the translation of groundbreaking research into viable treatments. Market expansion into under-penetrated regions with a growing burden of anemia presents a substantial growth avenue. Furthermore, the increasing focus on preventative care and early diagnosis of anemia, coupled with the development of companion diagnostics, will open new market segments and treatment paradigms.
Leading Players in the Anemia Treatment Industry Sector
- Covis Pharma GmbH (AMAG Pharmaceuticals Inc)
- Sanofi
- Pieris Pharmaceuticals Inc
- Akebia Therapeutics Inc
- Takeda Pharmaceutical Company Limited
- Pharmacosmos A/S
- GSK plc
- Bluebird Bio Inc
- AbbVie Inc (Allergan Plc)
- Pfizer Inc (Global Blood Therapeutics Inc)
Key Milestones in Anemia Treatment Industry Industry
- November 2022: Sanofi received approval from the European Commission (EC) for Enjaymo (sutimlimab) for the treatment of hemolytic anemia in adult patients with cold agglutinin disease (CAD), a rare, serious, and chronic autoimmune hemolytic anemia. This milestone signifies advancements in treating rare autoimmune anemias and expands treatment options for patients.
- November 2022: CSL Vifor and Fresenius Kabi received approval from China's National NMPA for its Ferinject (ferric carboxymaltose), a preparation for intravenous iron therapy for the treatment of iron deficiency. This approval expands access to critical iron therapy in a major global market, addressing significant unmet needs in iron deficiency management.
Strategic Outlook for Anemia Treatment Industry Market
The strategic outlook for the Anemia Treatment Industry is exceptionally promising, driven by a sustained demand for innovative and effective therapies. Future growth will be accelerated by continued investment in R&D, particularly in the areas of gene therapy, personalized medicine, and novel oral iron formulations. Strategic collaborations and acquisitions will remain critical for companies to expand their pipelines and market reach. Emphasis on addressing the unmet needs of patients with rare anemias and expanding treatment access in emerging markets will unlock significant growth potential. Furthermore, leveraging digital health technologies for patient monitoring and adherence will be a key differentiator in the evolving landscape of anemia management.
Anemia Treatment Industry Segmentation
-
1. Type of Disease
- 1.1. Iron Deficiency Anemia
- 1.2. CKD (Chronic Kidney Disease) Anemia
- 1.3. Sickle Cell Anemia
- 1.4. Aplastic Anemia
- 1.5. Other Diseases
Anemia Treatment Industry Segmentation By Geography
-
1. North America
- 1.1. United States
- 1.2. Canada
- 1.3. Mexico
-
2. Europe
- 2.1. Germany
- 2.2. United Kingdom
- 2.3. France
- 2.4. Italy
- 2.5. Spain
- 2.6. Rest of Europe
-
3. Asia Pacific
- 3.1. China
- 3.2. Japan
- 3.3. India
- 3.4. Australia
- 3.5. South Korea
- 3.6. Rest of Asia Pacific
-
4. Middle East and Africa
- 4.1. GCC
- 4.2. South Africa
- 4.3. Rest of Middle East and Africa
-
5. South America
- 5.1. Brazil
- 5.2. Argentina
- 5.3. Rest of South America
Anemia Treatment Industry Regional Market Share
Geographic Coverage of Anemia Treatment Industry
Anemia Treatment Industry REPORT HIGHLIGHTS
| Aspects | Details |
|---|---|
| Study Period | 2020-2034 |
| Base Year | 2025 |
| Estimated Year | 2026 |
| Forecast Period | 2026-2034 |
| Historical Period | 2020-2025 |
| Growth Rate | CAGR of 7.12% from 2020-2034 |
| Segmentation |
|
Table of Contents
- 1. Introduction
- 1.1. Research Scope
- 1.2. Market Segmentation
- 1.3. Research Objective
- 1.4. Definitions and Assumptions
- 2. Executive Summary
- 2.1. Market Snapshot
- 3. Market Dynamics
- 3.1. Market Drivers
- 3.2. Market Restrains
- 3.3. Market Trends
- 3.4. Market Opportunities
- 4. Market Factor Analysis
- 4.1. Porters Five Forces
- 4.1.1. Bargaining Power of Suppliers
- 4.1.2. Bargaining Power of Buyers
- 4.1.3. Threat of New Entrants
- 4.1.4. Threat of Substitutes
- 4.1.5. Competitive Rivalry
- 4.2. PESTEL analysis
- 4.3. BCG Analysis
- 4.3.1. Stars (High Growth, High Market Share)
- 4.3.2. Cash Cows (Low Growth, High Market Share)
- 4.3.3. Question Mark (High Growth, Low Market Share)
- 4.3.4. Dogs (Low Growth, Low Market Share)
- 4.4. Ansoff Matrix Analysis
- 4.5. Supply Chain Analysis
- 4.6. Regulatory Landscape
- 4.7. Current Market Potential and Opportunity Assessment (TAM–SAM–SOM Framework)
- 4.8. MDP Analyst Note
- 4.1. Porters Five Forces
- 5. Market Analysis, Insights and Forecast 2021-2033
- 5.1. Market Analysis, Insights and Forecast - by Type of Disease
- 5.1.1. Iron Deficiency Anemia
- 5.1.2. CKD (Chronic Kidney Disease) Anemia
- 5.1.3. Sickle Cell Anemia
- 5.1.4. Aplastic Anemia
- 5.1.5. Other Diseases
- 5.2. Market Analysis, Insights and Forecast - by Region
- 5.2.1. North America
- 5.2.2. Europe
- 5.2.3. Asia Pacific
- 5.2.4. Middle East and Africa
- 5.2.5. South America
- 5.1. Market Analysis, Insights and Forecast - by Type of Disease
- 6. Global Anemia Treatment Industry Analysis, Insights and Forecast, 2021-2033
- 6.1. Market Analysis, Insights and Forecast - by Type of Disease
- 6.1.1. Iron Deficiency Anemia
- 6.1.2. CKD (Chronic Kidney Disease) Anemia
- 6.1.3. Sickle Cell Anemia
- 6.1.4. Aplastic Anemia
- 6.1.5. Other Diseases
- 6.1. Market Analysis, Insights and Forecast - by Type of Disease
- 7. North America Anemia Treatment Industry Analysis, Insights and Forecast, 2020-2032
- 7.1. Market Analysis, Insights and Forecast - by Type of Disease
- 7.1.1. Iron Deficiency Anemia
- 7.1.2. CKD (Chronic Kidney Disease) Anemia
- 7.1.3. Sickle Cell Anemia
- 7.1.4. Aplastic Anemia
- 7.1.5. Other Diseases
- 7.1. Market Analysis, Insights and Forecast - by Type of Disease
- 8. Europe Anemia Treatment Industry Analysis, Insights and Forecast, 2020-2032
- 8.1. Market Analysis, Insights and Forecast - by Type of Disease
- 8.1.1. Iron Deficiency Anemia
- 8.1.2. CKD (Chronic Kidney Disease) Anemia
- 8.1.3. Sickle Cell Anemia
- 8.1.4. Aplastic Anemia
- 8.1.5. Other Diseases
- 8.1. Market Analysis, Insights and Forecast - by Type of Disease
- 9. Asia Pacific Anemia Treatment Industry Analysis, Insights and Forecast, 2020-2032
- 9.1. Market Analysis, Insights and Forecast - by Type of Disease
- 9.1.1. Iron Deficiency Anemia
- 9.1.2. CKD (Chronic Kidney Disease) Anemia
- 9.1.3. Sickle Cell Anemia
- 9.1.4. Aplastic Anemia
- 9.1.5. Other Diseases
- 9.1. Market Analysis, Insights and Forecast - by Type of Disease
- 10. Middle East and Africa Anemia Treatment Industry Analysis, Insights and Forecast, 2020-2032
- 10.1. Market Analysis, Insights and Forecast - by Type of Disease
- 10.1.1. Iron Deficiency Anemia
- 10.1.2. CKD (Chronic Kidney Disease) Anemia
- 10.1.3. Sickle Cell Anemia
- 10.1.4. Aplastic Anemia
- 10.1.5. Other Diseases
- 10.1. Market Analysis, Insights and Forecast - by Type of Disease
- 11. South America Anemia Treatment Industry Analysis, Insights and Forecast, 2020-2032
- 11.1. Market Analysis, Insights and Forecast - by Type of Disease
- 11.1.1. Iron Deficiency Anemia
- 11.1.2. CKD (Chronic Kidney Disease) Anemia
- 11.1.3. Sickle Cell Anemia
- 11.1.4. Aplastic Anemia
- 11.1.5. Other Diseases
- 11.1. Market Analysis, Insights and Forecast - by Type of Disease
- 12. Competitive Analysis
- 12.1. Company Profiles
- 12.1.1 Covis Pharma GmbH (AMAG Pharmaceuticals Inc )
- 12.1.1.1. Company Overview
- 12.1.1.2. Products
- 12.1.1.3. Company Financials
- 12.1.1.4. SWOT Analysis
- 12.1.2 Sanofi
- 12.1.2.1. Company Overview
- 12.1.2.2. Products
- 12.1.2.3. Company Financials
- 12.1.2.4. SWOT Analysis
- 12.1.3 Pieris Pharmaceuticals Inc
- 12.1.3.1. Company Overview
- 12.1.3.2. Products
- 12.1.3.3. Company Financials
- 12.1.3.4. SWOT Analysis
- 12.1.4 Akebia Therapeutics Inc
- 12.1.4.1. Company Overview
- 12.1.4.2. Products
- 12.1.4.3. Company Financials
- 12.1.4.4. SWOT Analysis
- 12.1.5 Takeda Pharmaceutical Company Limited
- 12.1.5.1. Company Overview
- 12.1.5.2. Products
- 12.1.5.3. Company Financials
- 12.1.5.4. SWOT Analysis
- 12.1.6 Pharmacosmos A/S
- 12.1.6.1. Company Overview
- 12.1.6.2. Products
- 12.1.6.3. Company Financials
- 12.1.6.4. SWOT Analysis
- 12.1.7 GSK plc
- 12.1.7.1. Company Overview
- 12.1.7.2. Products
- 12.1.7.3. Company Financials
- 12.1.7.4. SWOT Analysis
- 12.1.8 Bluebird Bio Inc
- 12.1.8.1. Company Overview
- 12.1.8.2. Products
- 12.1.8.3. Company Financials
- 12.1.8.4. SWOT Analysis
- 12.1.9 AbbVie Inc (Allergan Plc)
- 12.1.9.1. Company Overview
- 12.1.9.2. Products
- 12.1.9.3. Company Financials
- 12.1.9.4. SWOT Analysis
- 12.1.10 Pfizer Inc (Global Blood Therapeutics Inc )
- 12.1.10.1. Company Overview
- 12.1.10.2. Products
- 12.1.10.3. Company Financials
- 12.1.10.4. SWOT Analysis
- 12.1.1 Covis Pharma GmbH (AMAG Pharmaceuticals Inc )
- 12.2. Market Entropy
- 12.2.1 Company's Key Areas Served
- 12.2.2 Recent Developments
- 12.3. Company Market Share Analysis 2025
- 12.3.1 Top 5 Companies Market Share Analysis
- 12.3.2 Top 3 Companies Market Share Analysis
- 12.4. List of Potential Customers
- 13. Research Methodology
List of Figures
- Figure 1: Global Anemia Treatment Industry Revenue Breakdown (billion, %) by Region 2025 & 2033
- Figure 2: Global Anemia Treatment Industry Volume Breakdown (K Unit, %) by Region 2025 & 2033
- Figure 3: North America Anemia Treatment Industry Revenue (billion), by Type of Disease 2025 & 2033
- Figure 4: North America Anemia Treatment Industry Volume (K Unit), by Type of Disease 2025 & 2033
- Figure 5: North America Anemia Treatment Industry Revenue Share (%), by Type of Disease 2025 & 2033
- Figure 6: North America Anemia Treatment Industry Volume Share (%), by Type of Disease 2025 & 2033
- Figure 7: North America Anemia Treatment Industry Revenue (billion), by Country 2025 & 2033
- Figure 8: North America Anemia Treatment Industry Volume (K Unit), by Country 2025 & 2033
- Figure 9: North America Anemia Treatment Industry Revenue Share (%), by Country 2025 & 2033
- Figure 10: North America Anemia Treatment Industry Volume Share (%), by Country 2025 & 2033
- Figure 11: Europe Anemia Treatment Industry Revenue (billion), by Type of Disease 2025 & 2033
- Figure 12: Europe Anemia Treatment Industry Volume (K Unit), by Type of Disease 2025 & 2033
- Figure 13: Europe Anemia Treatment Industry Revenue Share (%), by Type of Disease 2025 & 2033
- Figure 14: Europe Anemia Treatment Industry Volume Share (%), by Type of Disease 2025 & 2033
- Figure 15: Europe Anemia Treatment Industry Revenue (billion), by Country 2025 & 2033
- Figure 16: Europe Anemia Treatment Industry Volume (K Unit), by Country 2025 & 2033
- Figure 17: Europe Anemia Treatment Industry Revenue Share (%), by Country 2025 & 2033
- Figure 18: Europe Anemia Treatment Industry Volume Share (%), by Country 2025 & 2033
- Figure 19: Asia Pacific Anemia Treatment Industry Revenue (billion), by Type of Disease 2025 & 2033
- Figure 20: Asia Pacific Anemia Treatment Industry Volume (K Unit), by Type of Disease 2025 & 2033
- Figure 21: Asia Pacific Anemia Treatment Industry Revenue Share (%), by Type of Disease 2025 & 2033
- Figure 22: Asia Pacific Anemia Treatment Industry Volume Share (%), by Type of Disease 2025 & 2033
- Figure 23: Asia Pacific Anemia Treatment Industry Revenue (billion), by Country 2025 & 2033
- Figure 24: Asia Pacific Anemia Treatment Industry Volume (K Unit), by Country 2025 & 2033
- Figure 25: Asia Pacific Anemia Treatment Industry Revenue Share (%), by Country 2025 & 2033
- Figure 26: Asia Pacific Anemia Treatment Industry Volume Share (%), by Country 2025 & 2033
- Figure 27: Middle East and Africa Anemia Treatment Industry Revenue (billion), by Type of Disease 2025 & 2033
- Figure 28: Middle East and Africa Anemia Treatment Industry Volume (K Unit), by Type of Disease 2025 & 2033
- Figure 29: Middle East and Africa Anemia Treatment Industry Revenue Share (%), by Type of Disease 2025 & 2033
- Figure 30: Middle East and Africa Anemia Treatment Industry Volume Share (%), by Type of Disease 2025 & 2033
- Figure 31: Middle East and Africa Anemia Treatment Industry Revenue (billion), by Country 2025 & 2033
- Figure 32: Middle East and Africa Anemia Treatment Industry Volume (K Unit), by Country 2025 & 2033
- Figure 33: Middle East and Africa Anemia Treatment Industry Revenue Share (%), by Country 2025 & 2033
- Figure 34: Middle East and Africa Anemia Treatment Industry Volume Share (%), by Country 2025 & 2033
- Figure 35: South America Anemia Treatment Industry Revenue (billion), by Type of Disease 2025 & 2033
- Figure 36: South America Anemia Treatment Industry Volume (K Unit), by Type of Disease 2025 & 2033
- Figure 37: South America Anemia Treatment Industry Revenue Share (%), by Type of Disease 2025 & 2033
- Figure 38: South America Anemia Treatment Industry Volume Share (%), by Type of Disease 2025 & 2033
- Figure 39: South America Anemia Treatment Industry Revenue (billion), by Country 2025 & 2033
- Figure 40: South America Anemia Treatment Industry Volume (K Unit), by Country 2025 & 2033
- Figure 41: South America Anemia Treatment Industry Revenue Share (%), by Country 2025 & 2033
- Figure 42: South America Anemia Treatment Industry Volume Share (%), by Country 2025 & 2033
List of Tables
- Table 1: Global Anemia Treatment Industry Revenue billion Forecast, by Type of Disease 2020 & 2033
- Table 2: Global Anemia Treatment Industry Volume K Unit Forecast, by Type of Disease 2020 & 2033
- Table 3: Global Anemia Treatment Industry Revenue billion Forecast, by Region 2020 & 2033
- Table 4: Global Anemia Treatment Industry Volume K Unit Forecast, by Region 2020 & 2033
- Table 5: Global Anemia Treatment Industry Revenue billion Forecast, by Type of Disease 2020 & 2033
- Table 6: Global Anemia Treatment Industry Volume K Unit Forecast, by Type of Disease 2020 & 2033
- Table 7: Global Anemia Treatment Industry Revenue billion Forecast, by Country 2020 & 2033
- Table 8: Global Anemia Treatment Industry Volume K Unit Forecast, by Country 2020 & 2033
- Table 9: United States Anemia Treatment Industry Revenue (billion) Forecast, by Application 2020 & 2033
- Table 10: United States Anemia Treatment Industry Volume (K Unit) Forecast, by Application 2020 & 2033
- Table 11: Canada Anemia Treatment Industry Revenue (billion) Forecast, by Application 2020 & 2033
- Table 12: Canada Anemia Treatment Industry Volume (K Unit) Forecast, by Application 2020 & 2033
- Table 13: Mexico Anemia Treatment Industry Revenue (billion) Forecast, by Application 2020 & 2033
- Table 14: Mexico Anemia Treatment Industry Volume (K Unit) Forecast, by Application 2020 & 2033
- Table 15: Global Anemia Treatment Industry Revenue billion Forecast, by Type of Disease 2020 & 2033
- Table 16: Global Anemia Treatment Industry Volume K Unit Forecast, by Type of Disease 2020 & 2033
- Table 17: Global Anemia Treatment Industry Revenue billion Forecast, by Country 2020 & 2033
- Table 18: Global Anemia Treatment Industry Volume K Unit Forecast, by Country 2020 & 2033
- Table 19: Germany Anemia Treatment Industry Revenue (billion) Forecast, by Application 2020 & 2033
- Table 20: Germany Anemia Treatment Industry Volume (K Unit) Forecast, by Application 2020 & 2033
- Table 21: United Kingdom Anemia Treatment Industry Revenue (billion) Forecast, by Application 2020 & 2033
- Table 22: United Kingdom Anemia Treatment Industry Volume (K Unit) Forecast, by Application 2020 & 2033
- Table 23: France Anemia Treatment Industry Revenue (billion) Forecast, by Application 2020 & 2033
- Table 24: France Anemia Treatment Industry Volume (K Unit) Forecast, by Application 2020 & 2033
- Table 25: Italy Anemia Treatment Industry Revenue (billion) Forecast, by Application 2020 & 2033
- Table 26: Italy Anemia Treatment Industry Volume (K Unit) Forecast, by Application 2020 & 2033
- Table 27: Spain Anemia Treatment Industry Revenue (billion) Forecast, by Application 2020 & 2033
- Table 28: Spain Anemia Treatment Industry Volume (K Unit) Forecast, by Application 2020 & 2033
- Table 29: Rest of Europe Anemia Treatment Industry Revenue (billion) Forecast, by Application 2020 & 2033
- Table 30: Rest of Europe Anemia Treatment Industry Volume (K Unit) Forecast, by Application 2020 & 2033
- Table 31: Global Anemia Treatment Industry Revenue billion Forecast, by Type of Disease 2020 & 2033
- Table 32: Global Anemia Treatment Industry Volume K Unit Forecast, by Type of Disease 2020 & 2033
- Table 33: Global Anemia Treatment Industry Revenue billion Forecast, by Country 2020 & 2033
- Table 34: Global Anemia Treatment Industry Volume K Unit Forecast, by Country 2020 & 2033
- Table 35: China Anemia Treatment Industry Revenue (billion) Forecast, by Application 2020 & 2033
- Table 36: China Anemia Treatment Industry Volume (K Unit) Forecast, by Application 2020 & 2033
- Table 37: Japan Anemia Treatment Industry Revenue (billion) Forecast, by Application 2020 & 2033
- Table 38: Japan Anemia Treatment Industry Volume (K Unit) Forecast, by Application 2020 & 2033
- Table 39: India Anemia Treatment Industry Revenue (billion) Forecast, by Application 2020 & 2033
- Table 40: India Anemia Treatment Industry Volume (K Unit) Forecast, by Application 2020 & 2033
- Table 41: Australia Anemia Treatment Industry Revenue (billion) Forecast, by Application 2020 & 2033
- Table 42: Australia Anemia Treatment Industry Volume (K Unit) Forecast, by Application 2020 & 2033
- Table 43: South Korea Anemia Treatment Industry Revenue (billion) Forecast, by Application 2020 & 2033
- Table 44: South Korea Anemia Treatment Industry Volume (K Unit) Forecast, by Application 2020 & 2033
- Table 45: Rest of Asia Pacific Anemia Treatment Industry Revenue (billion) Forecast, by Application 2020 & 2033
- Table 46: Rest of Asia Pacific Anemia Treatment Industry Volume (K Unit) Forecast, by Application 2020 & 2033
- Table 47: Global Anemia Treatment Industry Revenue billion Forecast, by Type of Disease 2020 & 2033
- Table 48: Global Anemia Treatment Industry Volume K Unit Forecast, by Type of Disease 2020 & 2033
- Table 49: Global Anemia Treatment Industry Revenue billion Forecast, by Country 2020 & 2033
- Table 50: Global Anemia Treatment Industry Volume K Unit Forecast, by Country 2020 & 2033
- Table 51: GCC Anemia Treatment Industry Revenue (billion) Forecast, by Application 2020 & 2033
- Table 52: GCC Anemia Treatment Industry Volume (K Unit) Forecast, by Application 2020 & 2033
- Table 53: South Africa Anemia Treatment Industry Revenue (billion) Forecast, by Application 2020 & 2033
- Table 54: South Africa Anemia Treatment Industry Volume (K Unit) Forecast, by Application 2020 & 2033
- Table 55: Rest of Middle East and Africa Anemia Treatment Industry Revenue (billion) Forecast, by Application 2020 & 2033
- Table 56: Rest of Middle East and Africa Anemia Treatment Industry Volume (K Unit) Forecast, by Application 2020 & 2033
- Table 57: Global Anemia Treatment Industry Revenue billion Forecast, by Type of Disease 2020 & 2033
- Table 58: Global Anemia Treatment Industry Volume K Unit Forecast, by Type of Disease 2020 & 2033
- Table 59: Global Anemia Treatment Industry Revenue billion Forecast, by Country 2020 & 2033
- Table 60: Global Anemia Treatment Industry Volume K Unit Forecast, by Country 2020 & 2033
- Table 61: Brazil Anemia Treatment Industry Revenue (billion) Forecast, by Application 2020 & 2033
- Table 62: Brazil Anemia Treatment Industry Volume (K Unit) Forecast, by Application 2020 & 2033
- Table 63: Argentina Anemia Treatment Industry Revenue (billion) Forecast, by Application 2020 & 2033
- Table 64: Argentina Anemia Treatment Industry Volume (K Unit) Forecast, by Application 2020 & 2033
- Table 65: Rest of South America Anemia Treatment Industry Revenue (billion) Forecast, by Application 2020 & 2033
- Table 66: Rest of South America Anemia Treatment Industry Volume (K Unit) Forecast, by Application 2020 & 2033
Frequently Asked Questions
1. What is the projected Compound Annual Growth Rate (CAGR) of the Anemia Treatment Industry?
The projected CAGR is approximately 7.12%.
2. Which companies are prominent players in the Anemia Treatment Industry?
Key companies in the market include Covis Pharma GmbH (AMAG Pharmaceuticals Inc ), Sanofi, Pieris Pharmaceuticals Inc, Akebia Therapeutics Inc, Takeda Pharmaceutical Company Limited, Pharmacosmos A/S, GSK plc, Bluebird Bio Inc, AbbVie Inc (Allergan Plc), Pfizer Inc (Global Blood Therapeutics Inc ).
3. What are the main segments of the Anemia Treatment Industry?
The market segments include Type of Disease.
4. Can you provide details about the market size?
The market size is estimated to be USD 12.31 billion as of 2022.
5. What are some drivers contributing to market growth?
Increasing Cases of Anemia Across the Globe; Increasing Number of Women With Reproductive Age.
6. What are the notable trends driving market growth?
Iron Deficiency Anemia to Witness Healthy Growth Over the Forecast Period.
7. Are there any restraints impacting market growth?
Lack of Awareness About the Treatment in Developing Regions; High Cost of Drugs.
8. Can you provide examples of recent developments in the market?
November 2022: Sanofi received approval from the European Commission (EC) for Enjaymo (sutimlimab) for the treatment of hemolytic anemia in adult patients with cold agglutinin disease (CAD), a rare, serious, and chronic autoimmune hemolytic anemia, where the body's immune system mistakenly attacks healthy red blood cells and causes their rupture, known as hemolysis.
9. What pricing options are available for accessing the report?
Pricing options include single-user, multi-user, and enterprise licenses priced at USD 4750, USD 5250, and USD 8750 respectively.
10. Is the market size provided in terms of value or volume?
The market size is provided in terms of value, measured in billion and volume, measured in K Unit.
11. Are there any specific market keywords associated with the report?
Yes, the market keyword associated with the report is "Anemia Treatment Industry," which aids in identifying and referencing the specific market segment covered.
12. How do I determine which pricing option suits my needs best?
The pricing options vary based on user requirements and access needs. Individual users may opt for single-user licenses, while businesses requiring broader access may choose multi-user or enterprise licenses for cost-effective access to the report.
13. Are there any additional resources or data provided in the Anemia Treatment Industry report?
While the report offers comprehensive insights, it's advisable to review the specific contents or supplementary materials provided to ascertain if additional resources or data are available.
14. How can I stay updated on further developments or reports in the Anemia Treatment Industry?
To stay informed about further developments, trends, and reports in the Anemia Treatment Industry, consider subscribing to industry newsletters, following relevant companies and organizations, or regularly checking reputable industry news sources and publications.
Methodology
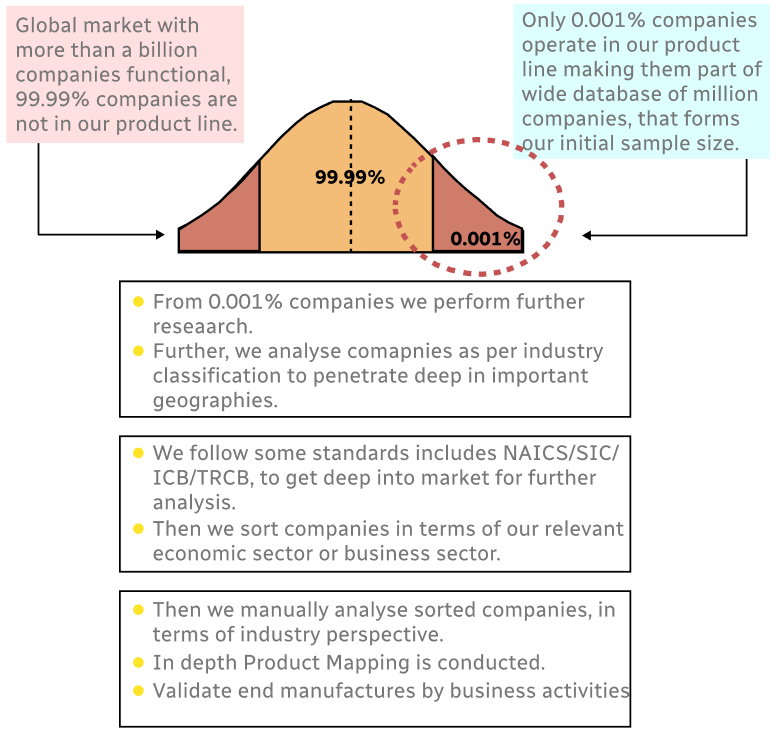
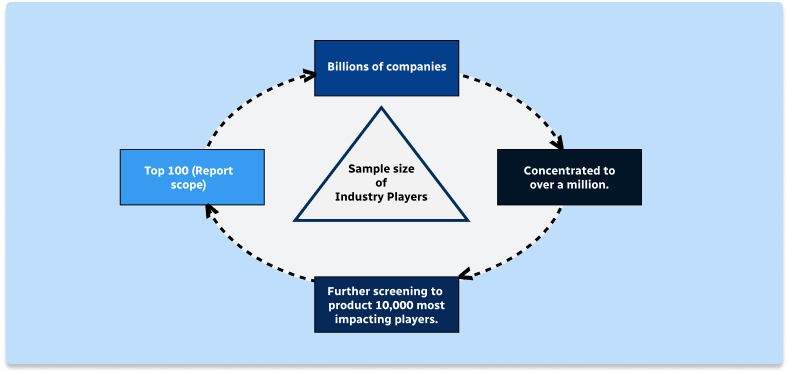
Step 1 - Identification of Relevant Samples Size from Population Database
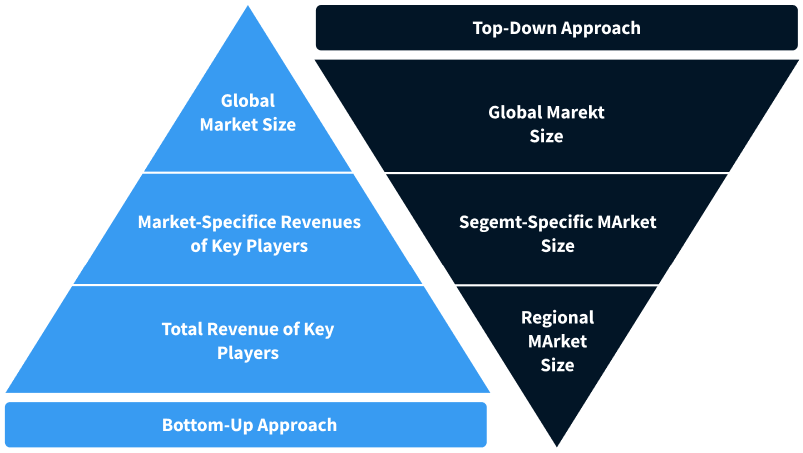
Step 2 - Approaches for Defining Global Market Size (Value, Volume* & Price*)
Note*: In applicable scenarios
Step 3 - Data Sources
Primary Research
- Web Analytics
- Survey Reports
- Research Institute
- Latest Research Reports
- Opinion Leaders
Secondary Research
- Annual Reports
- White Paper
- Latest Press Release
- Industry Association
- Paid Database
- Investor Presentations
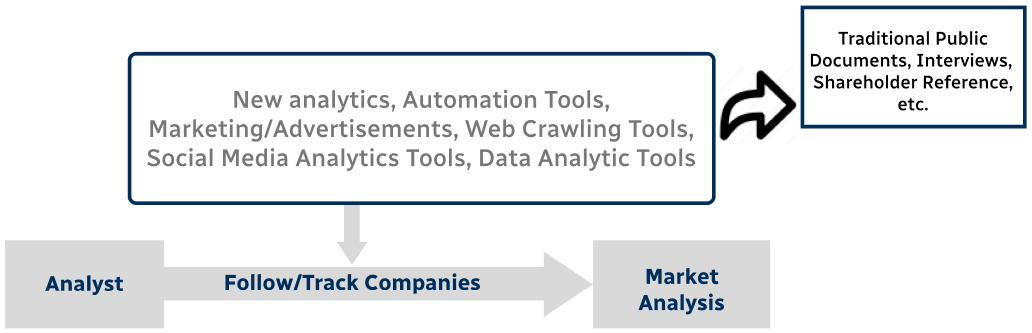
Step 4 - Data Triangulation
Involves using different sources of information in order to increase the validity of a study
These sources are likely to be stakeholders in a program - participants, other researchers, program staff, other community members, and so on.
Then we put all data in single framework & apply various statistical tools to find out the dynamic on the market.
During the analysis stage, feedback from the stakeholder groups would be compared to determine areas of agreement as well as areas of divergence