

Key Insights
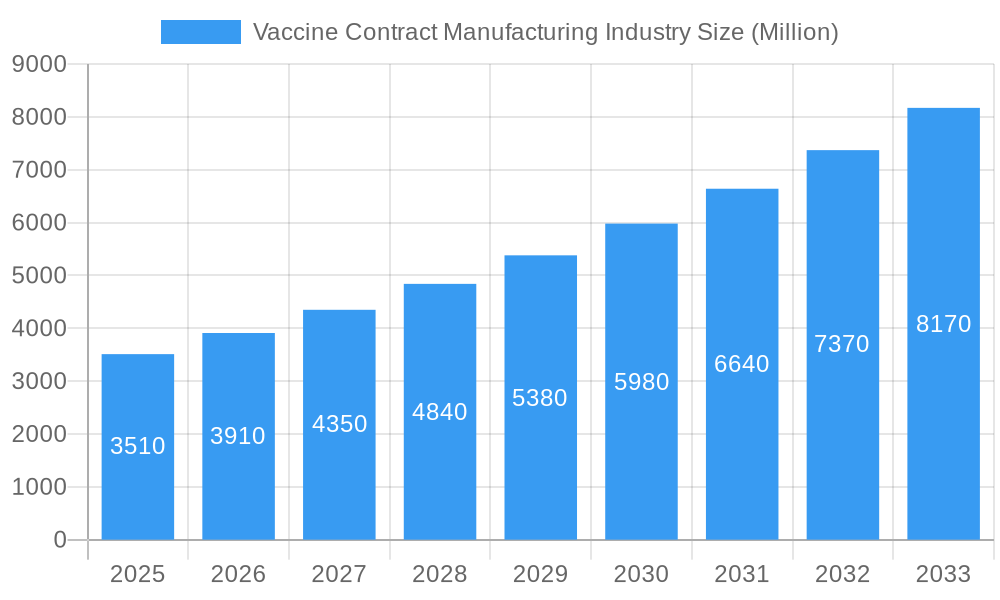
The global vaccine contract manufacturing market, valued at $3.51 billion in 2025, is projected to experience robust growth, driven by the increasing demand for vaccines globally and the outsourcing trend among pharmaceutical companies. This surge is fueled by several factors. Firstly, the ongoing need for routine immunizations and the emergence of novel infectious diseases necessitate a robust and scalable vaccine manufacturing infrastructure. Secondly, the complexity of vaccine development and production, coupled with rising regulatory hurdles, encourages pharmaceutical companies to leverage the expertise and facilities of specialized contract manufacturers. This allows them to focus on R&D and marketing, improving efficiency and reducing costs. Furthermore, the increasing prevalence of chronic diseases and the rising geriatric population contribute to the growth in demand for various vaccines, further bolstering the market. Key segments driving growth include inactivated and RNA vaccines, reflecting technological advancements in vaccine production. The clinical and commercial stages of operations account for a significant portion of market share, showcasing the industry's transition from research to large-scale production. Geographical analysis reveals a strong presence in North America and Europe, with the Asia-Pacific region demonstrating significant growth potential.
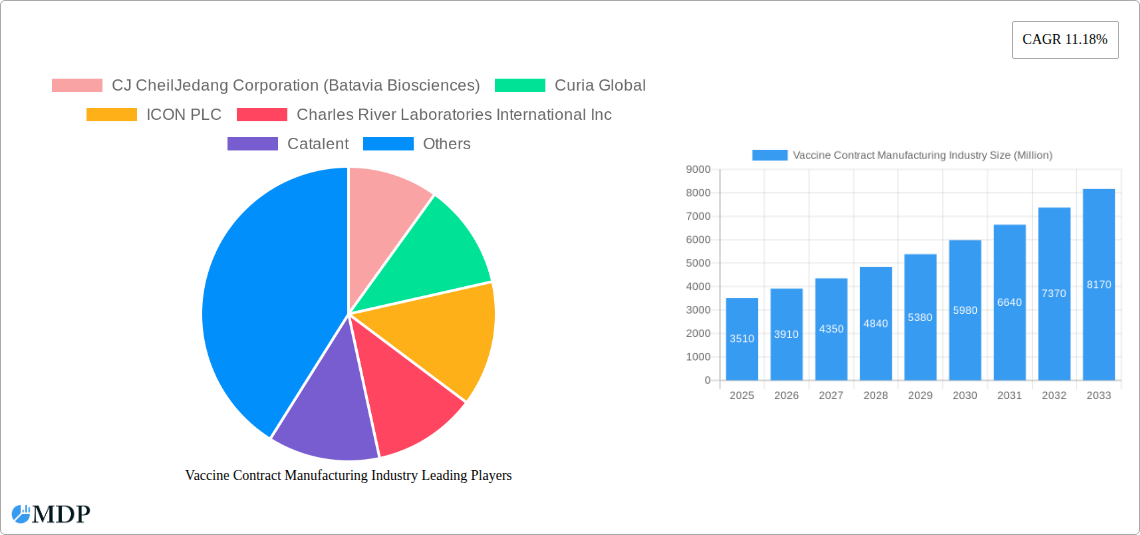
Vaccine Contract Manufacturing Industry Market Size (In Billion)
Competition is fierce, with major players like Lonza, Catalent, and Charles River Laboratories holding considerable market share. However, smaller, specialized contract manufacturers are also emerging, particularly those focused on novel vaccine technologies like mRNA and viral vector vaccines. The market’s trajectory is influenced by factors such as stringent regulatory approvals, fluctuating raw material prices, and the potential for future pandemics. Continued investment in advanced manufacturing technologies and capacity expansion will be crucial for meeting the growing global demand for vaccines. This includes addressing challenges related to supply chain resilience and technological advancements to optimize production efficiency and reduce timelines. The market's future success hinges on navigating these complex dynamics and adapting to the ever-evolving landscape of vaccine development and distribution.
Vaccine Contract Manufacturing Industry Company Market Share
Vaccine Contract Manufacturing Industry: A Comprehensive Market Report (2019-2033)
This comprehensive report provides an in-depth analysis of the Vaccine Contract Manufacturing industry, offering invaluable insights for stakeholders seeking to navigate this dynamic market. Covering the period 2019-2033, with a base year of 2025 and a forecast period of 2025-2033, this report utilizes rigorous data analysis and industry expertise to present a clear picture of current trends and future projections. The market is valued at xx Million in 2025 and is projected to reach xx Million by 2033, showcasing significant growth potential. Key players such as Catalent, Lonza Group AG, and Fujifilm Holdings Corporation are shaping the landscape, alongside other prominent players including CJ CheilJedang Corporation (Batavia Biosciences), Curia Global, ICON PLC, Charles River Laboratories International Inc, IDT Biologika GmbH, Gedeon Richter (Richter-Helm BioLogics), Ajinomoto Bio-Pharma Services, Recipharm AB, and Emergent BioSolutions Inc.
Vaccine Contract Manufacturing Industry Market Dynamics & Concentration
The Vaccine Contract Manufacturing market exhibits a moderately concentrated landscape, with a few large players holding significant market share. The market share of the top 5 players is estimated to be around xx%. Innovation, primarily driven by advancements in mRNA technology and the increasing demand for personalized vaccines, is a key driver of market growth. Stringent regulatory frameworks, particularly concerning GMP (Good Manufacturing Practices) and safety standards, significantly influence market dynamics. Product substitutes, though limited, include in-house vaccine manufacturing by larger pharmaceutical companies. The end-user trend is shifting towards greater demand for human vaccines, fueled by increasing awareness of vaccine-preventable diseases. Furthermore, M&A activity is relatively high, with approximately xx M&A deals recorded during the historical period (2019-2024). This consolidation is expected to continue, further shaping the market structure.
- Market Concentration: Moderately concentrated, with top 5 players holding xx% market share.
- Innovation Drivers: Advancements in mRNA technology, personalized vaccines.
- Regulatory Landscape: Stringent GMP and safety regulations.
- Product Substitutes: Limited, mainly in-house manufacturing by large pharma.
- End-User Trends: Increasing demand for human vaccines.
- M&A Activity: Approximately xx deals during 2019-2024.
Vaccine Contract Manufacturing Industry Industry Trends & Analysis
The Vaccine Contract Manufacturing market is experiencing robust growth, with a projected CAGR of xx% during the forecast period (2025-2033). Several factors contribute to this growth, including the increasing prevalence of vaccine-preventable diseases, government initiatives promoting vaccination, and ongoing R&D efforts leading to novel vaccine types. Technological disruptions, particularly in downstream processing and automation, are streamlining manufacturing processes and reducing costs. Consumer preferences are increasingly focused on safety, efficacy, and accessibility of vaccines. Competitive dynamics are characterized by both collaboration and competition, with companies forming strategic partnerships while also striving for market share dominance. Market penetration of contract manufacturing services is steadily increasing, with xx% of vaccine production currently outsourced.
Leading Markets & Segments in Vaccine Contract Manufacturing Industry
The North American market currently holds the largest share of the global Vaccine Contract Manufacturing market, driven by robust R&D investment, advanced infrastructure, and a strong regulatory framework. Within segments, the human vaccine end-use segment dominates, accounting for xx% of the total market. Regarding vaccine types, mRNA vaccines are experiencing the fastest growth, driven by their successful application in the COVID-19 pandemic. Downstream processes constitute the largest segment of the overall process. Commercial-scale operations represent a significant portion of the market, primarily driven by high-volume vaccine production needs.
- Key Drivers for North American Dominance:
- Strong R&D investment and infrastructure
- Favorable regulatory environment
- High disposable income
- Dominant Segments: Human vaccines (End Use), mRNA Vaccines (Vaccine Type), Downstream Processes (Process), Commercial-scale operations (Scale of Operations)
Vaccine Contract Manufacturing Industry Product Developments
Recent advancements focus on improving vaccine efficacy, stability, and manufacturing efficiency. This includes the development of novel delivery systems, improved purification techniques, and the implementation of automation in manufacturing. These advancements aim to reduce costs, enhance scalability, and address emerging challenges in vaccine production. The integration of advanced analytics and AI is also revolutionizing the manufacturing process, improving quality control and yield.
Key Drivers of Vaccine Contract Manufacturing Industry Growth
Several factors are driving the growth of the Vaccine Contract Manufacturing market. These include:
- Technological advancements: Improvements in vaccine design, manufacturing processes, and delivery systems.
- Government initiatives: Increased funding for vaccine development and manufacturing.
- Growing prevalence of vaccine-preventable diseases: This creates a consistent demand for vaccines.
- Outsourced Manufacturing: Many pharmaceutical companies outsource their manufacturing activities to contract manufacturers.
Challenges in the Vaccine Contract Manufacturing Industry Market
The industry faces several challenges, including:
- Stringent regulatory requirements: Compliance costs and delays can impact profitability.
- Supply chain disruptions: Raw material shortages and logistical issues can affect production.
- Intense competition: The market is characterized by several large players competing for market share. These factors combined may impact production by around xx%.
Emerging Opportunities in Vaccine Contract Manufacturing Industry
Significant opportunities exist for growth in this market, driven by technological advancements such as the development of next-generation vaccines (e.g., mRNA, viral vector) and innovative manufacturing technologies like continuous manufacturing processes. Strategic partnerships between contract manufacturers and pharmaceutical companies will play a vital role in accelerating vaccine development and access. Expansion into emerging markets with significant unmet healthcare needs is another significant growth catalyst.
Leading Players in the Vaccine Contract Manufacturing Industry Sector
- CJ CheilJedang Corporation (Batavia Biosciences)
- Curia Global
- ICON PLC
- Charles River Laboratories International Inc
- Catalent
- IDT Biologika GmbH
- Lonza Group AG
- Gedeon Richter (Richter-Helm BioLogics)
- Ajinomoto Bio-Pharma Services
- Recipharm AB
- Emergent BioSolutions Inc
- Fujifilm Holdings Corporation
Key Milestones in Vaccine Contract Manufacturing Industry Industry
- August 2022: Moderna's agreement with the Canadian government to build an mRNA vaccine manufacturing facility signifies a significant investment in domestic vaccine production and expansion of mRNA vaccine manufacturing capacity.
- June 2022: The collaboration between Merck and Agilent Technologies to improve downstream processing technologies highlights the ongoing efforts to optimize vaccine manufacturing processes and address bottlenecks.
Strategic Outlook for Vaccine Contract Manufacturing Industry Market
The future of the Vaccine Contract Manufacturing industry is bright. Continued technological innovation, strategic partnerships, and expanding global demand will drive significant growth in the coming years. Companies focusing on efficient, scalable, and flexible manufacturing processes, coupled with a commitment to quality and regulatory compliance, are poised to capture significant market share. The rising prevalence of emerging infectious diseases will further fuel demand, creating significant opportunities for expansion and investment in this critical sector.
Vaccine Contract Manufacturing Industry Segmentation
-
1. Vaccine Type
- 1.1. Inactivated Vaccines
- 1.2. Live-attenuated Vaccines
- 1.3. RNA Vaccines
- 1.4. Subunit Vaccines
- 1.5. Toxoid-based Vaccines
-
2. Process
-
2.1. Downstream
- 2.1.1. Analytical and QC Studies
- 2.1.2. Fill and Finish
- 2.1.3. Packaging
- 2.1.4. Other Downstream Processes
-
2.2. Upstream
- 2.2.1. Bacterial Expression Systems
- 2.2.2. Baculovirus/Insect Expression Systems
- 2.2.3. Mammalian Expression Systems
- 2.2.4. Yeast Expression Systems
- 2.2.5. Other Upstream Processes
-
2.1. Downstream
-
3. Scale of Operations
- 3.1. Preclinical
- 3.2. Clinical
- 3.3. Commercial
-
4. End Use
- 4.1. Human Use
- 4.2. Veterinary
Vaccine Contract Manufacturing Industry Segmentation By Geography
-
1. North America
- 1.1. United States
- 1.2. Canada
- 1.3. Mexico
-
2. Europe
- 2.1. Germany
- 2.2. United Kingdom
- 2.3. France
- 2.4. Italy
- 2.5. Spain
- 2.6. Rest of Europe
-
3. Asia Pacific
- 3.1. China
- 3.2. Japan
- 3.3. India
- 3.4. Australia
- 3.5. South Korea
- 3.6. Rest of Asia Pacific
-
4. Middle East and Africa
- 4.1. GCC
- 4.2. South Africa
- 4.3. Rest of Middle East and Africa
-
5. South America
- 5.1. Brazil
- 5.2. Argentina
- 5.3. Rest of South America
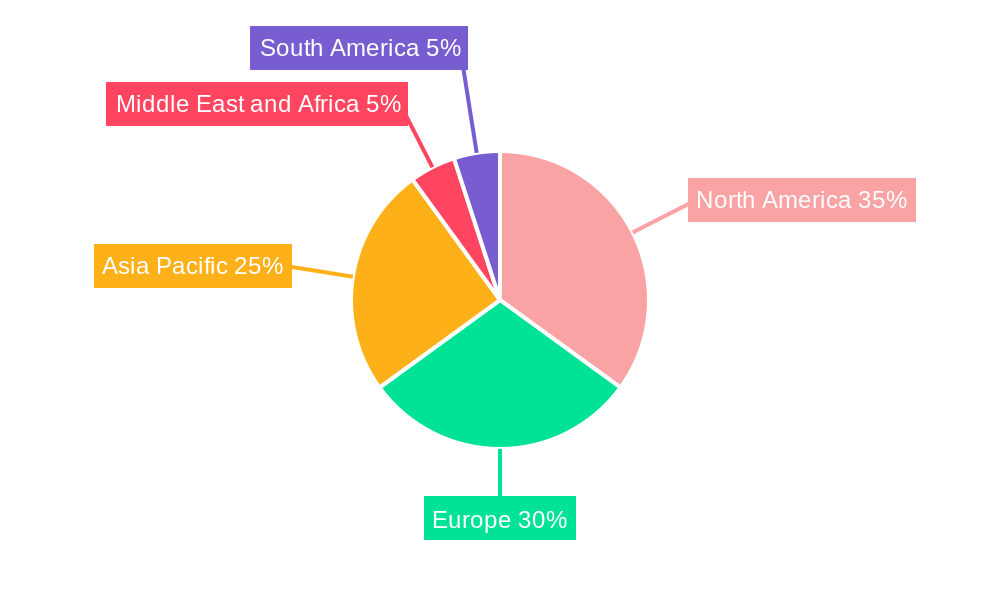
Vaccine Contract Manufacturing Industry Regional Market Share
Geographic Coverage of Vaccine Contract Manufacturing Industry
Vaccine Contract Manufacturing Industry REPORT HIGHLIGHTS
| Aspects | Details |
|---|---|
| Study Period | 2020-2034 |
| Base Year | 2025 |
| Estimated Year | 2026 |
| Forecast Period | 2026-2034 |
| Historical Period | 2020-2025 |
| Growth Rate | CAGR of 11.18% from 2020-2034 |
| Segmentation |
|
Table of Contents
- 1. Introduction
- 1.1. Research Scope
- 1.2. Market Segmentation
- 1.3. Research Objective
- 1.4. Definitions and Assumptions
- 2. Executive Summary
- 2.1. Market Snapshot
- 3. Market Dynamics
- 3.1. Market Drivers
- 3.2. Market Restrains
- 3.3. Market Trends
- 3.4. Market Opportunities
- 4. Market Factor Analysis
- 4.1. Porters Five Forces
- 4.1.1. Bargaining Power of Suppliers
- 4.1.2. Bargaining Power of Buyers
- 4.1.3. Threat of New Entrants
- 4.1.4. Threat of Substitutes
- 4.1.5. Competitive Rivalry
- 4.2. PESTEL analysis
- 4.3. BCG Analysis
- 4.3.1. Stars (High Growth, High Market Share)
- 4.3.2. Cash Cows (Low Growth, High Market Share)
- 4.3.3. Question Mark (High Growth, Low Market Share)
- 4.3.4. Dogs (Low Growth, Low Market Share)
- 4.4. Ansoff Matrix Analysis
- 4.5. Supply Chain Analysis
- 4.6. Regulatory Landscape
- 4.7. Current Market Potential and Opportunity Assessment (TAM–SAM–SOM Framework)
- 4.8. MDP Analyst Note
- 4.1. Porters Five Forces
- 5. Market Analysis, Insights and Forecast 2021-2033
- 5.1. Market Analysis, Insights and Forecast - by Vaccine Type
- 5.1.1. Inactivated Vaccines
- 5.1.2. Live-attenuated Vaccines
- 5.1.3. RNA Vaccines
- 5.1.4. Subunit Vaccines
- 5.1.5. Toxoid-based Vaccines
- 5.2. Market Analysis, Insights and Forecast - by Process
- 5.2.1. Downstream
- 5.2.1.1. Analytical and QC Studies
- 5.2.1.2. Fill and Finish
- 5.2.1.3. Packaging
- 5.2.1.4. Other Downstream Processes
- 5.2.2. Upstream
- 5.2.2.1. Bacterial Expression Systems
- 5.2.2.2. Baculovirus/Insect Expression Systems
- 5.2.2.3. Mammalian Expression Systems
- 5.2.2.4. Yeast Expression Systems
- 5.2.2.5. Other Upstream Processes
- 5.2.1. Downstream
- 5.3. Market Analysis, Insights and Forecast - by Scale of Operations
- 5.3.1. Preclinical
- 5.3.2. Clinical
- 5.3.3. Commercial
- 5.4. Market Analysis, Insights and Forecast - by End Use
- 5.4.1. Human Use
- 5.4.2. Veterinary
- 5.5. Market Analysis, Insights and Forecast - by Region
- 5.5.1. North America
- 5.5.2. Europe
- 5.5.3. Asia Pacific
- 5.5.4. Middle East and Africa
- 5.5.5. South America
- 5.1. Market Analysis, Insights and Forecast - by Vaccine Type
- 6. Global Vaccine Contract Manufacturing Industry Analysis, Insights and Forecast, 2021-2033
- 6.1. Market Analysis, Insights and Forecast - by Vaccine Type
- 6.1.1. Inactivated Vaccines
- 6.1.2. Live-attenuated Vaccines
- 6.1.3. RNA Vaccines
- 6.1.4. Subunit Vaccines
- 6.1.5. Toxoid-based Vaccines
- 6.2. Market Analysis, Insights and Forecast - by Process
- 6.2.1. Downstream
- 6.2.1.1. Analytical and QC Studies
- 6.2.1.2. Fill and Finish
- 6.2.1.3. Packaging
- 6.2.1.4. Other Downstream Processes
- 6.2.2. Upstream
- 6.2.2.1. Bacterial Expression Systems
- 6.2.2.2. Baculovirus/Insect Expression Systems
- 6.2.2.3. Mammalian Expression Systems
- 6.2.2.4. Yeast Expression Systems
- 6.2.2.5. Other Upstream Processes
- 6.2.1. Downstream
- 6.3. Market Analysis, Insights and Forecast - by Scale of Operations
- 6.3.1. Preclinical
- 6.3.2. Clinical
- 6.3.3. Commercial
- 6.4. Market Analysis, Insights and Forecast - by End Use
- 6.4.1. Human Use
- 6.4.2. Veterinary
- 6.1. Market Analysis, Insights and Forecast - by Vaccine Type
- 7. North America Vaccine Contract Manufacturing Industry Analysis, Insights and Forecast, 2020-2032
- 7.1. Market Analysis, Insights and Forecast - by Vaccine Type
- 7.1.1. Inactivated Vaccines
- 7.1.2. Live-attenuated Vaccines
- 7.1.3. RNA Vaccines
- 7.1.4. Subunit Vaccines
- 7.1.5. Toxoid-based Vaccines
- 7.2. Market Analysis, Insights and Forecast - by Process
- 7.2.1. Downstream
- 7.2.1.1. Analytical and QC Studies
- 7.2.1.2. Fill and Finish
- 7.2.1.3. Packaging
- 7.2.1.4. Other Downstream Processes
- 7.2.2. Upstream
- 7.2.2.1. Bacterial Expression Systems
- 7.2.2.2. Baculovirus/Insect Expression Systems
- 7.2.2.3. Mammalian Expression Systems
- 7.2.2.4. Yeast Expression Systems
- 7.2.2.5. Other Upstream Processes
- 7.2.1. Downstream
- 7.3. Market Analysis, Insights and Forecast - by Scale of Operations
- 7.3.1. Preclinical
- 7.3.2. Clinical
- 7.3.3. Commercial
- 7.4. Market Analysis, Insights and Forecast - by End Use
- 7.4.1. Human Use
- 7.4.2. Veterinary
- 7.1. Market Analysis, Insights and Forecast - by Vaccine Type
- 8. Europe Vaccine Contract Manufacturing Industry Analysis, Insights and Forecast, 2020-2032
- 8.1. Market Analysis, Insights and Forecast - by Vaccine Type
- 8.1.1. Inactivated Vaccines
- 8.1.2. Live-attenuated Vaccines
- 8.1.3. RNA Vaccines
- 8.1.4. Subunit Vaccines
- 8.1.5. Toxoid-based Vaccines
- 8.2. Market Analysis, Insights and Forecast - by Process
- 8.2.1. Downstream
- 8.2.1.1. Analytical and QC Studies
- 8.2.1.2. Fill and Finish
- 8.2.1.3. Packaging
- 8.2.1.4. Other Downstream Processes
- 8.2.2. Upstream
- 8.2.2.1. Bacterial Expression Systems
- 8.2.2.2. Baculovirus/Insect Expression Systems
- 8.2.2.3. Mammalian Expression Systems
- 8.2.2.4. Yeast Expression Systems
- 8.2.2.5. Other Upstream Processes
- 8.2.1. Downstream
- 8.3. Market Analysis, Insights and Forecast - by Scale of Operations
- 8.3.1. Preclinical
- 8.3.2. Clinical
- 8.3.3. Commercial
- 8.4. Market Analysis, Insights and Forecast - by End Use
- 8.4.1. Human Use
- 8.4.2. Veterinary
- 8.1. Market Analysis, Insights and Forecast - by Vaccine Type
- 9. Asia Pacific Vaccine Contract Manufacturing Industry Analysis, Insights and Forecast, 2020-2032
- 9.1. Market Analysis, Insights and Forecast - by Vaccine Type
- 9.1.1. Inactivated Vaccines
- 9.1.2. Live-attenuated Vaccines
- 9.1.3. RNA Vaccines
- 9.1.4. Subunit Vaccines
- 9.1.5. Toxoid-based Vaccines
- 9.2. Market Analysis, Insights and Forecast - by Process
- 9.2.1. Downstream
- 9.2.1.1. Analytical and QC Studies
- 9.2.1.2. Fill and Finish
- 9.2.1.3. Packaging
- 9.2.1.4. Other Downstream Processes
- 9.2.2. Upstream
- 9.2.2.1. Bacterial Expression Systems
- 9.2.2.2. Baculovirus/Insect Expression Systems
- 9.2.2.3. Mammalian Expression Systems
- 9.2.2.4. Yeast Expression Systems
- 9.2.2.5. Other Upstream Processes
- 9.2.1. Downstream
- 9.3. Market Analysis, Insights and Forecast - by Scale of Operations
- 9.3.1. Preclinical
- 9.3.2. Clinical
- 9.3.3. Commercial
- 9.4. Market Analysis, Insights and Forecast - by End Use
- 9.4.1. Human Use
- 9.4.2. Veterinary
- 9.1. Market Analysis, Insights and Forecast - by Vaccine Type
- 10. Middle East and Africa Vaccine Contract Manufacturing Industry Analysis, Insights and Forecast, 2020-2032
- 10.1. Market Analysis, Insights and Forecast - by Vaccine Type
- 10.1.1. Inactivated Vaccines
- 10.1.2. Live-attenuated Vaccines
- 10.1.3. RNA Vaccines
- 10.1.4. Subunit Vaccines
- 10.1.5. Toxoid-based Vaccines
- 10.2. Market Analysis, Insights and Forecast - by Process
- 10.2.1. Downstream
- 10.2.1.1. Analytical and QC Studies
- 10.2.1.2. Fill and Finish
- 10.2.1.3. Packaging
- 10.2.1.4. Other Downstream Processes
- 10.2.2. Upstream
- 10.2.2.1. Bacterial Expression Systems
- 10.2.2.2. Baculovirus/Insect Expression Systems
- 10.2.2.3. Mammalian Expression Systems
- 10.2.2.4. Yeast Expression Systems
- 10.2.2.5. Other Upstream Processes
- 10.2.1. Downstream
- 10.3. Market Analysis, Insights and Forecast - by Scale of Operations
- 10.3.1. Preclinical
- 10.3.2. Clinical
- 10.3.3. Commercial
- 10.4. Market Analysis, Insights and Forecast - by End Use
- 10.4.1. Human Use
- 10.4.2. Veterinary
- 10.1. Market Analysis, Insights and Forecast - by Vaccine Type
- 11. South America Vaccine Contract Manufacturing Industry Analysis, Insights and Forecast, 2020-2032
- 11.1. Market Analysis, Insights and Forecast - by Vaccine Type
- 11.1.1. Inactivated Vaccines
- 11.1.2. Live-attenuated Vaccines
- 11.1.3. RNA Vaccines
- 11.1.4. Subunit Vaccines
- 11.1.5. Toxoid-based Vaccines
- 11.2. Market Analysis, Insights and Forecast - by Process
- 11.2.1. Downstream
- 11.2.1.1. Analytical and QC Studies
- 11.2.1.2. Fill and Finish
- 11.2.1.3. Packaging
- 11.2.1.4. Other Downstream Processes
- 11.2.2. Upstream
- 11.2.2.1. Bacterial Expression Systems
- 11.2.2.2. Baculovirus/Insect Expression Systems
- 11.2.2.3. Mammalian Expression Systems
- 11.2.2.4. Yeast Expression Systems
- 11.2.2.5. Other Upstream Processes
- 11.2.1. Downstream
- 11.3. Market Analysis, Insights and Forecast - by Scale of Operations
- 11.3.1. Preclinical
- 11.3.2. Clinical
- 11.3.3. Commercial
- 11.4. Market Analysis, Insights and Forecast - by End Use
- 11.4.1. Human Use
- 11.4.2. Veterinary
- 11.1. Market Analysis, Insights and Forecast - by Vaccine Type
- 12. Competitive Analysis
- 12.1. Company Profiles
- 12.1.1 CJ CheilJedang Corporation (Batavia Biosciences)
- 12.1.1.1. Company Overview
- 12.1.1.2. Products
- 12.1.1.3. Company Financials
- 12.1.1.4. SWOT Analysis
- 12.1.2 Curia Global
- 12.1.2.1. Company Overview
- 12.1.2.2. Products
- 12.1.2.3. Company Financials
- 12.1.2.4. SWOT Analysis
- 12.1.3 ICON PLC
- 12.1.3.1. Company Overview
- 12.1.3.2. Products
- 12.1.3.3. Company Financials
- 12.1.3.4. SWOT Analysis
- 12.1.4 Charles River Laboratories International Inc
- 12.1.4.1. Company Overview
- 12.1.4.2. Products
- 12.1.4.3. Company Financials
- 12.1.4.4. SWOT Analysis
- 12.1.5 Catalent
- 12.1.5.1. Company Overview
- 12.1.5.2. Products
- 12.1.5.3. Company Financials
- 12.1.5.4. SWOT Analysis
- 12.1.6 IDT Biologika GmbH
- 12.1.6.1. Company Overview
- 12.1.6.2. Products
- 12.1.6.3. Company Financials
- 12.1.6.4. SWOT Analysis
- 12.1.7 Lonza Group AG
- 12.1.7.1. Company Overview
- 12.1.7.2. Products
- 12.1.7.3. Company Financials
- 12.1.7.4. SWOT Analysis
- 12.1.8 Gedeon Richter (Richter-Helm BioLogics)
- 12.1.8.1. Company Overview
- 12.1.8.2. Products
- 12.1.8.3. Company Financials
- 12.1.8.4. SWOT Analysis
- 12.1.9 Ajinomoto Bio-Pharma Services
- 12.1.9.1. Company Overview
- 12.1.9.2. Products
- 12.1.9.3. Company Financials
- 12.1.9.4. SWOT Analysis
- 12.1.10 Recipharm AB
- 12.1.10.1. Company Overview
- 12.1.10.2. Products
- 12.1.10.3. Company Financials
- 12.1.10.4. SWOT Analysis
- 12.1.11 Emergent BioSolutions Inc
- 12.1.11.1. Company Overview
- 12.1.11.2. Products
- 12.1.11.3. Company Financials
- 12.1.11.4. SWOT Analysis
- 12.1.12 Fujifilm Holdings Corporation
- 12.1.12.1. Company Overview
- 12.1.12.2. Products
- 12.1.12.3. Company Financials
- 12.1.12.4. SWOT Analysis
- 12.1.1 CJ CheilJedang Corporation (Batavia Biosciences)
- 12.2. Market Entropy
- 12.2.1 Company's Key Areas Served
- 12.2.2 Recent Developments
- 12.3. Company Market Share Analysis 2025
- 12.3.1 Top 5 Companies Market Share Analysis
- 12.3.2 Top 3 Companies Market Share Analysis
- 12.4. List of Potential Customers
- 13. Research Methodology
List of Figures
- Figure 1: Global Vaccine Contract Manufacturing Industry Revenue Breakdown (Million, %) by Region 2025 & 2033
- Figure 2: Global Vaccine Contract Manufacturing Industry Volume Breakdown (K Unit, %) by Region 2025 & 2033
- Figure 3: North America Vaccine Contract Manufacturing Industry Revenue (Million), by Vaccine Type 2025 & 2033
- Figure 4: North America Vaccine Contract Manufacturing Industry Volume (K Unit), by Vaccine Type 2025 & 2033
- Figure 5: North America Vaccine Contract Manufacturing Industry Revenue Share (%), by Vaccine Type 2025 & 2033
- Figure 6: North America Vaccine Contract Manufacturing Industry Volume Share (%), by Vaccine Type 2025 & 2033
- Figure 7: North America Vaccine Contract Manufacturing Industry Revenue (Million), by Process 2025 & 2033
- Figure 8: North America Vaccine Contract Manufacturing Industry Volume (K Unit), by Process 2025 & 2033
- Figure 9: North America Vaccine Contract Manufacturing Industry Revenue Share (%), by Process 2025 & 2033
- Figure 10: North America Vaccine Contract Manufacturing Industry Volume Share (%), by Process 2025 & 2033
- Figure 11: North America Vaccine Contract Manufacturing Industry Revenue (Million), by Scale of Operations 2025 & 2033
- Figure 12: North America Vaccine Contract Manufacturing Industry Volume (K Unit), by Scale of Operations 2025 & 2033
- Figure 13: North America Vaccine Contract Manufacturing Industry Revenue Share (%), by Scale of Operations 2025 & 2033
- Figure 14: North America Vaccine Contract Manufacturing Industry Volume Share (%), by Scale of Operations 2025 & 2033
- Figure 15: North America Vaccine Contract Manufacturing Industry Revenue (Million), by End Use 2025 & 2033
- Figure 16: North America Vaccine Contract Manufacturing Industry Volume (K Unit), by End Use 2025 & 2033
- Figure 17: North America Vaccine Contract Manufacturing Industry Revenue Share (%), by End Use 2025 & 2033
- Figure 18: North America Vaccine Contract Manufacturing Industry Volume Share (%), by End Use 2025 & 2033
- Figure 19: North America Vaccine Contract Manufacturing Industry Revenue (Million), by Country 2025 & 2033
- Figure 20: North America Vaccine Contract Manufacturing Industry Volume (K Unit), by Country 2025 & 2033
- Figure 21: North America Vaccine Contract Manufacturing Industry Revenue Share (%), by Country 2025 & 2033
- Figure 22: North America Vaccine Contract Manufacturing Industry Volume Share (%), by Country 2025 & 2033
- Figure 23: Europe Vaccine Contract Manufacturing Industry Revenue (Million), by Vaccine Type 2025 & 2033
- Figure 24: Europe Vaccine Contract Manufacturing Industry Volume (K Unit), by Vaccine Type 2025 & 2033
- Figure 25: Europe Vaccine Contract Manufacturing Industry Revenue Share (%), by Vaccine Type 2025 & 2033
- Figure 26: Europe Vaccine Contract Manufacturing Industry Volume Share (%), by Vaccine Type 2025 & 2033
- Figure 27: Europe Vaccine Contract Manufacturing Industry Revenue (Million), by Process 2025 & 2033
- Figure 28: Europe Vaccine Contract Manufacturing Industry Volume (K Unit), by Process 2025 & 2033
- Figure 29: Europe Vaccine Contract Manufacturing Industry Revenue Share (%), by Process 2025 & 2033
- Figure 30: Europe Vaccine Contract Manufacturing Industry Volume Share (%), by Process 2025 & 2033
- Figure 31: Europe Vaccine Contract Manufacturing Industry Revenue (Million), by Scale of Operations 2025 & 2033
- Figure 32: Europe Vaccine Contract Manufacturing Industry Volume (K Unit), by Scale of Operations 2025 & 2033
- Figure 33: Europe Vaccine Contract Manufacturing Industry Revenue Share (%), by Scale of Operations 2025 & 2033
- Figure 34: Europe Vaccine Contract Manufacturing Industry Volume Share (%), by Scale of Operations 2025 & 2033
- Figure 35: Europe Vaccine Contract Manufacturing Industry Revenue (Million), by End Use 2025 & 2033
- Figure 36: Europe Vaccine Contract Manufacturing Industry Volume (K Unit), by End Use 2025 & 2033
- Figure 37: Europe Vaccine Contract Manufacturing Industry Revenue Share (%), by End Use 2025 & 2033
- Figure 38: Europe Vaccine Contract Manufacturing Industry Volume Share (%), by End Use 2025 & 2033
- Figure 39: Europe Vaccine Contract Manufacturing Industry Revenue (Million), by Country 2025 & 2033
- Figure 40: Europe Vaccine Contract Manufacturing Industry Volume (K Unit), by Country 2025 & 2033
- Figure 41: Europe Vaccine Contract Manufacturing Industry Revenue Share (%), by Country 2025 & 2033
- Figure 42: Europe Vaccine Contract Manufacturing Industry Volume Share (%), by Country 2025 & 2033
- Figure 43: Asia Pacific Vaccine Contract Manufacturing Industry Revenue (Million), by Vaccine Type 2025 & 2033
- Figure 44: Asia Pacific Vaccine Contract Manufacturing Industry Volume (K Unit), by Vaccine Type 2025 & 2033
- Figure 45: Asia Pacific Vaccine Contract Manufacturing Industry Revenue Share (%), by Vaccine Type 2025 & 2033
- Figure 46: Asia Pacific Vaccine Contract Manufacturing Industry Volume Share (%), by Vaccine Type 2025 & 2033
- Figure 47: Asia Pacific Vaccine Contract Manufacturing Industry Revenue (Million), by Process 2025 & 2033
- Figure 48: Asia Pacific Vaccine Contract Manufacturing Industry Volume (K Unit), by Process 2025 & 2033
- Figure 49: Asia Pacific Vaccine Contract Manufacturing Industry Revenue Share (%), by Process 2025 & 2033
- Figure 50: Asia Pacific Vaccine Contract Manufacturing Industry Volume Share (%), by Process 2025 & 2033
- Figure 51: Asia Pacific Vaccine Contract Manufacturing Industry Revenue (Million), by Scale of Operations 2025 & 2033
- Figure 52: Asia Pacific Vaccine Contract Manufacturing Industry Volume (K Unit), by Scale of Operations 2025 & 2033
- Figure 53: Asia Pacific Vaccine Contract Manufacturing Industry Revenue Share (%), by Scale of Operations 2025 & 2033
- Figure 54: Asia Pacific Vaccine Contract Manufacturing Industry Volume Share (%), by Scale of Operations 2025 & 2033
- Figure 55: Asia Pacific Vaccine Contract Manufacturing Industry Revenue (Million), by End Use 2025 & 2033
- Figure 56: Asia Pacific Vaccine Contract Manufacturing Industry Volume (K Unit), by End Use 2025 & 2033
- Figure 57: Asia Pacific Vaccine Contract Manufacturing Industry Revenue Share (%), by End Use 2025 & 2033
- Figure 58: Asia Pacific Vaccine Contract Manufacturing Industry Volume Share (%), by End Use 2025 & 2033
- Figure 59: Asia Pacific Vaccine Contract Manufacturing Industry Revenue (Million), by Country 2025 & 2033
- Figure 60: Asia Pacific Vaccine Contract Manufacturing Industry Volume (K Unit), by Country 2025 & 2033
- Figure 61: Asia Pacific Vaccine Contract Manufacturing Industry Revenue Share (%), by Country 2025 & 2033
- Figure 62: Asia Pacific Vaccine Contract Manufacturing Industry Volume Share (%), by Country 2025 & 2033
- Figure 63: Middle East and Africa Vaccine Contract Manufacturing Industry Revenue (Million), by Vaccine Type 2025 & 2033
- Figure 64: Middle East and Africa Vaccine Contract Manufacturing Industry Volume (K Unit), by Vaccine Type 2025 & 2033
- Figure 65: Middle East and Africa Vaccine Contract Manufacturing Industry Revenue Share (%), by Vaccine Type 2025 & 2033
- Figure 66: Middle East and Africa Vaccine Contract Manufacturing Industry Volume Share (%), by Vaccine Type 2025 & 2033
- Figure 67: Middle East and Africa Vaccine Contract Manufacturing Industry Revenue (Million), by Process 2025 & 2033
- Figure 68: Middle East and Africa Vaccine Contract Manufacturing Industry Volume (K Unit), by Process 2025 & 2033
- Figure 69: Middle East and Africa Vaccine Contract Manufacturing Industry Revenue Share (%), by Process 2025 & 2033
- Figure 70: Middle East and Africa Vaccine Contract Manufacturing Industry Volume Share (%), by Process 2025 & 2033
- Figure 71: Middle East and Africa Vaccine Contract Manufacturing Industry Revenue (Million), by Scale of Operations 2025 & 2033
- Figure 72: Middle East and Africa Vaccine Contract Manufacturing Industry Volume (K Unit), by Scale of Operations 2025 & 2033
- Figure 73: Middle East and Africa Vaccine Contract Manufacturing Industry Revenue Share (%), by Scale of Operations 2025 & 2033
- Figure 74: Middle East and Africa Vaccine Contract Manufacturing Industry Volume Share (%), by Scale of Operations 2025 & 2033
- Figure 75: Middle East and Africa Vaccine Contract Manufacturing Industry Revenue (Million), by End Use 2025 & 2033
- Figure 76: Middle East and Africa Vaccine Contract Manufacturing Industry Volume (K Unit), by End Use 2025 & 2033
- Figure 77: Middle East and Africa Vaccine Contract Manufacturing Industry Revenue Share (%), by End Use 2025 & 2033
- Figure 78: Middle East and Africa Vaccine Contract Manufacturing Industry Volume Share (%), by End Use 2025 & 2033
- Figure 79: Middle East and Africa Vaccine Contract Manufacturing Industry Revenue (Million), by Country 2025 & 2033
- Figure 80: Middle East and Africa Vaccine Contract Manufacturing Industry Volume (K Unit), by Country 2025 & 2033
- Figure 81: Middle East and Africa Vaccine Contract Manufacturing Industry Revenue Share (%), by Country 2025 & 2033
- Figure 82: Middle East and Africa Vaccine Contract Manufacturing Industry Volume Share (%), by Country 2025 & 2033
- Figure 83: South America Vaccine Contract Manufacturing Industry Revenue (Million), by Vaccine Type 2025 & 2033
- Figure 84: South America Vaccine Contract Manufacturing Industry Volume (K Unit), by Vaccine Type 2025 & 2033
- Figure 85: South America Vaccine Contract Manufacturing Industry Revenue Share (%), by Vaccine Type 2025 & 2033
- Figure 86: South America Vaccine Contract Manufacturing Industry Volume Share (%), by Vaccine Type 2025 & 2033
- Figure 87: South America Vaccine Contract Manufacturing Industry Revenue (Million), by Process 2025 & 2033
- Figure 88: South America Vaccine Contract Manufacturing Industry Volume (K Unit), by Process 2025 & 2033
- Figure 89: South America Vaccine Contract Manufacturing Industry Revenue Share (%), by Process 2025 & 2033
- Figure 90: South America Vaccine Contract Manufacturing Industry Volume Share (%), by Process 2025 & 2033
- Figure 91: South America Vaccine Contract Manufacturing Industry Revenue (Million), by Scale of Operations 2025 & 2033
- Figure 92: South America Vaccine Contract Manufacturing Industry Volume (K Unit), by Scale of Operations 2025 & 2033
- Figure 93: South America Vaccine Contract Manufacturing Industry Revenue Share (%), by Scale of Operations 2025 & 2033
- Figure 94: South America Vaccine Contract Manufacturing Industry Volume Share (%), by Scale of Operations 2025 & 2033
- Figure 95: South America Vaccine Contract Manufacturing Industry Revenue (Million), by End Use 2025 & 2033
- Figure 96: South America Vaccine Contract Manufacturing Industry Volume (K Unit), by End Use 2025 & 2033
- Figure 97: South America Vaccine Contract Manufacturing Industry Revenue Share (%), by End Use 2025 & 2033
- Figure 98: South America Vaccine Contract Manufacturing Industry Volume Share (%), by End Use 2025 & 2033
- Figure 99: South America Vaccine Contract Manufacturing Industry Revenue (Million), by Country 2025 & 2033
- Figure 100: South America Vaccine Contract Manufacturing Industry Volume (K Unit), by Country 2025 & 2033
- Figure 101: South America Vaccine Contract Manufacturing Industry Revenue Share (%), by Country 2025 & 2033
- Figure 102: South America Vaccine Contract Manufacturing Industry Volume Share (%), by Country 2025 & 2033
List of Tables
- Table 1: Global Vaccine Contract Manufacturing Industry Revenue Million Forecast, by Vaccine Type 2020 & 2033
- Table 2: Global Vaccine Contract Manufacturing Industry Volume K Unit Forecast, by Vaccine Type 2020 & 2033
- Table 3: Global Vaccine Contract Manufacturing Industry Revenue Million Forecast, by Process 2020 & 2033
- Table 4: Global Vaccine Contract Manufacturing Industry Volume K Unit Forecast, by Process 2020 & 2033
- Table 5: Global Vaccine Contract Manufacturing Industry Revenue Million Forecast, by Scale of Operations 2020 & 2033
- Table 6: Global Vaccine Contract Manufacturing Industry Volume K Unit Forecast, by Scale of Operations 2020 & 2033
- Table 7: Global Vaccine Contract Manufacturing Industry Revenue Million Forecast, by End Use 2020 & 2033
- Table 8: Global Vaccine Contract Manufacturing Industry Volume K Unit Forecast, by End Use 2020 & 2033
- Table 9: Global Vaccine Contract Manufacturing Industry Revenue Million Forecast, by Region 2020 & 2033
- Table 10: Global Vaccine Contract Manufacturing Industry Volume K Unit Forecast, by Region 2020 & 2033
- Table 11: Global Vaccine Contract Manufacturing Industry Revenue Million Forecast, by Vaccine Type 2020 & 2033
- Table 12: Global Vaccine Contract Manufacturing Industry Volume K Unit Forecast, by Vaccine Type 2020 & 2033
- Table 13: Global Vaccine Contract Manufacturing Industry Revenue Million Forecast, by Process 2020 & 2033
- Table 14: Global Vaccine Contract Manufacturing Industry Volume K Unit Forecast, by Process 2020 & 2033
- Table 15: Global Vaccine Contract Manufacturing Industry Revenue Million Forecast, by Scale of Operations 2020 & 2033
- Table 16: Global Vaccine Contract Manufacturing Industry Volume K Unit Forecast, by Scale of Operations 2020 & 2033
- Table 17: Global Vaccine Contract Manufacturing Industry Revenue Million Forecast, by End Use 2020 & 2033
- Table 18: Global Vaccine Contract Manufacturing Industry Volume K Unit Forecast, by End Use 2020 & 2033
- Table 19: Global Vaccine Contract Manufacturing Industry Revenue Million Forecast, by Country 2020 & 2033
- Table 20: Global Vaccine Contract Manufacturing Industry Volume K Unit Forecast, by Country 2020 & 2033
- Table 21: United States Vaccine Contract Manufacturing Industry Revenue (Million) Forecast, by Application 2020 & 2033
- Table 22: United States Vaccine Contract Manufacturing Industry Volume (K Unit) Forecast, by Application 2020 & 2033
- Table 23: Canada Vaccine Contract Manufacturing Industry Revenue (Million) Forecast, by Application 2020 & 2033
- Table 24: Canada Vaccine Contract Manufacturing Industry Volume (K Unit) Forecast, by Application 2020 & 2033
- Table 25: Mexico Vaccine Contract Manufacturing Industry Revenue (Million) Forecast, by Application 2020 & 2033
- Table 26: Mexico Vaccine Contract Manufacturing Industry Volume (K Unit) Forecast, by Application 2020 & 2033
- Table 27: Global Vaccine Contract Manufacturing Industry Revenue Million Forecast, by Vaccine Type 2020 & 2033
- Table 28: Global Vaccine Contract Manufacturing Industry Volume K Unit Forecast, by Vaccine Type 2020 & 2033
- Table 29: Global Vaccine Contract Manufacturing Industry Revenue Million Forecast, by Process 2020 & 2033
- Table 30: Global Vaccine Contract Manufacturing Industry Volume K Unit Forecast, by Process 2020 & 2033
- Table 31: Global Vaccine Contract Manufacturing Industry Revenue Million Forecast, by Scale of Operations 2020 & 2033
- Table 32: Global Vaccine Contract Manufacturing Industry Volume K Unit Forecast, by Scale of Operations 2020 & 2033
- Table 33: Global Vaccine Contract Manufacturing Industry Revenue Million Forecast, by End Use 2020 & 2033
- Table 34: Global Vaccine Contract Manufacturing Industry Volume K Unit Forecast, by End Use 2020 & 2033
- Table 35: Global Vaccine Contract Manufacturing Industry Revenue Million Forecast, by Country 2020 & 2033
- Table 36: Global Vaccine Contract Manufacturing Industry Volume K Unit Forecast, by Country 2020 & 2033
- Table 37: Germany Vaccine Contract Manufacturing Industry Revenue (Million) Forecast, by Application 2020 & 2033
- Table 38: Germany Vaccine Contract Manufacturing Industry Volume (K Unit) Forecast, by Application 2020 & 2033
- Table 39: United Kingdom Vaccine Contract Manufacturing Industry Revenue (Million) Forecast, by Application 2020 & 2033
- Table 40: United Kingdom Vaccine Contract Manufacturing Industry Volume (K Unit) Forecast, by Application 2020 & 2033
- Table 41: France Vaccine Contract Manufacturing Industry Revenue (Million) Forecast, by Application 2020 & 2033
- Table 42: France Vaccine Contract Manufacturing Industry Volume (K Unit) Forecast, by Application 2020 & 2033
- Table 43: Italy Vaccine Contract Manufacturing Industry Revenue (Million) Forecast, by Application 2020 & 2033
- Table 44: Italy Vaccine Contract Manufacturing Industry Volume (K Unit) Forecast, by Application 2020 & 2033
- Table 45: Spain Vaccine Contract Manufacturing Industry Revenue (Million) Forecast, by Application 2020 & 2033
- Table 46: Spain Vaccine Contract Manufacturing Industry Volume (K Unit) Forecast, by Application 2020 & 2033
- Table 47: Rest of Europe Vaccine Contract Manufacturing Industry Revenue (Million) Forecast, by Application 2020 & 2033
- Table 48: Rest of Europe Vaccine Contract Manufacturing Industry Volume (K Unit) Forecast, by Application 2020 & 2033
- Table 49: Global Vaccine Contract Manufacturing Industry Revenue Million Forecast, by Vaccine Type 2020 & 2033
- Table 50: Global Vaccine Contract Manufacturing Industry Volume K Unit Forecast, by Vaccine Type 2020 & 2033
- Table 51: Global Vaccine Contract Manufacturing Industry Revenue Million Forecast, by Process 2020 & 2033
- Table 52: Global Vaccine Contract Manufacturing Industry Volume K Unit Forecast, by Process 2020 & 2033
- Table 53: Global Vaccine Contract Manufacturing Industry Revenue Million Forecast, by Scale of Operations 2020 & 2033
- Table 54: Global Vaccine Contract Manufacturing Industry Volume K Unit Forecast, by Scale of Operations 2020 & 2033
- Table 55: Global Vaccine Contract Manufacturing Industry Revenue Million Forecast, by End Use 2020 & 2033
- Table 56: Global Vaccine Contract Manufacturing Industry Volume K Unit Forecast, by End Use 2020 & 2033
- Table 57: Global Vaccine Contract Manufacturing Industry Revenue Million Forecast, by Country 2020 & 2033
- Table 58: Global Vaccine Contract Manufacturing Industry Volume K Unit Forecast, by Country 2020 & 2033
- Table 59: China Vaccine Contract Manufacturing Industry Revenue (Million) Forecast, by Application 2020 & 2033
- Table 60: China Vaccine Contract Manufacturing Industry Volume (K Unit) Forecast, by Application 2020 & 2033
- Table 61: Japan Vaccine Contract Manufacturing Industry Revenue (Million) Forecast, by Application 2020 & 2033
- Table 62: Japan Vaccine Contract Manufacturing Industry Volume (K Unit) Forecast, by Application 2020 & 2033
- Table 63: India Vaccine Contract Manufacturing Industry Revenue (Million) Forecast, by Application 2020 & 2033
- Table 64: India Vaccine Contract Manufacturing Industry Volume (K Unit) Forecast, by Application 2020 & 2033
- Table 65: Australia Vaccine Contract Manufacturing Industry Revenue (Million) Forecast, by Application 2020 & 2033
- Table 66: Australia Vaccine Contract Manufacturing Industry Volume (K Unit) Forecast, by Application 2020 & 2033
- Table 67: South Korea Vaccine Contract Manufacturing Industry Revenue (Million) Forecast, by Application 2020 & 2033
- Table 68: South Korea Vaccine Contract Manufacturing Industry Volume (K Unit) Forecast, by Application 2020 & 2033
- Table 69: Rest of Asia Pacific Vaccine Contract Manufacturing Industry Revenue (Million) Forecast, by Application 2020 & 2033
- Table 70: Rest of Asia Pacific Vaccine Contract Manufacturing Industry Volume (K Unit) Forecast, by Application 2020 & 2033
- Table 71: Global Vaccine Contract Manufacturing Industry Revenue Million Forecast, by Vaccine Type 2020 & 2033
- Table 72: Global Vaccine Contract Manufacturing Industry Volume K Unit Forecast, by Vaccine Type 2020 & 2033
- Table 73: Global Vaccine Contract Manufacturing Industry Revenue Million Forecast, by Process 2020 & 2033
- Table 74: Global Vaccine Contract Manufacturing Industry Volume K Unit Forecast, by Process 2020 & 2033
- Table 75: Global Vaccine Contract Manufacturing Industry Revenue Million Forecast, by Scale of Operations 2020 & 2033
- Table 76: Global Vaccine Contract Manufacturing Industry Volume K Unit Forecast, by Scale of Operations 2020 & 2033
- Table 77: Global Vaccine Contract Manufacturing Industry Revenue Million Forecast, by End Use 2020 & 2033
- Table 78: Global Vaccine Contract Manufacturing Industry Volume K Unit Forecast, by End Use 2020 & 2033
- Table 79: Global Vaccine Contract Manufacturing Industry Revenue Million Forecast, by Country 2020 & 2033
- Table 80: Global Vaccine Contract Manufacturing Industry Volume K Unit Forecast, by Country 2020 & 2033
- Table 81: GCC Vaccine Contract Manufacturing Industry Revenue (Million) Forecast, by Application 2020 & 2033
- Table 82: GCC Vaccine Contract Manufacturing Industry Volume (K Unit) Forecast, by Application 2020 & 2033
- Table 83: South Africa Vaccine Contract Manufacturing Industry Revenue (Million) Forecast, by Application 2020 & 2033
- Table 84: South Africa Vaccine Contract Manufacturing Industry Volume (K Unit) Forecast, by Application 2020 & 2033
- Table 85: Rest of Middle East and Africa Vaccine Contract Manufacturing Industry Revenue (Million) Forecast, by Application 2020 & 2033
- Table 86: Rest of Middle East and Africa Vaccine Contract Manufacturing Industry Volume (K Unit) Forecast, by Application 2020 & 2033
- Table 87: Global Vaccine Contract Manufacturing Industry Revenue Million Forecast, by Vaccine Type 2020 & 2033
- Table 88: Global Vaccine Contract Manufacturing Industry Volume K Unit Forecast, by Vaccine Type 2020 & 2033
- Table 89: Global Vaccine Contract Manufacturing Industry Revenue Million Forecast, by Process 2020 & 2033
- Table 90: Global Vaccine Contract Manufacturing Industry Volume K Unit Forecast, by Process 2020 & 2033
- Table 91: Global Vaccine Contract Manufacturing Industry Revenue Million Forecast, by Scale of Operations 2020 & 2033
- Table 92: Global Vaccine Contract Manufacturing Industry Volume K Unit Forecast, by Scale of Operations 2020 & 2033
- Table 93: Global Vaccine Contract Manufacturing Industry Revenue Million Forecast, by End Use 2020 & 2033
- Table 94: Global Vaccine Contract Manufacturing Industry Volume K Unit Forecast, by End Use 2020 & 2033
- Table 95: Global Vaccine Contract Manufacturing Industry Revenue Million Forecast, by Country 2020 & 2033
- Table 96: Global Vaccine Contract Manufacturing Industry Volume K Unit Forecast, by Country 2020 & 2033
- Table 97: Brazil Vaccine Contract Manufacturing Industry Revenue (Million) Forecast, by Application 2020 & 2033
- Table 98: Brazil Vaccine Contract Manufacturing Industry Volume (K Unit) Forecast, by Application 2020 & 2033
- Table 99: Argentina Vaccine Contract Manufacturing Industry Revenue (Million) Forecast, by Application 2020 & 2033
- Table 100: Argentina Vaccine Contract Manufacturing Industry Volume (K Unit) Forecast, by Application 2020 & 2033
- Table 101: Rest of South America Vaccine Contract Manufacturing Industry Revenue (Million) Forecast, by Application 2020 & 2033
- Table 102: Rest of South America Vaccine Contract Manufacturing Industry Volume (K Unit) Forecast, by Application 2020 & 2033
Frequently Asked Questions
1. What is the projected Compound Annual Growth Rate (CAGR) of the Vaccine Contract Manufacturing Industry?
The projected CAGR is approximately 11.18%.
2. Which companies are prominent players in the Vaccine Contract Manufacturing Industry?
Key companies in the market include CJ CheilJedang Corporation (Batavia Biosciences), Curia Global, ICON PLC, Charles River Laboratories International Inc, Catalent, IDT Biologika GmbH, Lonza Group AG, Gedeon Richter (Richter-Helm BioLogics), Ajinomoto Bio-Pharma Services, Recipharm AB, Emergent BioSolutions Inc, Fujifilm Holdings Corporation.
3. What are the main segments of the Vaccine Contract Manufacturing Industry?
The market segments include Vaccine Type, Process, Scale of Operations, End Use.
4. Can you provide details about the market size?
The market size is estimated to be USD 3.51 Million as of 2022.
5. What are some drivers contributing to market growth?
Advancements in Technology and Cost Benefits in Infrastructure and Operational Benefits; Increase in Initiatives Favoring Vaccinations; Favorable Patient Demographics and Growing Vaccinations of Newborns and Children.
6. What are the notable trends driving market growth?
The Inactivated Vaccines Segment is Expected to Hold a Significant Share in the Vaccine Contract Manufacturing Market over the Forecast Period.
7. Are there any restraints impacting market growth?
Rising High Costs of Vaccines; Lack of Storage Infrastructure and Limitations Associated with Supply Chain.
8. Can you provide examples of recent developments in the market?
August 2022: Moderna inked an agreement with the Canadian government to construct a messenger RNA vaccine manufacturing factory in an undetermined location in Canada. According to the biotech firm, the partnership will give Canadians access to mRNA vaccines made in Canada against respiratory viruses such as SARS-CoV-2, influenza, and respiratory syncytial virus.
9. What pricing options are available for accessing the report?
Pricing options include single-user, multi-user, and enterprise licenses priced at USD 4750, USD 5250, and USD 8750 respectively.
10. Is the market size provided in terms of value or volume?
The market size is provided in terms of value, measured in Million and volume, measured in K Unit.
11. Are there any specific market keywords associated with the report?
Yes, the market keyword associated with the report is "Vaccine Contract Manufacturing Industry," which aids in identifying and referencing the specific market segment covered.
12. How do I determine which pricing option suits my needs best?
The pricing options vary based on user requirements and access needs. Individual users may opt for single-user licenses, while businesses requiring broader access may choose multi-user or enterprise licenses for cost-effective access to the report.
13. Are there any additional resources or data provided in the Vaccine Contract Manufacturing Industry report?
While the report offers comprehensive insights, it's advisable to review the specific contents or supplementary materials provided to ascertain if additional resources or data are available.
14. How can I stay updated on further developments or reports in the Vaccine Contract Manufacturing Industry?
To stay informed about further developments, trends, and reports in the Vaccine Contract Manufacturing Industry, consider subscribing to industry newsletters, following relevant companies and organizations, or regularly checking reputable industry news sources and publications.
Methodology
Step 1 - Identification of Relevant Samples Size from Population Database


Step 2 - Approaches for Defining Global Market Size (Value, Volume* & Price*)

Note*: In applicable scenarios
Step 3 - Data Sources
Primary Research
- Web Analytics
- Survey Reports
- Research Institute
- Latest Research Reports
- Opinion Leaders
Secondary Research
- Annual Reports
- White Paper
- Latest Press Release
- Industry Association
- Paid Database
- Investor Presentations

Step 4 - Data Triangulation
Involves using different sources of information in order to increase the validity of a study
These sources are likely to be stakeholders in a program - participants, other researchers, program staff, other community members, and so on.
Then we put all data in single framework & apply various statistical tools to find out the dynamic on the market.
During the analysis stage, feedback from the stakeholder groups would be compared to determine areas of agreement as well as areas of divergence