

Key Insights
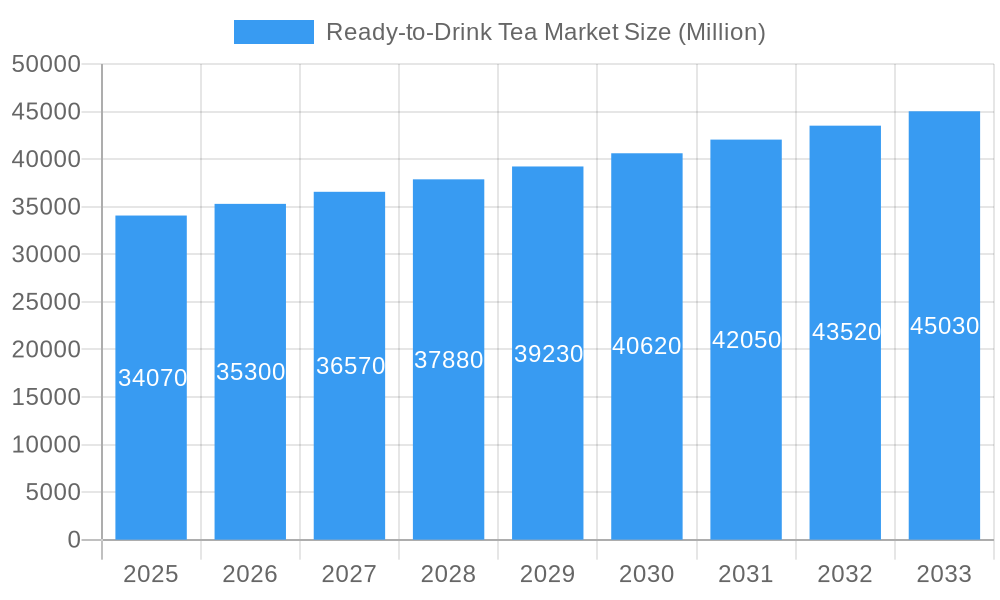
The Ready-to-Drink (RTD) tea market, valued at $34,070 million in 2025, is projected to experience steady growth, driven by several key factors. The increasing consumer preference for healthy and convenient beverages fuels the demand for RTD tea, particularly among health-conscious millennials and Gen Z. The rising popularity of functional beverages, incorporating ingredients like antioxidants and vitamins, further enhances market appeal. Convenience, a crucial factor in today's fast-paced lifestyle, makes RTD tea a preferred choice over brewing tea at home. Furthermore, product innovation, such as the introduction of new flavors, organic options, and functional additions, caters to evolving consumer tastes and preferences, driving market expansion. The market is segmented by tea type (green, herbal, others) and distribution channel (supermarkets/hypermarkets, convenience stores, online stores, others), reflecting diverse consumption patterns and retail strategies. Major players like Ito En, PepsiCo, and Nestlé are actively involved in product development and market penetration, indicating a highly competitive landscape. Regional variations exist, with North America and Asia-Pacific expected to be leading markets due to high tea consumption and strong growth potential.
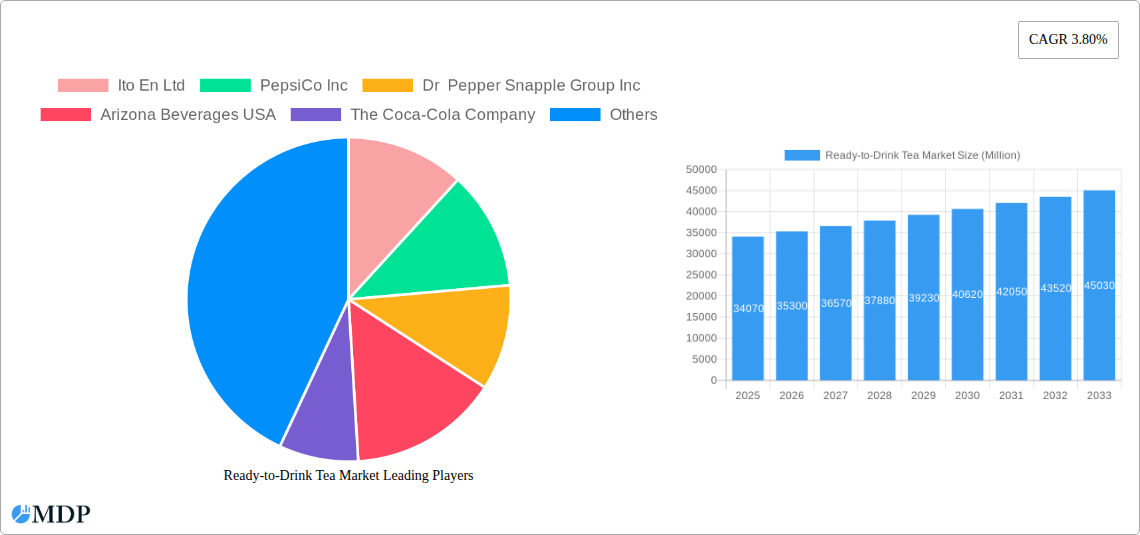
Ready-to-Drink Tea Market Market Size (In Billion)
The projected Compound Annual Growth Rate (CAGR) of 3.80% suggests a consistent upward trajectory for the RTD tea market through 2033. However, certain restraints exist, including fluctuating raw material prices and increased competition from other beverage categories. The sustainability concerns surrounding packaging materials present a challenge to the industry, necessitating eco-friendly packaging solutions. Despite these challenges, the long-term outlook remains positive, driven by ongoing innovation, health-conscious consumer behavior, and the expanding distribution network, particularly e-commerce, which offers increased accessibility and convenience. Market segmentation strategies, focusing on specific consumer segments and regional preferences, will remain crucial for manufacturers to maintain a competitive edge in this evolving market. The ongoing focus on premiumization and functional benefits will further contribute to the market's overall growth trajectory.
Ready-to-Drink Tea Market Company Market Share
Ready-to-Drink Tea Market: A Comprehensive Report (2019-2033)
This comprehensive report provides a detailed analysis of the global Ready-to-Drink (RTD) Tea market, offering invaluable insights for industry stakeholders, investors, and strategic decision-makers. Covering the historical period (2019-2024), base year (2025), and forecast period (2025-2033), this report delves deep into market dynamics, trends, and future prospects, projecting a market value exceeding xx Million by 2033.
Ready-to-Drink Tea Market Dynamics & Concentration
The RTD tea market exhibits a moderately consolidated structure, with key players like Ito En Ltd, PepsiCo Inc, Dr Pepper Snapple Group Inc, and The Coca-Cola Company holding significant market share. However, the market also accommodates numerous smaller regional players and emerging brands. Innovation, particularly in flavors, functional ingredients (e.g., vitamins, probiotics), and sustainable packaging, is a key driver of growth. Regulatory frameworks concerning labeling, ingredients, and health claims influence market dynamics. The market faces competition from other beverage categories, including fruit juices, energy drinks, and bottled water. Mergers and acquisitions (M&A) activity, as evidenced by PepsiCo's acquisition of KeVita in 2023, are reshaping the competitive landscape. The total number of M&A deals in the RTD tea sector between 2019 and 2024 was approximately xx, contributing to market consolidation and expansion of product portfolios. Market share data for key players is presented in detail within the full report, demonstrating a xx% market share for the top five players in 2024.
Ready-to-Drink Tea Market Industry Trends & Analysis
The RTD tea market is experiencing robust growth, driven by several factors. Health-conscious consumers are increasingly opting for RTD tea as a healthier alternative to sugary drinks. The rising prevalence of health-conscious lifestyles fuels the demand for functional teas fortified with vitamins, minerals, and probiotics, thereby driving market penetration and expansion. Technological advancements in packaging and preservation methods are extending shelf life and improving product quality. Consumer preferences are evolving, with a growing demand for unique and exotic tea flavors and blends. The market demonstrates a healthy Compound Annual Growth Rate (CAGR) of xx% during the historical period, reflecting the strong market appeal. The competitive landscape is characterized by both fierce competition among established players and the emergence of innovative niche brands, further driving market diversification.
Leading Markets & Segments in Ready-to-Drink Tea Market
The Asia-Pacific region currently dominates the global RTD tea market, fueled by high tea consumption, strong economic growth, and expanding distribution networks. Within this region, countries like China and Japan are key contributors to overall market volume. Green tea constitutes the largest segment by type, accounting for approximately xx% of total market share in 2024, while the herbal tea segment displays promising growth potential. Supermarket/hypermarkets remain the leading distribution channel due to their extensive reach and established supply chains, however, online stores are rapidly gaining traction, driving omnichannel expansion.
- Key Drivers for Asia-Pacific Dominance:
- High tea consumption culture
- Rapid economic growth driving increased disposable income
- Well-established distribution networks
- Favorable government policies promoting domestic tea industry
Ready-to-Drink Tea Market Product Developments
Recent product innovations emphasize functional benefits, such as enhanced immunity or improved digestive health. Ready-to-drink teas are increasingly incorporating natural ingredients, organic certifications, and sustainable packaging to meet evolving consumer preferences. The introduction of innovative flavors, customized packaging, and convenient formats are key competitive advantages in this sector. Technological trends center around improved shelf-life technologies, and the development of more sustainable packaging options.
Key Drivers of Ready-to-Drink Tea Market Growth
The RTD tea market's growth is propelled by several factors. Health consciousness amongst consumers drives the demand for healthier alternatives, while technological advancements in packaging and flavor enhancement expand market opportunities. Favorable economic conditions in emerging markets contribute to increased purchasing power, thereby expanding market penetration. Government regulations promoting healthier beverage options further stimulate market growth.
Challenges in the Ready-to-Drink Tea Market
Challenges facing the RTD tea market include intense competition, fluctuating raw material prices, and stringent regulatory compliance requirements. Maintaining a robust supply chain, especially for organic or specific tea varieties, poses logistical hurdles. The market also needs to address the sustainability concerns relating to plastic waste from packaging. The total impact of these challenges on market growth is estimated to be a xx% reduction in projected growth for 2025.
Emerging Opportunities in the Ready-to-Drink Tea Market
Emerging opportunities lie in expanding into new geographic markets, particularly in Africa and Latin America, which showcase untapped potential. Strategic partnerships with health and wellness brands can create synergistic opportunities and reach wider consumer bases. Technological innovations in sustainable packaging and flavor creation hold the key to future market growth and expansion.
Leading Players in the Ready-to-Drink Tea Market Sector
- Ito En Ltd
- PepsiCo Inc
- Dr Pepper Snapple Group Inc
- Arizona Beverages USA
- The Coca-Cola Company
- Monster Beverage
- Nestlé SA
- Suntory Holdings Limited
- Unilever PLC
- Tata Global Beverages
Key Milestones in Ready-to-Drink Tea Market Industry
- 2022: Ito En Ltd launched a new line of ready-to-drink green teas with added vitamins and minerals.
- 2023: PepsiCo Inc acquired KeVita, a leading producer of fermented probiotic tea drinks.
- 2024: Dr Pepper Snapple Group Inc launched a new line of ready-to-drink teas made with real fruit juice.
Strategic Outlook for Ready-to-Drink Tea Market
The RTD tea market presents substantial growth potential, driven by evolving consumer preferences and innovative product developments. Strategic focus on sustainability, functional benefits, and expansion into new markets are key to capturing future opportunities. The market is poised for continued expansion, with a projected market value of xx Million by 2033, showcasing the significant potential for both established and emerging players.
Ready-to-Drink Tea Market Segmentation
-
1. Type
- 1.1. Green Tea
- 1.2. Herbal Tea
- 1.3. Others
-
2. Distribution Channel
- 2.1. Supermarket/Hypermarket
- 2.2. Convenience Stores
- 2.3. Online Stores
- 2.4. Others
-
3. Geography
- 3.1. Brazil
- 3.2. Argentina
- 3.3. Rest of South America
Ready-to-Drink Tea Market Segmentation By Geography
- 1. Brazil
- 2. Argentina
- 3. Rest of South America
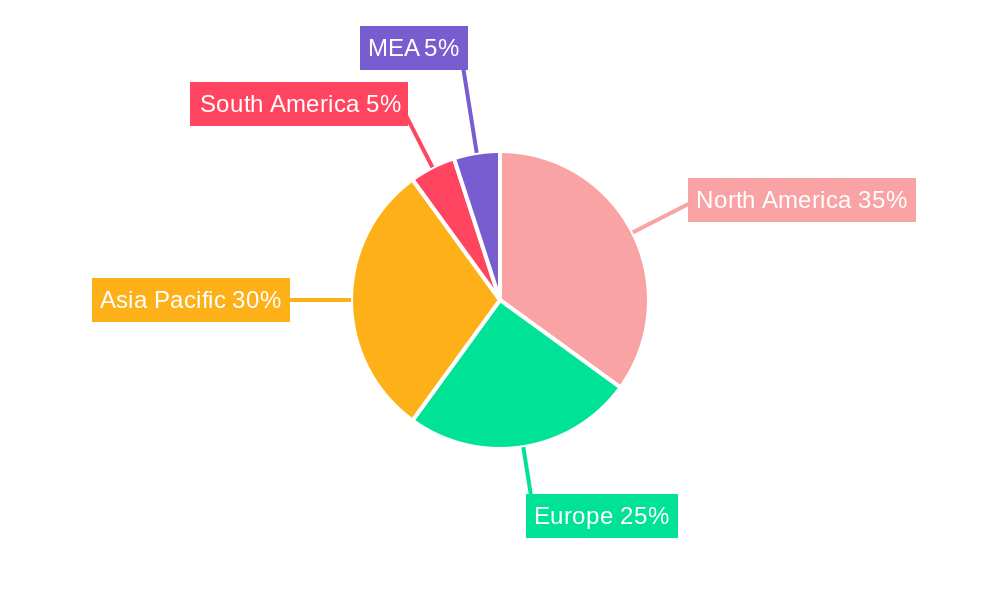
Ready-to-Drink Tea Market Regional Market Share
Geographic Coverage of Ready-to-Drink Tea Market
Ready-to-Drink Tea Market REPORT HIGHLIGHTS
| Aspects | Details |
|---|---|
| Study Period | 2020-2034 |
| Base Year | 2025 |
| Estimated Year | 2026 |
| Forecast Period | 2026-2034 |
| Historical Period | 2020-2025 |
| Growth Rate | CAGR of 3.80% from 2020-2034 |
| Segmentation |
|
Table of Contents
- 1. Introduction
- 1.1. Research Scope
- 1.2. Market Segmentation
- 1.3. Research Objective
- 1.4. Definitions and Assumptions
- 2. Executive Summary
- 2.1. Market Snapshot
- 3. Market Dynamics
- 3.1. Market Drivers
- 3.2. Market Restrains
- 3.3. Market Trends
- 3.4. Market Opportunities
- 4. Market Factor Analysis
- 4.1. Porters Five Forces
- 4.1.1. Bargaining Power of Suppliers
- 4.1.2. Bargaining Power of Buyers
- 4.1.3. Threat of New Entrants
- 4.1.4. Threat of Substitutes
- 4.1.5. Competitive Rivalry
- 4.2. PESTEL analysis
- 4.3. BCG Analysis
- 4.3.1. Stars (High Growth, High Market Share)
- 4.3.2. Cash Cows (Low Growth, High Market Share)
- 4.3.3. Question Mark (High Growth, Low Market Share)
- 4.3.4. Dogs (Low Growth, Low Market Share)
- 4.4. Ansoff Matrix Analysis
- 4.5. Supply Chain Analysis
- 4.6. Regulatory Landscape
- 4.7. Current Market Potential and Opportunity Assessment (TAM–SAM–SOM Framework)
- 4.8. MDP Analyst Note
- 4.1. Porters Five Forces
- 5. Market Analysis, Insights and Forecast 2021-2033
- 5.1. Market Analysis, Insights and Forecast - by Type
- 5.1.1. Green Tea
- 5.1.2. Herbal Tea
- 5.1.3. Others
- 5.2. Market Analysis, Insights and Forecast - by Distribution Channel
- 5.2.1. Supermarket/Hypermarket
- 5.2.2. Convenience Stores
- 5.2.3. Online Stores
- 5.2.4. Others
- 5.3. Market Analysis, Insights and Forecast - by Geography
- 5.3.1. Brazil
- 5.3.2. Argentina
- 5.3.3. Rest of South America
- 5.4. Market Analysis, Insights and Forecast - by Region
- 5.4.1. Brazil
- 5.4.2. Argentina
- 5.4.3. Rest of South America
- 5.1. Market Analysis, Insights and Forecast - by Type
- 6. Global Ready-to-Drink Tea Market Analysis, Insights and Forecast, 2021-2033
- 6.1. Market Analysis, Insights and Forecast - by Type
- 6.1.1. Green Tea
- 6.1.2. Herbal Tea
- 6.1.3. Others
- 6.2. Market Analysis, Insights and Forecast - by Distribution Channel
- 6.2.1. Supermarket/Hypermarket
- 6.2.2. Convenience Stores
- 6.2.3. Online Stores
- 6.2.4. Others
- 6.3. Market Analysis, Insights and Forecast - by Geography
- 6.3.1. Brazil
- 6.3.2. Argentina
- 6.3.3. Rest of South America
- 6.1. Market Analysis, Insights and Forecast - by Type
- 7. Brazil Ready-to-Drink Tea Market Analysis, Insights and Forecast, 2020-2032
- 7.1. Market Analysis, Insights and Forecast - by Type
- 7.1.1. Green Tea
- 7.1.2. Herbal Tea
- 7.1.3. Others
- 7.2. Market Analysis, Insights and Forecast - by Distribution Channel
- 7.2.1. Supermarket/Hypermarket
- 7.2.2. Convenience Stores
- 7.2.3. Online Stores
- 7.2.4. Others
- 7.3. Market Analysis, Insights and Forecast - by Geography
- 7.3.1. Brazil
- 7.3.2. Argentina
- 7.3.3. Rest of South America
- 7.1. Market Analysis, Insights and Forecast - by Type
- 8. Argentina Ready-to-Drink Tea Market Analysis, Insights and Forecast, 2020-2032
- 8.1. Market Analysis, Insights and Forecast - by Type
- 8.1.1. Green Tea
- 8.1.2. Herbal Tea
- 8.1.3. Others
- 8.2. Market Analysis, Insights and Forecast - by Distribution Channel
- 8.2.1. Supermarket/Hypermarket
- 8.2.2. Convenience Stores
- 8.2.3. Online Stores
- 8.2.4. Others
- 8.3. Market Analysis, Insights and Forecast - by Geography
- 8.3.1. Brazil
- 8.3.2. Argentina
- 8.3.3. Rest of South America
- 8.1. Market Analysis, Insights and Forecast - by Type
- 9. Rest of South America Ready-to-Drink Tea Market Analysis, Insights and Forecast, 2020-2032
- 9.1. Market Analysis, Insights and Forecast - by Type
- 9.1.1. Green Tea
- 9.1.2. Herbal Tea
- 9.1.3. Others
- 9.2. Market Analysis, Insights and Forecast - by Distribution Channel
- 9.2.1. Supermarket/Hypermarket
- 9.2.2. Convenience Stores
- 9.2.3. Online Stores
- 9.2.4. Others
- 9.3. Market Analysis, Insights and Forecast - by Geography
- 9.3.1. Brazil
- 9.3.2. Argentina
- 9.3.3. Rest of South America
- 9.1. Market Analysis, Insights and Forecast - by Type
- 10. Competitive Analysis
- 10.1. Company Profiles
- 10.1.1 Ito En Ltd
- 10.1.1.1. Company Overview
- 10.1.1.2. Products
- 10.1.1.3. Company Financials
- 10.1.1.4. SWOT Analysis
- 10.1.2 PepsiCo Inc
- 10.1.2.1. Company Overview
- 10.1.2.2. Products
- 10.1.2.3. Company Financials
- 10.1.2.4. SWOT Analysis
- 10.1.3 Dr Pepper Snapple Group Inc
- 10.1.3.1. Company Overview
- 10.1.3.2. Products
- 10.1.3.3. Company Financials
- 10.1.3.4. SWOT Analysis
- 10.1.4 Arizona Beverages USA
- 10.1.4.1. Company Overview
- 10.1.4.2. Products
- 10.1.4.3. Company Financials
- 10.1.4.4. SWOT Analysis
- 10.1.5 The Coca-Cola Company
- 10.1.5.1. Company Overview
- 10.1.5.2. Products
- 10.1.5.3. Company Financials
- 10.1.5.4. SWOT Analysis
- 10.1.6 Monster Beverage*List Not Exhaustive
- 10.1.6.1. Company Overview
- 10.1.6.2. Products
- 10.1.6.3. Company Financials
- 10.1.6.4. SWOT Analysis
- 10.1.7 Nestlé SA
- 10.1.7.1. Company Overview
- 10.1.7.2. Products
- 10.1.7.3. Company Financials
- 10.1.7.4. SWOT Analysis
- 10.1.8 Suntory Holdings Limited
- 10.1.8.1. Company Overview
- 10.1.8.2. Products
- 10.1.8.3. Company Financials
- 10.1.8.4. SWOT Analysis
- 10.1.9 Unilever PLC
- 10.1.9.1. Company Overview
- 10.1.9.2. Products
- 10.1.9.3. Company Financials
- 10.1.9.4. SWOT Analysis
- 10.1.10 Tata Global Beverages
- 10.1.10.1. Company Overview
- 10.1.10.2. Products
- 10.1.10.3. Company Financials
- 10.1.10.4. SWOT Analysis
- 10.1.1 Ito En Ltd
- 10.2. Market Entropy
- 10.2.1 Company's Key Areas Served
- 10.2.2 Recent Developments
- 10.3. Company Market Share Analysis 2025
- 10.3.1 Top 5 Companies Market Share Analysis
- 10.3.2 Top 3 Companies Market Share Analysis
- 10.4. List of Potential Customers
- 11. Research Methodology
List of Figures
- Figure 1: Global Ready-to-Drink Tea Market Revenue Breakdown (Million, %) by Region 2025 & 2033
- Figure 2: Global Ready-to-Drink Tea Market Volume Breakdown (K Tons, %) by Region 2025 & 2033
- Figure 3: Brazil Ready-to-Drink Tea Market Revenue (Million), by Type 2025 & 2033
- Figure 4: Brazil Ready-to-Drink Tea Market Volume (K Tons), by Type 2025 & 2033
- Figure 5: Brazil Ready-to-Drink Tea Market Revenue Share (%), by Type 2025 & 2033
- Figure 6: Brazil Ready-to-Drink Tea Market Volume Share (%), by Type 2025 & 2033
- Figure 7: Brazil Ready-to-Drink Tea Market Revenue (Million), by Distribution Channel 2025 & 2033
- Figure 8: Brazil Ready-to-Drink Tea Market Volume (K Tons), by Distribution Channel 2025 & 2033
- Figure 9: Brazil Ready-to-Drink Tea Market Revenue Share (%), by Distribution Channel 2025 & 2033
- Figure 10: Brazil Ready-to-Drink Tea Market Volume Share (%), by Distribution Channel 2025 & 2033
- Figure 11: Brazil Ready-to-Drink Tea Market Revenue (Million), by Geography 2025 & 2033
- Figure 12: Brazil Ready-to-Drink Tea Market Volume (K Tons), by Geography 2025 & 2033
- Figure 13: Brazil Ready-to-Drink Tea Market Revenue Share (%), by Geography 2025 & 2033
- Figure 14: Brazil Ready-to-Drink Tea Market Volume Share (%), by Geography 2025 & 2033
- Figure 15: Brazil Ready-to-Drink Tea Market Revenue (Million), by Country 2025 & 2033
- Figure 16: Brazil Ready-to-Drink Tea Market Volume (K Tons), by Country 2025 & 2033
- Figure 17: Brazil Ready-to-Drink Tea Market Revenue Share (%), by Country 2025 & 2033
- Figure 18: Brazil Ready-to-Drink Tea Market Volume Share (%), by Country 2025 & 2033
- Figure 19: Argentina Ready-to-Drink Tea Market Revenue (Million), by Type 2025 & 2033
- Figure 20: Argentina Ready-to-Drink Tea Market Volume (K Tons), by Type 2025 & 2033
- Figure 21: Argentina Ready-to-Drink Tea Market Revenue Share (%), by Type 2025 & 2033
- Figure 22: Argentina Ready-to-Drink Tea Market Volume Share (%), by Type 2025 & 2033
- Figure 23: Argentina Ready-to-Drink Tea Market Revenue (Million), by Distribution Channel 2025 & 2033
- Figure 24: Argentina Ready-to-Drink Tea Market Volume (K Tons), by Distribution Channel 2025 & 2033
- Figure 25: Argentina Ready-to-Drink Tea Market Revenue Share (%), by Distribution Channel 2025 & 2033
- Figure 26: Argentina Ready-to-Drink Tea Market Volume Share (%), by Distribution Channel 2025 & 2033
- Figure 27: Argentina Ready-to-Drink Tea Market Revenue (Million), by Geography 2025 & 2033
- Figure 28: Argentina Ready-to-Drink Tea Market Volume (K Tons), by Geography 2025 & 2033
- Figure 29: Argentina Ready-to-Drink Tea Market Revenue Share (%), by Geography 2025 & 2033
- Figure 30: Argentina Ready-to-Drink Tea Market Volume Share (%), by Geography 2025 & 2033
- Figure 31: Argentina Ready-to-Drink Tea Market Revenue (Million), by Country 2025 & 2033
- Figure 32: Argentina Ready-to-Drink Tea Market Volume (K Tons), by Country 2025 & 2033
- Figure 33: Argentina Ready-to-Drink Tea Market Revenue Share (%), by Country 2025 & 2033
- Figure 34: Argentina Ready-to-Drink Tea Market Volume Share (%), by Country 2025 & 2033
- Figure 35: Rest of South America Ready-to-Drink Tea Market Revenue (Million), by Type 2025 & 2033
- Figure 36: Rest of South America Ready-to-Drink Tea Market Volume (K Tons), by Type 2025 & 2033
- Figure 37: Rest of South America Ready-to-Drink Tea Market Revenue Share (%), by Type 2025 & 2033
- Figure 38: Rest of South America Ready-to-Drink Tea Market Volume Share (%), by Type 2025 & 2033
- Figure 39: Rest of South America Ready-to-Drink Tea Market Revenue (Million), by Distribution Channel 2025 & 2033
- Figure 40: Rest of South America Ready-to-Drink Tea Market Volume (K Tons), by Distribution Channel 2025 & 2033
- Figure 41: Rest of South America Ready-to-Drink Tea Market Revenue Share (%), by Distribution Channel 2025 & 2033
- Figure 42: Rest of South America Ready-to-Drink Tea Market Volume Share (%), by Distribution Channel 2025 & 2033
- Figure 43: Rest of South America Ready-to-Drink Tea Market Revenue (Million), by Geography 2025 & 2033
- Figure 44: Rest of South America Ready-to-Drink Tea Market Volume (K Tons), by Geography 2025 & 2033
- Figure 45: Rest of South America Ready-to-Drink Tea Market Revenue Share (%), by Geography 2025 & 2033
- Figure 46: Rest of South America Ready-to-Drink Tea Market Volume Share (%), by Geography 2025 & 2033
- Figure 47: Rest of South America Ready-to-Drink Tea Market Revenue (Million), by Country 2025 & 2033
- Figure 48: Rest of South America Ready-to-Drink Tea Market Volume (K Tons), by Country 2025 & 2033
- Figure 49: Rest of South America Ready-to-Drink Tea Market Revenue Share (%), by Country 2025 & 2033
- Figure 50: Rest of South America Ready-to-Drink Tea Market Volume Share (%), by Country 2025 & 2033
List of Tables
- Table 1: Global Ready-to-Drink Tea Market Revenue Million Forecast, by Type 2020 & 2033
- Table 2: Global Ready-to-Drink Tea Market Volume K Tons Forecast, by Type 2020 & 2033
- Table 3: Global Ready-to-Drink Tea Market Revenue Million Forecast, by Distribution Channel 2020 & 2033
- Table 4: Global Ready-to-Drink Tea Market Volume K Tons Forecast, by Distribution Channel 2020 & 2033
- Table 5: Global Ready-to-Drink Tea Market Revenue Million Forecast, by Geography 2020 & 2033
- Table 6: Global Ready-to-Drink Tea Market Volume K Tons Forecast, by Geography 2020 & 2033
- Table 7: Global Ready-to-Drink Tea Market Revenue Million Forecast, by Region 2020 & 2033
- Table 8: Global Ready-to-Drink Tea Market Volume K Tons Forecast, by Region 2020 & 2033
- Table 9: Global Ready-to-Drink Tea Market Revenue Million Forecast, by Type 2020 & 2033
- Table 10: Global Ready-to-Drink Tea Market Volume K Tons Forecast, by Type 2020 & 2033
- Table 11: Global Ready-to-Drink Tea Market Revenue Million Forecast, by Distribution Channel 2020 & 2033
- Table 12: Global Ready-to-Drink Tea Market Volume K Tons Forecast, by Distribution Channel 2020 & 2033
- Table 13: Global Ready-to-Drink Tea Market Revenue Million Forecast, by Geography 2020 & 2033
- Table 14: Global Ready-to-Drink Tea Market Volume K Tons Forecast, by Geography 2020 & 2033
- Table 15: Global Ready-to-Drink Tea Market Revenue Million Forecast, by Country 2020 & 2033
- Table 16: Global Ready-to-Drink Tea Market Volume K Tons Forecast, by Country 2020 & 2033
- Table 17: Global Ready-to-Drink Tea Market Revenue Million Forecast, by Type 2020 & 2033
- Table 18: Global Ready-to-Drink Tea Market Volume K Tons Forecast, by Type 2020 & 2033
- Table 19: Global Ready-to-Drink Tea Market Revenue Million Forecast, by Distribution Channel 2020 & 2033
- Table 20: Global Ready-to-Drink Tea Market Volume K Tons Forecast, by Distribution Channel 2020 & 2033
- Table 21: Global Ready-to-Drink Tea Market Revenue Million Forecast, by Geography 2020 & 2033
- Table 22: Global Ready-to-Drink Tea Market Volume K Tons Forecast, by Geography 2020 & 2033
- Table 23: Global Ready-to-Drink Tea Market Revenue Million Forecast, by Country 2020 & 2033
- Table 24: Global Ready-to-Drink Tea Market Volume K Tons Forecast, by Country 2020 & 2033
- Table 25: Global Ready-to-Drink Tea Market Revenue Million Forecast, by Type 2020 & 2033
- Table 26: Global Ready-to-Drink Tea Market Volume K Tons Forecast, by Type 2020 & 2033
- Table 27: Global Ready-to-Drink Tea Market Revenue Million Forecast, by Distribution Channel 2020 & 2033
- Table 28: Global Ready-to-Drink Tea Market Volume K Tons Forecast, by Distribution Channel 2020 & 2033
- Table 29: Global Ready-to-Drink Tea Market Revenue Million Forecast, by Geography 2020 & 2033
- Table 30: Global Ready-to-Drink Tea Market Volume K Tons Forecast, by Geography 2020 & 2033
- Table 31: Global Ready-to-Drink Tea Market Revenue Million Forecast, by Country 2020 & 2033
- Table 32: Global Ready-to-Drink Tea Market Volume K Tons Forecast, by Country 2020 & 2033
Frequently Asked Questions
1. What is the projected Compound Annual Growth Rate (CAGR) of the Ready-to-Drink Tea Market?
The projected CAGR is approximately 3.80%.
2. Which companies are prominent players in the Ready-to-Drink Tea Market?
Key companies in the market include Ito En Ltd, PepsiCo Inc, Dr Pepper Snapple Group Inc, Arizona Beverages USA, The Coca-Cola Company, Monster Beverage*List Not Exhaustive, Nestlé SA , Suntory Holdings Limited , Unilever PLC , Tata Global Beverages.
3. What are the main segments of the Ready-to-Drink Tea Market?
The market segments include Type, Distribution Channel, Geography.
4. Can you provide details about the market size?
The market size is estimated to be USD 34070 Million as of 2022.
5. What are some drivers contributing to market growth?
Increasing demand for meat alternatives.
6. What are the notable trends driving market growth?
Supermarket/ Hypermarket is the Most Preferred Sales Channel.
7. Are there any restraints impacting market growth?
Presence of numerous alternatives in the plant proteins.
8. Can you provide examples of recent developments in the market?
In 2022, Ito En Ltd launched a new line of ready-to-drink green teas with added vitamins and minerals.
9. What pricing options are available for accessing the report?
Pricing options include single-user, multi-user, and enterprise licenses priced at USD 4750, USD 5250, and USD 8750 respectively.
10. Is the market size provided in terms of value or volume?
The market size is provided in terms of value, measured in Million and volume, measured in K Tons.
11. Are there any specific market keywords associated with the report?
Yes, the market keyword associated with the report is "Ready-to-Drink Tea Market," which aids in identifying and referencing the specific market segment covered.
12. How do I determine which pricing option suits my needs best?
The pricing options vary based on user requirements and access needs. Individual users may opt for single-user licenses, while businesses requiring broader access may choose multi-user or enterprise licenses for cost-effective access to the report.
13. Are there any additional resources or data provided in the Ready-to-Drink Tea Market report?
While the report offers comprehensive insights, it's advisable to review the specific contents or supplementary materials provided to ascertain if additional resources or data are available.
14. How can I stay updated on further developments or reports in the Ready-to-Drink Tea Market?
To stay informed about further developments, trends, and reports in the Ready-to-Drink Tea Market, consider subscribing to industry newsletters, following relevant companies and organizations, or regularly checking reputable industry news sources and publications.
Methodology
Step 1 - Identification of Relevant Samples Size from Population Database


Step 2 - Approaches for Defining Global Market Size (Value, Volume* & Price*)

Note*: In applicable scenarios
Step 3 - Data Sources
Primary Research
- Web Analytics
- Survey Reports
- Research Institute
- Latest Research Reports
- Opinion Leaders
Secondary Research
- Annual Reports
- White Paper
- Latest Press Release
- Industry Association
- Paid Database
- Investor Presentations

Step 4 - Data Triangulation
Involves using different sources of information in order to increase the validity of a study
These sources are likely to be stakeholders in a program - participants, other researchers, program staff, other community members, and so on.
Then we put all data in single framework & apply various statistical tools to find out the dynamic on the market.
During the analysis stage, feedback from the stakeholder groups would be compared to determine areas of agreement as well as areas of divergence