

Key Insights
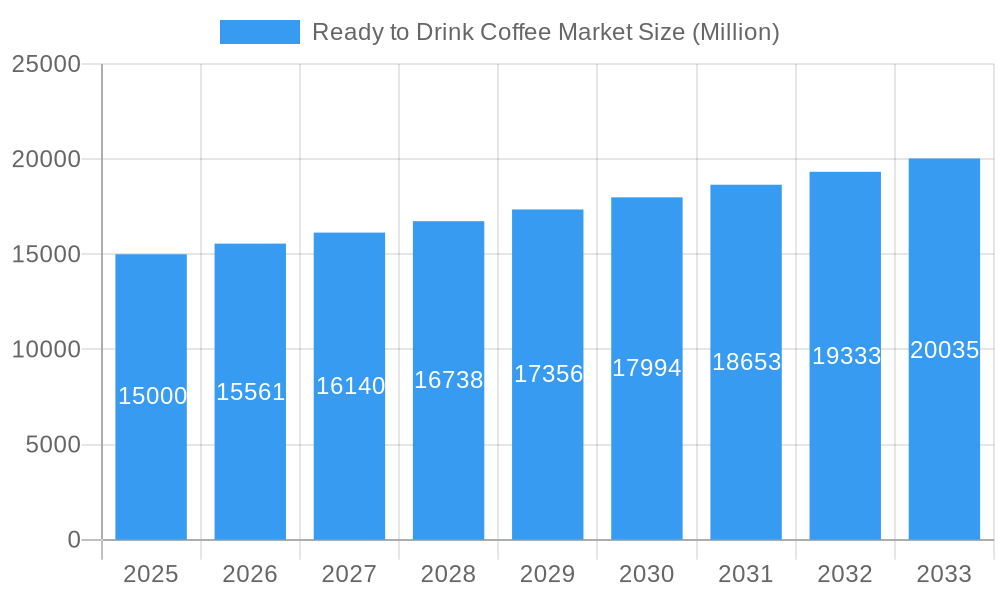
The Ready-to-Drink (RTD) coffee market is experiencing robust growth, projected to reach a substantial size by 2033. A 3.72% CAGR indicates a consistent expansion driven by several key factors. The increasing demand for convenient and on-the-go beverage options fuels this growth, particularly among younger demographics. Health-conscious consumers are driving the popularity of cold brew and iced coffee variations, while innovations in packaging (aseptic, glass bottles, metal cans, and PET bottles) cater to diverse preferences and enhance shelf life. The market segmentation reveals strong performance across various distribution channels—both off-trade (retail stores, supermarkets) and on-trade (cafes, restaurants)—with significant regional variations. North America and Europe are currently leading markets, benefiting from established coffee cultures and high disposable incomes. However, the Asia-Pacific region is demonstrating rapid growth potential due to rising urbanization and increasing coffee consumption. While premiumization and brand loyalty are influencing the higher-priced segments, the broader market continues to benefit from the affordability and accessibility of RTD coffee. The competitive landscape involves both established beverage giants and specialized coffee brands, resulting in innovation and product diversification. Challenges include managing supply chain complexities and fluctuating raw material costs, but overall, the outlook for the RTD coffee market remains positive.
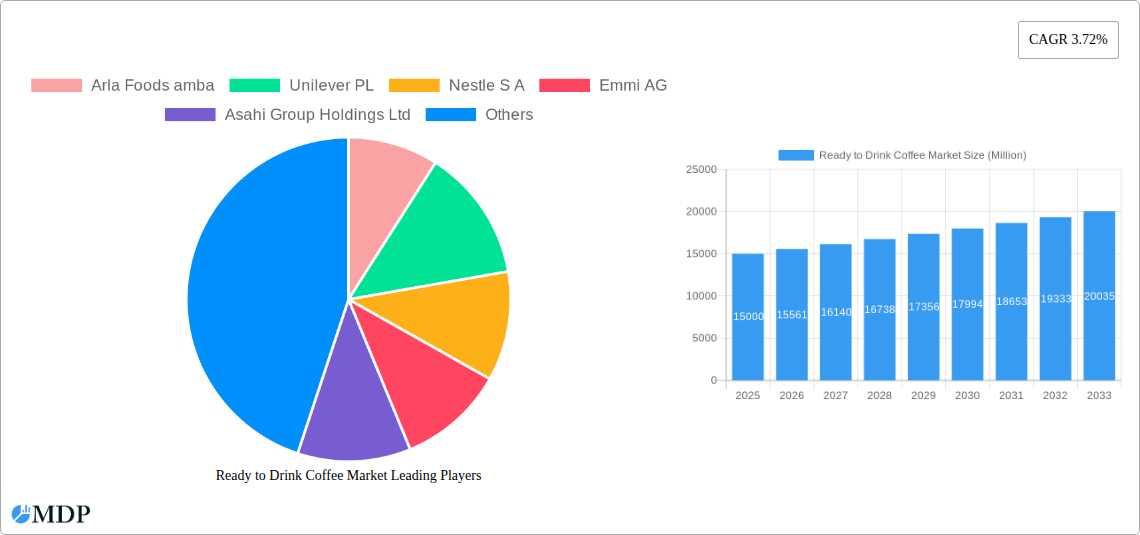
Ready to Drink Coffee Market Market Size (In Billion)
The market's growth is further influenced by shifting consumer preferences. The rising popularity of functional beverages, including those with added vitamins or antioxidants, is driving innovation within the RTD coffee sector. Furthermore, sustainability concerns are impacting packaging choices, pushing companies to adopt eco-friendly options. The competitive landscape necessitates continuous product development and marketing strategies to capture market share. Key players are investing in premiumization strategies, introducing unique flavors, and focusing on convenient packaging formats to cater to the evolving consumer demands. Regional disparities in growth rates suggest opportunities for market expansion in developing economies with growing middle classes and increased coffee consumption habits. Overall, the RTD coffee market is poised for continued expansion, fueled by evolving consumer preferences, product innovation, and strategic market penetration.
Ready to Drink Coffee Market Company Market Share
Ready-to-Drink Coffee Market Report: 2019-2033
This comprehensive report provides an in-depth analysis of the Ready-to-Drink (RTD) coffee market, offering invaluable insights for industry stakeholders, investors, and strategic planners. Covering the period 2019-2033, with a base year of 2025, this report meticulously examines market dynamics, trends, leading players, and future opportunities. The analysis encompasses key segments including distribution channels (off-trade and on-trade), coffee types (hot, cold, iced, and other RTD coffee products), and packaging types (aseptic packages, glass bottles, metal cans, and PET bottles). Projected market value for 2025 is estimated at xx Million and the forecast period extends to 2033.
Ready to Drink Coffee Market Dynamics & Concentration
The RTD coffee market exhibits a moderately concentrated landscape, with key players like Nestlé S.A., Unilever PL, and The Coca-Cola Company holding significant market share. However, the market is also witnessing increased competition from smaller, niche players focusing on innovative product offerings and sustainable practices. Market concentration is further shaped by mergers and acquisitions (M&A) activity, with xx M&A deals recorded between 2019 and 2024. The average market share of the top 5 players in 2024 was approximately xx%.
Innovation is a key driver, with companies investing heavily in developing new flavors, formats, and functional RTD coffee products catering to evolving consumer preferences. Regulatory frameworks concerning labeling, ingredients, and sustainability are also influencing market dynamics. The market faces competition from alternative beverage options, such as tea and energy drinks, impacting overall market growth. End-user trends, such as the growing preference for premium and organic coffee, are shaping product development strategies.
- Market Concentration: Moderately concentrated, with a few dominant players.
- Innovation Drivers: New flavors, functional benefits, sustainable packaging.
- Regulatory Frameworks: Impacting labeling, ingredients, and sustainability.
- Product Substitutes: Tea, energy drinks, and other beverages.
- End-user Trends: Growing demand for premium, organic, and functional coffee.
- M&A Activity: xx M&A deals between 2019 and 2024, shaping market consolidation.
Ready to Drink Coffee Market Industry Trends & Analysis
The RTD coffee market is experiencing robust growth, driven by several key factors. The rising popularity of convenient, on-the-go beverages fuels significant demand, while technological advancements in brewing and packaging enhance product quality and shelf life. Consumer preferences are shifting towards healthier and more sustainable options, prompting the development of organic, low-sugar, and ethically sourced RTD coffee products. Intense competition among established players and emerging brands further drives innovation and affordability. The CAGR for the RTD coffee market during the historical period (2019-2024) was xx%, and it's projected to be xx% during the forecast period (2025-2033). Market penetration in key regions is estimated to reach xx% by 2033.
Leading Markets & Segments in Ready to Drink Coffee Market
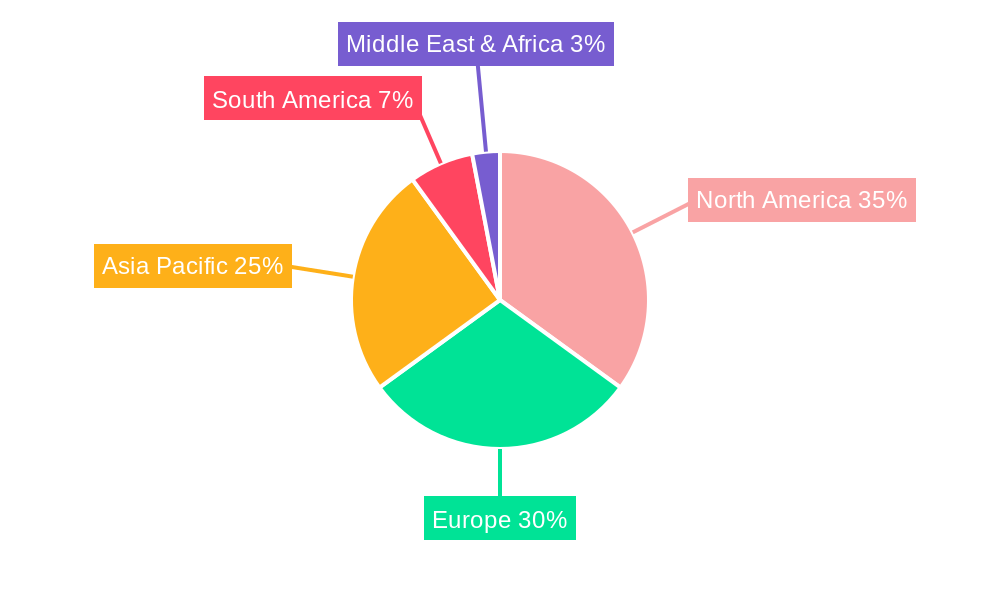
The RTD coffee market shows significant regional variations. North America and Europe currently dominate, driven by high coffee consumption, established distribution networks, and strong consumer spending. However, Asia-Pacific is experiencing the fastest growth, fueled by rising disposable incomes and changing lifestyles.
- Dominant Region: North America and Europe currently hold the largest market share.
- Fastest-Growing Region: Asia-Pacific exhibits the highest growth rate.
Key Segment Analysis:
- Distribution Channel: The off-trade channel (retail stores, supermarkets) holds a larger market share compared to the on-trade channel (cafes, restaurants).
- Coffee Type: Iced coffee and cold brew coffee are the fastest-growing segments, driven by consumer preference for refreshing beverages.
- Packaging Type: PET bottles are the most widely used packaging format due to their cost-effectiveness and convenience.
Drivers for Regional Dominance:
- North America/Europe: High coffee consumption, well-established distribution networks, strong consumer spending power, and a mature market.
- Asia-Pacific: Rapid economic growth, rising disposable incomes, and a growing young population driving demand for convenient beverages.
Ready to Drink Coffee Market Product Developments
Recent product innovations in the RTD coffee market focus on enhancing convenience, taste, and health benefits. Companies are introducing new flavors, functional ingredients (e.g., added protein, vitamins), and sustainable packaging options. Technological advancements in brewing and extraction methods are improving coffee quality and reducing waste. This emphasis on product differentiation is crucial for capturing market share in a highly competitive landscape.
Key Drivers of Ready to Drink Coffee Market Growth
The growth of the RTD coffee market is fueled by several factors. Technological advancements, such as improved brewing technologies and shelf-stable packaging, play a critical role. Economic factors, including rising disposable incomes and increased consumer spending on premium beverages, drive market expansion. Supportive regulatory frameworks encourage innovation and the introduction of new products.
Challenges in the Ready to Drink Coffee Market
The RTD coffee market faces several challenges. Regulatory hurdles, such as stringent labeling requirements and ingredient restrictions, can increase production costs. Supply chain disruptions can affect raw material availability and increase prices. Intense competition from established players and new entrants creates pressure on margins and profitability. The impact of these challenges is reflected in xx% reduced profit margins for some key players in the past year.
Emerging Opportunities in Ready to Drink Coffee Market
Several factors present significant opportunities for growth. Technological breakthroughs in sustainable packaging and new brewing methods create possibilities for product innovation. Strategic partnerships between coffee companies and technology providers enhance efficiency and product development. Market expansion into emerging economies presents immense potential for significant growth.
Leading Players in the Ready to Drink Coffee Market Sector
Key Milestones in Ready to Drink Coffee Market Industry
- July 2023: Keurig Dr. Pepper Inc. announced a strategic partnership with La Colombe, strengthening its position in the RTD coffee market.
- July 2023: Nestlé Thailand launched new NESCAFÉ GOLD Creama Craft Latte and Americano, expanding its product portfolio.
- December 2023: Costa Coffee plans to open five new outlets in Morocco, indicating market expansion in emerging regions.
Strategic Outlook for Ready to Drink Coffee Market Market
The RTD coffee market is poised for continued growth, driven by innovation, changing consumer preferences, and market expansion into new geographical areas. Strategic partnerships, product diversification, and sustainable practices will be crucial for success in this competitive landscape. The future of the RTD coffee market lies in offering convenient, high-quality, and sustainable products that cater to evolving consumer demands.
Ready to Drink Coffee Market Segmentation
-
1. Soft Drink Type
- 1.1. Cold Brew Coffee
- 1.2. Iced coffee
- 1.3. Other RTD Coffee
-
2. Packaging Type
- 2.1. Aseptic packages
- 2.2. Glass Bottles
- 2.3. Metal Can
- 2.4. PET Bottles
-
3. Distribution Channel
-
3.1. Off-trade
- 3.1.1. Convenience Stores
- 3.1.2. Online Retail
- 3.1.3. Specialty Stores
- 3.1.4. Supermarket/Hypermarket
- 3.1.5. Others
- 3.2. On-trade
-
3.1. Off-trade
Ready to Drink Coffee Market Segmentation By Geography
-
1. North America
- 1.1. United States
- 1.2. Canada
- 1.3. Mexico
-
2. South America
- 2.1. Brazil
- 2.2. Argentina
- 2.3. Rest of South America
-
3. Europe
- 3.1. United Kingdom
- 3.2. Germany
- 3.3. France
- 3.4. Italy
- 3.5. Spain
- 3.6. Russia
- 3.7. Benelux
- 3.8. Nordics
- 3.9. Rest of Europe
-
4. Middle East & Africa
- 4.1. Turkey
- 4.2. Israel
- 4.3. GCC
- 4.4. North Africa
- 4.5. South Africa
- 4.6. Rest of Middle East & Africa
-
5. Asia Pacific
- 5.1. China
- 5.2. India
- 5.3. Japan
- 5.4. South Korea
- 5.5. ASEAN
- 5.6. Oceania
- 5.7. Rest of Asia Pacific
Ready to Drink Coffee Market Regional Market Share
Geographic Coverage of Ready to Drink Coffee Market
Ready to Drink Coffee Market REPORT HIGHLIGHTS
| Aspects | Details |
|---|---|
| Study Period | 2020-2034 |
| Base Year | 2025 |
| Estimated Year | 2026 |
| Forecast Period | 2026-2034 |
| Historical Period | 2020-2025 |
| Growth Rate | CAGR of 5.99% from 2020-2034 |
| Segmentation |
|
Table of Contents
- 1. Introduction
- 1.1. Research Scope
- 1.2. Market Segmentation
- 1.3. Research Objective
- 1.4. Definitions and Assumptions
- 2. Executive Summary
- 2.1. Market Snapshot
- 3. Market Dynamics
- 3.1. Market Drivers
- 3.2. Market Restrains
- 3.3. Market Trends
- 3.4. Market Opportunities
- 4. Market Factor Analysis
- 4.1. Porters Five Forces
- 4.1.1. Bargaining Power of Suppliers
- 4.1.2. Bargaining Power of Buyers
- 4.1.3. Threat of New Entrants
- 4.1.4. Threat of Substitutes
- 4.1.5. Competitive Rivalry
- 4.2. PESTEL analysis
- 4.3. BCG Analysis
- 4.3.1. Stars (High Growth, High Market Share)
- 4.3.2. Cash Cows (Low Growth, High Market Share)
- 4.3.3. Question Mark (High Growth, Low Market Share)
- 4.3.4. Dogs (Low Growth, Low Market Share)
- 4.4. Ansoff Matrix Analysis
- 4.5. Supply Chain Analysis
- 4.6. Regulatory Landscape
- 4.7. Current Market Potential and Opportunity Assessment (TAM–SAM–SOM Framework)
- 4.8. MDP Analyst Note
- 4.1. Porters Five Forces
- 5. Market Analysis, Insights and Forecast 2021-2033
- 5.1. Market Analysis, Insights and Forecast - by Soft Drink Type
- 5.1.1. Cold Brew Coffee
- 5.1.2. Iced coffee
- 5.1.3. Other RTD Coffee
- 5.2. Market Analysis, Insights and Forecast - by Packaging Type
- 5.2.1. Aseptic packages
- 5.2.2. Glass Bottles
- 5.2.3. Metal Can
- 5.2.4. PET Bottles
- 5.3. Market Analysis, Insights and Forecast - by Distribution Channel
- 5.3.1. Off-trade
- 5.3.1.1. Convenience Stores
- 5.3.1.2. Online Retail
- 5.3.1.3. Specialty Stores
- 5.3.1.4. Supermarket/Hypermarket
- 5.3.1.5. Others
- 5.3.2. On-trade
- 5.3.1. Off-trade
- 5.4. Market Analysis, Insights and Forecast - by Region
- 5.4.1. North America
- 5.4.2. South America
- 5.4.3. Europe
- 5.4.4. Middle East & Africa
- 5.4.5. Asia Pacific
- 5.1. Market Analysis, Insights and Forecast - by Soft Drink Type
- 6. Global Ready to Drink Coffee Market Analysis, Insights and Forecast, 2021-2033
- 6.1. Market Analysis, Insights and Forecast - by Soft Drink Type
- 6.1.1. Cold Brew Coffee
- 6.1.2. Iced coffee
- 6.1.3. Other RTD Coffee
- 6.2. Market Analysis, Insights and Forecast - by Packaging Type
- 6.2.1. Aseptic packages
- 6.2.2. Glass Bottles
- 6.2.3. Metal Can
- 6.2.4. PET Bottles
- 6.3. Market Analysis, Insights and Forecast - by Distribution Channel
- 6.3.1. Off-trade
- 6.3.1.1. Convenience Stores
- 6.3.1.2. Online Retail
- 6.3.1.3. Specialty Stores
- 6.3.1.4. Supermarket/Hypermarket
- 6.3.1.5. Others
- 6.3.2. On-trade
- 6.3.1. Off-trade
- 6.1. Market Analysis, Insights and Forecast - by Soft Drink Type
- 7. North America Ready to Drink Coffee Market Analysis, Insights and Forecast, 2020-2032
- 7.1. Market Analysis, Insights and Forecast - by Soft Drink Type
- 7.1.1. Cold Brew Coffee
- 7.1.2. Iced coffee
- 7.1.3. Other RTD Coffee
- 7.2. Market Analysis, Insights and Forecast - by Packaging Type
- 7.2.1. Aseptic packages
- 7.2.2. Glass Bottles
- 7.2.3. Metal Can
- 7.2.4. PET Bottles
- 7.3. Market Analysis, Insights and Forecast - by Distribution Channel
- 7.3.1. Off-trade
- 7.3.1.1. Convenience Stores
- 7.3.1.2. Online Retail
- 7.3.1.3. Specialty Stores
- 7.3.1.4. Supermarket/Hypermarket
- 7.3.1.5. Others
- 7.3.2. On-trade
- 7.3.1. Off-trade
- 7.1. Market Analysis, Insights and Forecast - by Soft Drink Type
- 8. South America Ready to Drink Coffee Market Analysis, Insights and Forecast, 2020-2032
- 8.1. Market Analysis, Insights and Forecast - by Soft Drink Type
- 8.1.1. Cold Brew Coffee
- 8.1.2. Iced coffee
- 8.1.3. Other RTD Coffee
- 8.2. Market Analysis, Insights and Forecast - by Packaging Type
- 8.2.1. Aseptic packages
- 8.2.2. Glass Bottles
- 8.2.3. Metal Can
- 8.2.4. PET Bottles
- 8.3. Market Analysis, Insights and Forecast - by Distribution Channel
- 8.3.1. Off-trade
- 8.3.1.1. Convenience Stores
- 8.3.1.2. Online Retail
- 8.3.1.3. Specialty Stores
- 8.3.1.4. Supermarket/Hypermarket
- 8.3.1.5. Others
- 8.3.2. On-trade
- 8.3.1. Off-trade
- 8.1. Market Analysis, Insights and Forecast - by Soft Drink Type
- 9. Europe Ready to Drink Coffee Market Analysis, Insights and Forecast, 2020-2032
- 9.1. Market Analysis, Insights and Forecast - by Soft Drink Type
- 9.1.1. Cold Brew Coffee
- 9.1.2. Iced coffee
- 9.1.3. Other RTD Coffee
- 9.2. Market Analysis, Insights and Forecast - by Packaging Type
- 9.2.1. Aseptic packages
- 9.2.2. Glass Bottles
- 9.2.3. Metal Can
- 9.2.4. PET Bottles
- 9.3. Market Analysis, Insights and Forecast - by Distribution Channel
- 9.3.1. Off-trade
- 9.3.1.1. Convenience Stores
- 9.3.1.2. Online Retail
- 9.3.1.3. Specialty Stores
- 9.3.1.4. Supermarket/Hypermarket
- 9.3.1.5. Others
- 9.3.2. On-trade
- 9.3.1. Off-trade
- 9.1. Market Analysis, Insights and Forecast - by Soft Drink Type
- 10. Middle East & Africa Ready to Drink Coffee Market Analysis, Insights and Forecast, 2020-2032
- 10.1. Market Analysis, Insights and Forecast - by Soft Drink Type
- 10.1.1. Cold Brew Coffee
- 10.1.2. Iced coffee
- 10.1.3. Other RTD Coffee
- 10.2. Market Analysis, Insights and Forecast - by Packaging Type
- 10.2.1. Aseptic packages
- 10.2.2. Glass Bottles
- 10.2.3. Metal Can
- 10.2.4. PET Bottles
- 10.3. Market Analysis, Insights and Forecast - by Distribution Channel
- 10.3.1. Off-trade
- 10.3.1.1. Convenience Stores
- 10.3.1.2. Online Retail
- 10.3.1.3. Specialty Stores
- 10.3.1.4. Supermarket/Hypermarket
- 10.3.1.5. Others
- 10.3.2. On-trade
- 10.3.1. Off-trade
- 10.1. Market Analysis, Insights and Forecast - by Soft Drink Type
- 11. Asia Pacific Ready to Drink Coffee Market Analysis, Insights and Forecast, 2020-2032
- 11.1. Market Analysis, Insights and Forecast - by Soft Drink Type
- 11.1.1. Cold Brew Coffee
- 11.1.2. Iced coffee
- 11.1.3. Other RTD Coffee
- 11.2. Market Analysis, Insights and Forecast - by Packaging Type
- 11.2.1. Aseptic packages
- 11.2.2. Glass Bottles
- 11.2.3. Metal Can
- 11.2.4. PET Bottles
- 11.3. Market Analysis, Insights and Forecast - by Distribution Channel
- 11.3.1. Off-trade
- 11.3.1.1. Convenience Stores
- 11.3.1.2. Online Retail
- 11.3.1.3. Specialty Stores
- 11.3.1.4. Supermarket/Hypermarket
- 11.3.1.5. Others
- 11.3.2. On-trade
- 11.3.1. Off-trade
- 11.1. Market Analysis, Insights and Forecast - by Soft Drink Type
- 12. Competitive Analysis
- 12.1. Company Profiles
- 12.1.1 Arla Foods amba
- 12.1.1.1. Company Overview
- 12.1.1.2. Products
- 12.1.1.3. Company Financials
- 12.1.1.4. SWOT Analysis
- 12.1.2 Unilever PL
- 12.1.2.1. Company Overview
- 12.1.2.2. Products
- 12.1.2.3. Company Financials
- 12.1.2.4. SWOT Analysis
- 12.1.3 Nestle S A
- 12.1.3.1. Company Overview
- 12.1.3.2. Products
- 12.1.3.3. Company Financials
- 12.1.3.4. SWOT Analysis
- 12.1.4 Emmi AG
- 12.1.4.1. Company Overview
- 12.1.4.2. Products
- 12.1.4.3. Company Financials
- 12.1.4.4. SWOT Analysis
- 12.1.5 Asahi Group Holdings Ltd
- 12.1.5.1. Company Overview
- 12.1.5.2. Products
- 12.1.5.3. Company Financials
- 12.1.5.4. SWOT Analysis
- 12.1.6 PepsiCo Inc
- 12.1.6.1. Company Overview
- 12.1.6.2. Products
- 12.1.6.3. Company Financials
- 12.1.6.4. SWOT Analysis
- 12.1.7 Rauch Fruchtsäfte GmbH & Co OG
- 12.1.7.1. Company Overview
- 12.1.7.2. Products
- 12.1.7.3. Company Financials
- 12.1.7.4. SWOT Analysis
- 12.1.8 DyDo Group HoldingsInc
- 12.1.8.1. Company Overview
- 12.1.8.2. Products
- 12.1.8.3. Company Financials
- 12.1.8.4. SWOT Analysis
- 12.1.9 Suntory Holdings Limited
- 12.1.9.1. Company Overview
- 12.1.9.2. Products
- 12.1.9.3. Company Financials
- 12.1.9.4. SWOT Analysis
- 12.1.10 Luigi Lavazza S p A
- 12.1.10.1. Company Overview
- 12.1.10.2. Products
- 12.1.10.3. Company Financials
- 12.1.10.4. SWOT Analysis
- 12.1.11 Keurig Dr Pepper Inc
- 12.1.11.1. Company Overview
- 12.1.11.2. Products
- 12.1.11.3. Company Financials
- 12.1.11.4. SWOT Analysis
- 12.1.12 Danone S A
- 12.1.12.1. Company Overview
- 12.1.12.2. Products
- 12.1.12.3. Company Financials
- 12.1.12.4. SWOT Analysis
- 12.1.13 The Coca-Cola Company
- 12.1.13.1. Company Overview
- 12.1.13.2. Products
- 12.1.13.3. Company Financials
- 12.1.13.4. SWOT Analysis
- 12.1.14 Kirin Holdings Company Limited
- 12.1.14.1. Company Overview
- 12.1.14.2. Products
- 12.1.14.3. Company Financials
- 12.1.14.4. SWOT Analysis
- 12.1.15 Sodiaal Union
- 12.1.15.1. Company Overview
- 12.1.15.2. Products
- 12.1.15.3. Company Financials
- 12.1.15.4. SWOT Analysis
- 12.1.1 Arla Foods amba
- 12.2. Market Entropy
- 12.2.1 Company's Key Areas Served
- 12.2.2 Recent Developments
- 12.3. Company Market Share Analysis 2025
- 12.3.1 Top 5 Companies Market Share Analysis
- 12.3.2 Top 3 Companies Market Share Analysis
- 12.4. List of Potential Customers
- 13. Research Methodology
List of Figures
- Figure 1: Global Ready to Drink Coffee Market Revenue Breakdown (billion, %) by Region 2025 & 2033
- Figure 2: North America Ready to Drink Coffee Market Revenue (billion), by Soft Drink Type 2025 & 2033
- Figure 3: North America Ready to Drink Coffee Market Revenue Share (%), by Soft Drink Type 2025 & 2033
- Figure 4: North America Ready to Drink Coffee Market Revenue (billion), by Packaging Type 2025 & 2033
- Figure 5: North America Ready to Drink Coffee Market Revenue Share (%), by Packaging Type 2025 & 2033
- Figure 6: North America Ready to Drink Coffee Market Revenue (billion), by Distribution Channel 2025 & 2033
- Figure 7: North America Ready to Drink Coffee Market Revenue Share (%), by Distribution Channel 2025 & 2033
- Figure 8: North America Ready to Drink Coffee Market Revenue (billion), by Country 2025 & 2033
- Figure 9: North America Ready to Drink Coffee Market Revenue Share (%), by Country 2025 & 2033
- Figure 10: South America Ready to Drink Coffee Market Revenue (billion), by Soft Drink Type 2025 & 2033
- Figure 11: South America Ready to Drink Coffee Market Revenue Share (%), by Soft Drink Type 2025 & 2033
- Figure 12: South America Ready to Drink Coffee Market Revenue (billion), by Packaging Type 2025 & 2033
- Figure 13: South America Ready to Drink Coffee Market Revenue Share (%), by Packaging Type 2025 & 2033
- Figure 14: South America Ready to Drink Coffee Market Revenue (billion), by Distribution Channel 2025 & 2033
- Figure 15: South America Ready to Drink Coffee Market Revenue Share (%), by Distribution Channel 2025 & 2033
- Figure 16: South America Ready to Drink Coffee Market Revenue (billion), by Country 2025 & 2033
- Figure 17: South America Ready to Drink Coffee Market Revenue Share (%), by Country 2025 & 2033
- Figure 18: Europe Ready to Drink Coffee Market Revenue (billion), by Soft Drink Type 2025 & 2033
- Figure 19: Europe Ready to Drink Coffee Market Revenue Share (%), by Soft Drink Type 2025 & 2033
- Figure 20: Europe Ready to Drink Coffee Market Revenue (billion), by Packaging Type 2025 & 2033
- Figure 21: Europe Ready to Drink Coffee Market Revenue Share (%), by Packaging Type 2025 & 2033
- Figure 22: Europe Ready to Drink Coffee Market Revenue (billion), by Distribution Channel 2025 & 2033
- Figure 23: Europe Ready to Drink Coffee Market Revenue Share (%), by Distribution Channel 2025 & 2033
- Figure 24: Europe Ready to Drink Coffee Market Revenue (billion), by Country 2025 & 2033
- Figure 25: Europe Ready to Drink Coffee Market Revenue Share (%), by Country 2025 & 2033
- Figure 26: Middle East & Africa Ready to Drink Coffee Market Revenue (billion), by Soft Drink Type 2025 & 2033
- Figure 27: Middle East & Africa Ready to Drink Coffee Market Revenue Share (%), by Soft Drink Type 2025 & 2033
- Figure 28: Middle East & Africa Ready to Drink Coffee Market Revenue (billion), by Packaging Type 2025 & 2033
- Figure 29: Middle East & Africa Ready to Drink Coffee Market Revenue Share (%), by Packaging Type 2025 & 2033
- Figure 30: Middle East & Africa Ready to Drink Coffee Market Revenue (billion), by Distribution Channel 2025 & 2033
- Figure 31: Middle East & Africa Ready to Drink Coffee Market Revenue Share (%), by Distribution Channel 2025 & 2033
- Figure 32: Middle East & Africa Ready to Drink Coffee Market Revenue (billion), by Country 2025 & 2033
- Figure 33: Middle East & Africa Ready to Drink Coffee Market Revenue Share (%), by Country 2025 & 2033
- Figure 34: Asia Pacific Ready to Drink Coffee Market Revenue (billion), by Soft Drink Type 2025 & 2033
- Figure 35: Asia Pacific Ready to Drink Coffee Market Revenue Share (%), by Soft Drink Type 2025 & 2033
- Figure 36: Asia Pacific Ready to Drink Coffee Market Revenue (billion), by Packaging Type 2025 & 2033
- Figure 37: Asia Pacific Ready to Drink Coffee Market Revenue Share (%), by Packaging Type 2025 & 2033
- Figure 38: Asia Pacific Ready to Drink Coffee Market Revenue (billion), by Distribution Channel 2025 & 2033
- Figure 39: Asia Pacific Ready to Drink Coffee Market Revenue Share (%), by Distribution Channel 2025 & 2033
- Figure 40: Asia Pacific Ready to Drink Coffee Market Revenue (billion), by Country 2025 & 2033
- Figure 41: Asia Pacific Ready to Drink Coffee Market Revenue Share (%), by Country 2025 & 2033
List of Tables
- Table 1: Global Ready to Drink Coffee Market Revenue billion Forecast, by Soft Drink Type 2020 & 2033
- Table 2: Global Ready to Drink Coffee Market Revenue billion Forecast, by Packaging Type 2020 & 2033
- Table 3: Global Ready to Drink Coffee Market Revenue billion Forecast, by Distribution Channel 2020 & 2033
- Table 4: Global Ready to Drink Coffee Market Revenue billion Forecast, by Region 2020 & 2033
- Table 5: Global Ready to Drink Coffee Market Revenue billion Forecast, by Soft Drink Type 2020 & 2033
- Table 6: Global Ready to Drink Coffee Market Revenue billion Forecast, by Packaging Type 2020 & 2033
- Table 7: Global Ready to Drink Coffee Market Revenue billion Forecast, by Distribution Channel 2020 & 2033
- Table 8: Global Ready to Drink Coffee Market Revenue billion Forecast, by Country 2020 & 2033
- Table 9: United States Ready to Drink Coffee Market Revenue (billion) Forecast, by Application 2020 & 2033
- Table 10: Canada Ready to Drink Coffee Market Revenue (billion) Forecast, by Application 2020 & 2033
- Table 11: Mexico Ready to Drink Coffee Market Revenue (billion) Forecast, by Application 2020 & 2033
- Table 12: Global Ready to Drink Coffee Market Revenue billion Forecast, by Soft Drink Type 2020 & 2033
- Table 13: Global Ready to Drink Coffee Market Revenue billion Forecast, by Packaging Type 2020 & 2033
- Table 14: Global Ready to Drink Coffee Market Revenue billion Forecast, by Distribution Channel 2020 & 2033
- Table 15: Global Ready to Drink Coffee Market Revenue billion Forecast, by Country 2020 & 2033
- Table 16: Brazil Ready to Drink Coffee Market Revenue (billion) Forecast, by Application 2020 & 2033
- Table 17: Argentina Ready to Drink Coffee Market Revenue (billion) Forecast, by Application 2020 & 2033
- Table 18: Rest of South America Ready to Drink Coffee Market Revenue (billion) Forecast, by Application 2020 & 2033
- Table 19: Global Ready to Drink Coffee Market Revenue billion Forecast, by Soft Drink Type 2020 & 2033
- Table 20: Global Ready to Drink Coffee Market Revenue billion Forecast, by Packaging Type 2020 & 2033
- Table 21: Global Ready to Drink Coffee Market Revenue billion Forecast, by Distribution Channel 2020 & 2033
- Table 22: Global Ready to Drink Coffee Market Revenue billion Forecast, by Country 2020 & 2033
- Table 23: United Kingdom Ready to Drink Coffee Market Revenue (billion) Forecast, by Application 2020 & 2033
- Table 24: Germany Ready to Drink Coffee Market Revenue (billion) Forecast, by Application 2020 & 2033
- Table 25: France Ready to Drink Coffee Market Revenue (billion) Forecast, by Application 2020 & 2033
- Table 26: Italy Ready to Drink Coffee Market Revenue (billion) Forecast, by Application 2020 & 2033
- Table 27: Spain Ready to Drink Coffee Market Revenue (billion) Forecast, by Application 2020 & 2033
- Table 28: Russia Ready to Drink Coffee Market Revenue (billion) Forecast, by Application 2020 & 2033
- Table 29: Benelux Ready to Drink Coffee Market Revenue (billion) Forecast, by Application 2020 & 2033
- Table 30: Nordics Ready to Drink Coffee Market Revenue (billion) Forecast, by Application 2020 & 2033
- Table 31: Rest of Europe Ready to Drink Coffee Market Revenue (billion) Forecast, by Application 2020 & 2033
- Table 32: Global Ready to Drink Coffee Market Revenue billion Forecast, by Soft Drink Type 2020 & 2033
- Table 33: Global Ready to Drink Coffee Market Revenue billion Forecast, by Packaging Type 2020 & 2033
- Table 34: Global Ready to Drink Coffee Market Revenue billion Forecast, by Distribution Channel 2020 & 2033
- Table 35: Global Ready to Drink Coffee Market Revenue billion Forecast, by Country 2020 & 2033
- Table 36: Turkey Ready to Drink Coffee Market Revenue (billion) Forecast, by Application 2020 & 2033
- Table 37: Israel Ready to Drink Coffee Market Revenue (billion) Forecast, by Application 2020 & 2033
- Table 38: GCC Ready to Drink Coffee Market Revenue (billion) Forecast, by Application 2020 & 2033
- Table 39: North Africa Ready to Drink Coffee Market Revenue (billion) Forecast, by Application 2020 & 2033
- Table 40: South Africa Ready to Drink Coffee Market Revenue (billion) Forecast, by Application 2020 & 2033
- Table 41: Rest of Middle East & Africa Ready to Drink Coffee Market Revenue (billion) Forecast, by Application 2020 & 2033
- Table 42: Global Ready to Drink Coffee Market Revenue billion Forecast, by Soft Drink Type 2020 & 2033
- Table 43: Global Ready to Drink Coffee Market Revenue billion Forecast, by Packaging Type 2020 & 2033
- Table 44: Global Ready to Drink Coffee Market Revenue billion Forecast, by Distribution Channel 2020 & 2033
- Table 45: Global Ready to Drink Coffee Market Revenue billion Forecast, by Country 2020 & 2033
- Table 46: China Ready to Drink Coffee Market Revenue (billion) Forecast, by Application 2020 & 2033
- Table 47: India Ready to Drink Coffee Market Revenue (billion) Forecast, by Application 2020 & 2033
- Table 48: Japan Ready to Drink Coffee Market Revenue (billion) Forecast, by Application 2020 & 2033
- Table 49: South Korea Ready to Drink Coffee Market Revenue (billion) Forecast, by Application 2020 & 2033
- Table 50: ASEAN Ready to Drink Coffee Market Revenue (billion) Forecast, by Application 2020 & 2033
- Table 51: Oceania Ready to Drink Coffee Market Revenue (billion) Forecast, by Application 2020 & 2033
- Table 52: Rest of Asia Pacific Ready to Drink Coffee Market Revenue (billion) Forecast, by Application 2020 & 2033
Frequently Asked Questions
1. What is the projected Compound Annual Growth Rate (CAGR) of the Ready to Drink Coffee Market?
The projected CAGR is approximately 5.99%.
2. Which companies are prominent players in the Ready to Drink Coffee Market?
Key companies in the market include Arla Foods amba, Unilever PL, Nestle S A, Emmi AG, Asahi Group Holdings Ltd, PepsiCo Inc, Rauch Fruchtsäfte GmbH & Co OG, DyDo Group HoldingsInc, Suntory Holdings Limited, Luigi Lavazza S p A, Keurig Dr Pepper Inc, Danone S A, The Coca-Cola Company, Kirin Holdings Company Limited, Sodiaal Union.
3. What are the main segments of the Ready to Drink Coffee Market?
The market segments include Soft Drink Type, Packaging Type, Distribution Channel.
4. Can you provide details about the market size?
The market size is estimated to be USD 119.7 billion as of 2022.
5. What are some drivers contributing to market growth?
Rising Consumer Awareness about Health and Fitness; Increasing the Use of Casein and Caseinate in Food and Beverage Industry.
6. What are the notable trends driving market growth?
OTHER KEY INDUSTRY TRENDS COVERED IN THE REPORT.
7. Are there any restraints impacting market growth?
High Competition From Alternative Protein Sources.
8. Can you provide examples of recent developments in the market?
December 2023: Costa Coffee’s Moroccan franchisee Goldex Morocco has planned to launch five new outlets in Morocco by the end of Q3 2023 at a cost of USD m. Two will be in Casablanca, two in Rabat and the final outlet will be opened in Bouskoura.July 2023: Keurig Dr. Pepper Inc. announced a strategic partnership with La Colombe, including a long-term sales and distribution agreement for La Colombe's ready-to-drink coffee. Keurig Dr Pepper will also make an equity investment in La Colombe, enabling KDP to participate in the value creation upside expected from the partnership.July 2023: Nestlé Thailand has launched the new NESCAFÉ GOLD Creama Craft Latte and NESCAFÉ GOLD Creama Craft Americano in the RTD coffee category in Thailand.
9. What pricing options are available for accessing the report?
Pricing options include single-user, multi-user, and enterprise licenses priced at USD 3800, USD 4500, and USD 5800 respectively.
10. Is the market size provided in terms of value or volume?
The market size is provided in terms of value, measured in billion.
11. Are there any specific market keywords associated with the report?
Yes, the market keyword associated with the report is "Ready to Drink Coffee Market," which aids in identifying and referencing the specific market segment covered.
12. How do I determine which pricing option suits my needs best?
The pricing options vary based on user requirements and access needs. Individual users may opt for single-user licenses, while businesses requiring broader access may choose multi-user or enterprise licenses for cost-effective access to the report.
13. Are there any additional resources or data provided in the Ready to Drink Coffee Market report?
While the report offers comprehensive insights, it's advisable to review the specific contents or supplementary materials provided to ascertain if additional resources or data are available.
14. How can I stay updated on further developments or reports in the Ready to Drink Coffee Market?
To stay informed about further developments, trends, and reports in the Ready to Drink Coffee Market, consider subscribing to industry newsletters, following relevant companies and organizations, or regularly checking reputable industry news sources and publications.
Methodology
Step 1 - Identification of Relevant Samples Size from Population Database


Step 2 - Approaches for Defining Global Market Size (Value, Volume* & Price*)

Note*: In applicable scenarios
Step 3 - Data Sources
Primary Research
- Web Analytics
- Survey Reports
- Research Institute
- Latest Research Reports
- Opinion Leaders
Secondary Research
- Annual Reports
- White Paper
- Latest Press Release
- Industry Association
- Paid Database
- Investor Presentations

Step 4 - Data Triangulation
Involves using different sources of information in order to increase the validity of a study
These sources are likely to be stakeholders in a program - participants, other researchers, program staff, other community members, and so on.
Then we put all data in single framework & apply various statistical tools to find out the dynamic on the market.
During the analysis stage, feedback from the stakeholder groups would be compared to determine areas of agreement as well as areas of divergence