

Key Insights
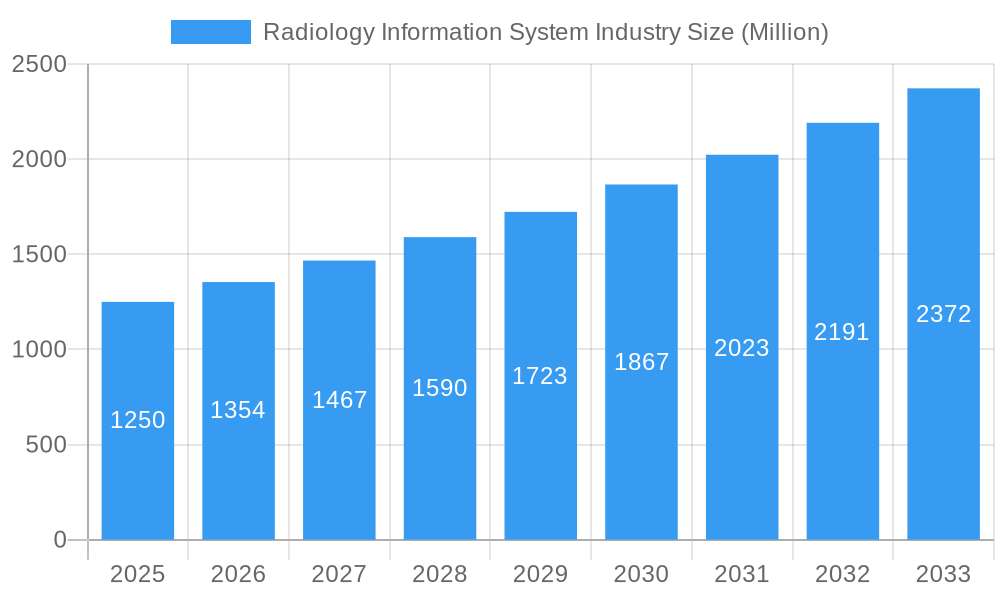
The Radiology Information System (RIS) market, valued at $1.25 billion in 2025, is experiencing robust growth, projected to expand at a compound annual growth rate (CAGR) of 8.63% from 2025 to 2033. This growth is fueled by several key factors. The increasing volume of medical imaging data necessitates efficient management and storage solutions, driving demand for sophisticated RIS systems. Furthermore, the rising adoption of cloud-based RIS solutions offers enhanced scalability, accessibility, and cost-effectiveness, contributing significantly to market expansion. The integration of Artificial Intelligence (AI) and machine learning capabilities within RIS is further enhancing diagnostic accuracy and operational efficiency, attracting healthcare providers seeking to optimize their workflows. Government initiatives promoting digital health infrastructure and the growing prevalence of chronic diseases requiring frequent imaging also contribute to market growth. However, challenges remain, including high initial investment costs for implementing new systems, the need for robust cybersecurity measures to protect sensitive patient data, and the complexities associated with integrating RIS with other healthcare information systems (HIS). The market is segmented by system type (integrated vs. standalone), deployment mode (on-premise vs. cloud-based), and component (hardware, software, services). North America currently holds a significant market share, driven by advanced healthcare infrastructure and technological adoption; however, the Asia-Pacific region is expected to exhibit substantial growth in the coming years due to rising healthcare expenditure and increasing technological advancements.
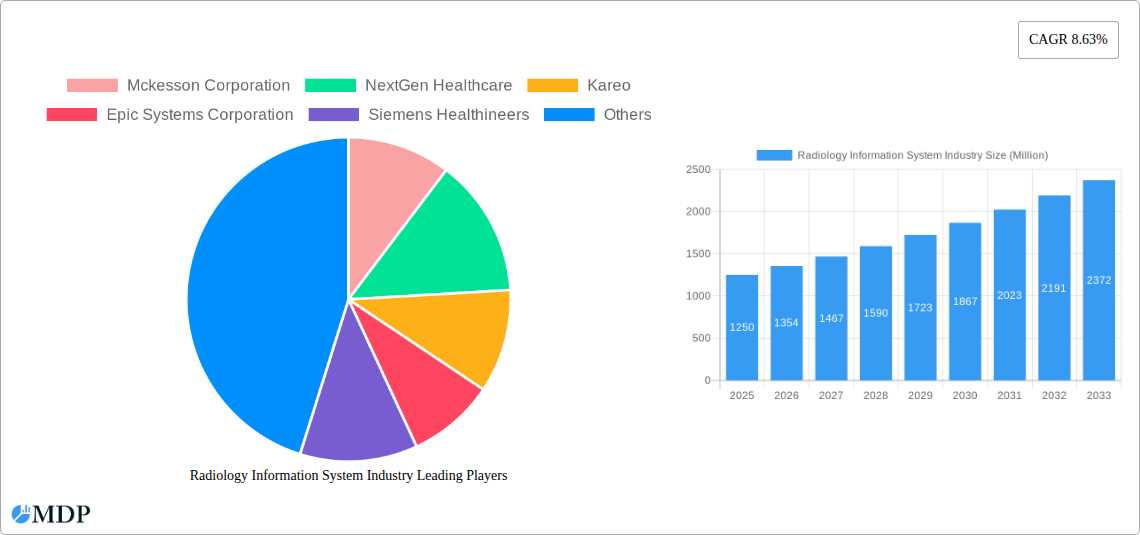
Radiology Information System Industry Market Size (In Billion)
The competitive landscape is characterized by a mix of established players like McKesson, Siemens Healthineers, and GE Healthcare, alongside emerging technology providers. These companies are focused on product innovation, strategic partnerships, and mergers and acquisitions to expand their market reach and product portfolios. The future trajectory of the RIS market will depend on the continued advancements in AI and machine learning, the increasing adoption of cloud technologies, and the ongoing efforts to improve interoperability and data security within the healthcare ecosystem. The market is expected to witness a shift towards integrated, cloud-based solutions that offer greater flexibility, accessibility, and cost efficiency for healthcare providers, particularly in smaller practices. The ongoing focus on improving patient care and operational efficiency will remain a key driver of market growth over the forecast period.
Radiology Information System Industry Company Market Share
Radiology Information System (RIS) Market Report: 2019-2033
This comprehensive report provides a detailed analysis of the Radiology Information System (RIS) industry, projecting robust growth and significant market transformation from 2019 to 2033. The study covers market dynamics, leading players, key segments, and emerging opportunities, offering actionable insights for stakeholders across the healthcare technology landscape. The report encompasses a historical period of 2019-2024, a base year of 2025, and forecasts extending to 2033. Expected market value projections reach into the billions.
Radiology Information System Industry Market Dynamics & Concentration
The Radiology Information System (RIS) market is experiencing substantial growth, driven by increasing demand for efficient image management and streamlined workflows in healthcare settings. Market concentration is moderate, with several key players holding significant shares, but a fragmented landscape also exists among smaller, specialized vendors. The market is characterized by intense competition, leading to frequent product innovations and strategic partnerships. Regulatory frameworks, such as HIPAA compliance in the US and GDPR in Europe, significantly influence industry practices. The rise of cloud-based solutions and the integration of RIS with other healthcare IT systems represent major innovation drivers. Product substitutes are limited, primarily consisting of less comprehensive or integrated systems. End-user trends indicate a strong preference for user-friendly, scalable, and interoperable systems. M&A activity has been moderate, with xx deals recorded between 2019 and 2024, resulting in a consolidation of market share among larger players. The xx% market share held by the top 5 players in 2024 illustrates this trend.
- Key Drivers: Technological advancements, increasing healthcare expenditure, regulatory mandates for improved healthcare efficiency.
- Key Restraints: High initial investment costs, data security concerns, integration complexities.
- Market Concentration: Moderate, with top 5 players holding approximately xx% market share in 2024.
- M&A Activity: xx deals recorded between 2019 and 2024.
Radiology Information System Industry Industry Trends & Analysis
The RIS market is poised for significant growth, with a projected Compound Annual Growth Rate (CAGR) of xx% during the forecast period (2025-2033). This growth is primarily attributed to the increasing adoption of digital imaging technologies, rising demand for improved diagnostic accuracy, and the need for efficient workflow management in radiology departments. The shift towards cloud-based deployments is a key technological disruption, offering scalability, cost-effectiveness, and enhanced accessibility. Consumer preference is strongly towards integrated systems offering seamless interoperability with other healthcare IT systems like Picture Archiving and Communication Systems (PACS). Competitive dynamics are intense, with major players focusing on product innovation, strategic partnerships, and expansion into new markets. Market penetration of cloud-based RIS solutions is expected to reach xx% by 2033. The increasing adoption of artificial intelligence (AI) in radiology is also shaping industry trends, with intelligent image analysis and workflow automation becoming increasingly prevalent.
Leading Markets & Segments in Radiology Information System Industry
The North American region holds the largest market share in the RIS industry, driven by high healthcare expenditure, advanced technological infrastructure, and strong adoption of digital healthcare solutions. Within this region, the United States dominates, accounting for the majority of market revenue.
- Type: Integrated RIS systems are gaining popularity due to their enhanced functionality and streamlined workflows, outpacing the standalone market segment.
- Deployment Mode: Cloud-based RIS deployments are witnessing accelerated growth compared to on-premise solutions.
- Component: The software component accounts for the largest revenue share, driven by the increasing demand for sophisticated RIS functionalities.
Key Drivers for North American Dominance:
- Advanced healthcare infrastructure
- High healthcare expenditure
- Stringent regulatory frameworks driving digitalization
- Early adoption of new technologies
Other regions, including Europe and Asia-Pacific, are exhibiting substantial growth potential, driven by factors such as increasing government investments in healthcare infrastructure and rising awareness of the benefits of RIS systems.
Radiology Information System Industry Product Developments
Recent product developments showcase advancements in AI-powered image analysis, improved user interfaces, enhanced integration with PACS and other healthcare IT systems, and the rise of cloud-based solutions. These innovations improve diagnostic accuracy, workflow efficiency, and data security. The market is witnessing a shift towards more modular and customizable RIS systems, allowing healthcare providers to tailor solutions to their specific needs. This focus on interoperability and seamless integration with other healthcare IT systems is a key competitive advantage for leading players.
Key Drivers of Radiology Information System Industry Growth
Several factors fuel the growth of the RIS industry. Technological advancements like AI-powered image analysis significantly improve diagnostic accuracy and efficiency. Increasing healthcare expenditure globally necessitates more efficient and cost-effective solutions like RIS. Stringent regulatory frameworks mandate improved data management and security, driving adoption of sophisticated RIS systems. Furthermore, the rising prevalence of chronic diseases increases demand for effective diagnostic tools.
Challenges in the Radiology Information System Industry Market
High initial investment costs, particularly for integrated and cloud-based solutions, pose a significant barrier to entry for smaller healthcare providers. Data security and privacy concerns are paramount, requiring robust security measures and adherence to stringent regulations. Integrating RIS with existing IT infrastructure can be complex and time-consuming, posing a challenge for many healthcare institutions. Intense competition among established vendors further complicates market entry.
Emerging Opportunities in Radiology Information System Industry
The integration of AI and machine learning into RIS systems presents significant opportunities for improving diagnostic accuracy and workflow efficiency. Strategic partnerships between RIS vendors and healthcare providers can facilitate wider adoption and implementation. Expansion into underserved markets, particularly in developing countries, offers considerable potential for growth. The rise of telehealth and remote radiology further enhances the market's potential.
Leading Players in the Radiology Information System Industry Sector
- Mckesson Corporation
- NextGen Healthcare
- Kareo
- Epic Systems Corporation
- Siemens Healthineers
- GE Healthcare
- Varian Medical Systems Inc
- IBM (Merge Healthcare Incorporated)
- Cerner Corporation
- Koninklijke Philips NV
- Medinformatix Inc
- Allscripts Healthcare Solutions Inc
- patientNOW Inc
- Konica Minolta Healthcare Americas Inc
- Practice Fusion
Key Milestones in Radiology Information System Industry Industry
- March 2022: Intelerad Medical Systems launched the Enterprise Imaging and Informatics Suite at HIMSS22, providing radiologists with a new medical image management option.
- February 2022: Carestream Health India launched the DRX Compass, a digital radiology solution enhancing radiologist efficiency.
Strategic Outlook for Radiology Information System Industry Market
The RIS market is poised for continued growth, driven by technological advancements, increasing demand for efficient healthcare solutions, and favorable regulatory environments. Strategic partnerships, product innovation, and expansion into emerging markets are key growth accelerators. The integration of AI and cloud technologies will continue to reshape the industry landscape, creating significant opportunities for market leaders and new entrants alike. The forecast predicts a multi-billion dollar market by 2033.
Radiology Information System Industry Segmentation
-
1. Type
- 1.1. Integrated Radiology Information System
- 1.2. Stand-alone Radiology Information System
-
2. Deployment Mode
- 2.1. On-premise
- 2.2. Cloud-based
-
3. Component
- 3.1. Hardware
- 3.2. Software
- 3.3. Services
Radiology Information System Industry Segmentation By Geography
-
1. North America
- 1.1. United States
- 1.2. Canada
- 1.3. Mexico
-
2. Europe
- 2.1. Germany
- 2.2. United Kingdom
- 2.3. France
- 2.4. Italy
- 2.5. Spain
- 2.6. Rest of Europe
-
3. Asia Pacific
- 3.1. China
- 3.2. Japan
- 3.3. India
- 3.4. Australia
- 3.5. South Korea
- 3.6. Rest of Asia Pacific
-
4. Middle East and Africa
- 4.1. GCC
- 4.2. South Africa
- 4.3. Rest of Middle East and Africa
-
5. South America
- 5.1. Brazil
- 5.2. Argentina
- 5.3. Rest of South America
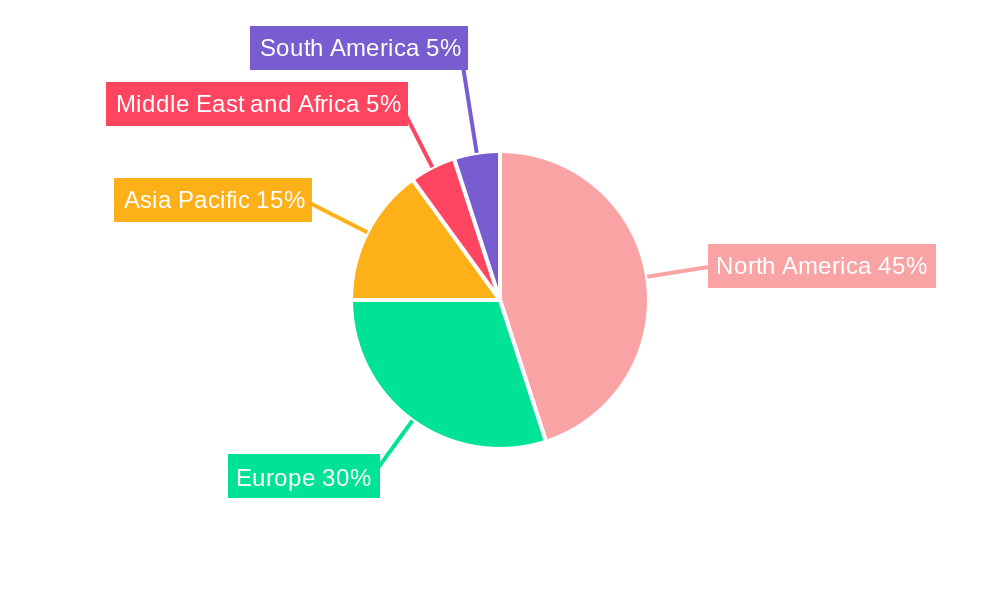
Radiology Information System Industry Regional Market Share
Geographic Coverage of Radiology Information System Industry
Radiology Information System Industry REPORT HIGHLIGHTS
| Aspects | Details |
|---|---|
| Study Period | 2020-2034 |
| Base Year | 2025 |
| Estimated Year | 2026 |
| Forecast Period | 2026-2034 |
| Historical Period | 2020-2025 |
| Growth Rate | CAGR of 8.63% from 2020-2034 |
| Segmentation |
|
Table of Contents
- 1. Introduction
- 1.1. Research Scope
- 1.2. Market Segmentation
- 1.3. Research Objective
- 1.4. Definitions and Assumptions
- 2. Executive Summary
- 2.1. Market Snapshot
- 3. Market Dynamics
- 3.1. Market Drivers
- 3.2. Market Restrains
- 3.3. Market Trends
- 3.4. Market Opportunities
- 4. Market Factor Analysis
- 4.1. Porters Five Forces
- 4.1.1. Bargaining Power of Suppliers
- 4.1.2. Bargaining Power of Buyers
- 4.1.3. Threat of New Entrants
- 4.1.4. Threat of Substitutes
- 4.1.5. Competitive Rivalry
- 4.2. PESTEL analysis
- 4.3. BCG Analysis
- 4.3.1. Stars (High Growth, High Market Share)
- 4.3.2. Cash Cows (Low Growth, High Market Share)
- 4.3.3. Question Mark (High Growth, Low Market Share)
- 4.3.4. Dogs (Low Growth, Low Market Share)
- 4.4. Ansoff Matrix Analysis
- 4.5. Supply Chain Analysis
- 4.6. Regulatory Landscape
- 4.7. Current Market Potential and Opportunity Assessment (TAM–SAM–SOM Framework)
- 4.8. MDP Analyst Note
- 4.1. Porters Five Forces
- 5. Market Analysis, Insights and Forecast 2021-2033
- 5.1. Market Analysis, Insights and Forecast - by Type
- 5.1.1. Integrated Radiology Information System
- 5.1.2. Stand-alone Radiology Information System
- 5.2. Market Analysis, Insights and Forecast - by Deployment Mode
- 5.2.1. On-premise
- 5.2.2. Cloud-based
- 5.3. Market Analysis, Insights and Forecast - by Component
- 5.3.1. Hardware
- 5.3.2. Software
- 5.3.3. Services
- 5.4. Market Analysis, Insights and Forecast - by Region
- 5.4.1. North America
- 5.4.2. Europe
- 5.4.3. Asia Pacific
- 5.4.4. Middle East and Africa
- 5.4.5. South America
- 5.1. Market Analysis, Insights and Forecast - by Type
- 6. Global Radiology Information System Industry Analysis, Insights and Forecast, 2021-2033
- 6.1. Market Analysis, Insights and Forecast - by Type
- 6.1.1. Integrated Radiology Information System
- 6.1.2. Stand-alone Radiology Information System
- 6.2. Market Analysis, Insights and Forecast - by Deployment Mode
- 6.2.1. On-premise
- 6.2.2. Cloud-based
- 6.3. Market Analysis, Insights and Forecast - by Component
- 6.3.1. Hardware
- 6.3.2. Software
- 6.3.3. Services
- 6.1. Market Analysis, Insights and Forecast - by Type
- 7. North America Radiology Information System Industry Analysis, Insights and Forecast, 2020-2032
- 7.1. Market Analysis, Insights and Forecast - by Type
- 7.1.1. Integrated Radiology Information System
- 7.1.2. Stand-alone Radiology Information System
- 7.2. Market Analysis, Insights and Forecast - by Deployment Mode
- 7.2.1. On-premise
- 7.2.2. Cloud-based
- 7.3. Market Analysis, Insights and Forecast - by Component
- 7.3.1. Hardware
- 7.3.2. Software
- 7.3.3. Services
- 7.1. Market Analysis, Insights and Forecast - by Type
- 8. Europe Radiology Information System Industry Analysis, Insights and Forecast, 2020-2032
- 8.1. Market Analysis, Insights and Forecast - by Type
- 8.1.1. Integrated Radiology Information System
- 8.1.2. Stand-alone Radiology Information System
- 8.2. Market Analysis, Insights and Forecast - by Deployment Mode
- 8.2.1. On-premise
- 8.2.2. Cloud-based
- 8.3. Market Analysis, Insights and Forecast - by Component
- 8.3.1. Hardware
- 8.3.2. Software
- 8.3.3. Services
- 8.1. Market Analysis, Insights and Forecast - by Type
- 9. Asia Pacific Radiology Information System Industry Analysis, Insights and Forecast, 2020-2032
- 9.1. Market Analysis, Insights and Forecast - by Type
- 9.1.1. Integrated Radiology Information System
- 9.1.2. Stand-alone Radiology Information System
- 9.2. Market Analysis, Insights and Forecast - by Deployment Mode
- 9.2.1. On-premise
- 9.2.2. Cloud-based
- 9.3. Market Analysis, Insights and Forecast - by Component
- 9.3.1. Hardware
- 9.3.2. Software
- 9.3.3. Services
- 9.1. Market Analysis, Insights and Forecast - by Type
- 10. Middle East and Africa Radiology Information System Industry Analysis, Insights and Forecast, 2020-2032
- 10.1. Market Analysis, Insights and Forecast - by Type
- 10.1.1. Integrated Radiology Information System
- 10.1.2. Stand-alone Radiology Information System
- 10.2. Market Analysis, Insights and Forecast - by Deployment Mode
- 10.2.1. On-premise
- 10.2.2. Cloud-based
- 10.3. Market Analysis, Insights and Forecast - by Component
- 10.3.1. Hardware
- 10.3.2. Software
- 10.3.3. Services
- 10.1. Market Analysis, Insights and Forecast - by Type
- 11. South America Radiology Information System Industry Analysis, Insights and Forecast, 2020-2032
- 11.1. Market Analysis, Insights and Forecast - by Type
- 11.1.1. Integrated Radiology Information System
- 11.1.2. Stand-alone Radiology Information System
- 11.2. Market Analysis, Insights and Forecast - by Deployment Mode
- 11.2.1. On-premise
- 11.2.2. Cloud-based
- 11.3. Market Analysis, Insights and Forecast - by Component
- 11.3.1. Hardware
- 11.3.2. Software
- 11.3.3. Services
- 11.1. Market Analysis, Insights and Forecast - by Type
- 12. Competitive Analysis
- 12.1. Company Profiles
- 12.1.1 Mckesson Corporation
- 12.1.1.1. Company Overview
- 12.1.1.2. Products
- 12.1.1.3. Company Financials
- 12.1.1.4. SWOT Analysis
- 12.1.2 NextGen Healthcare
- 12.1.2.1. Company Overview
- 12.1.2.2. Products
- 12.1.2.3. Company Financials
- 12.1.2.4. SWOT Analysis
- 12.1.3 Kareo
- 12.1.3.1. Company Overview
- 12.1.3.2. Products
- 12.1.3.3. Company Financials
- 12.1.3.4. SWOT Analysis
- 12.1.4 Epic Systems Corporation
- 12.1.4.1. Company Overview
- 12.1.4.2. Products
- 12.1.4.3. Company Financials
- 12.1.4.4. SWOT Analysis
- 12.1.5 Siemens Healthineers
- 12.1.5.1. Company Overview
- 12.1.5.2. Products
- 12.1.5.3. Company Financials
- 12.1.5.4. SWOT Analysis
- 12.1.6 GE Healthcare
- 12.1.6.1. Company Overview
- 12.1.6.2. Products
- 12.1.6.3. Company Financials
- 12.1.6.4. SWOT Analysis
- 12.1.7 Varian Medical Systems Inc
- 12.1.7.1. Company Overview
- 12.1.7.2. Products
- 12.1.7.3. Company Financials
- 12.1.7.4. SWOT Analysis
- 12.1.8 IBM (Merge Healthcare Incorporated)
- 12.1.8.1. Company Overview
- 12.1.8.2. Products
- 12.1.8.3. Company Financials
- 12.1.8.4. SWOT Analysis
- 12.1.9 Cerner Corporation
- 12.1.9.1. Company Overview
- 12.1.9.2. Products
- 12.1.9.3. Company Financials
- 12.1.9.4. SWOT Analysis
- 12.1.10 Koninklijke Philips NV
- 12.1.10.1. Company Overview
- 12.1.10.2. Products
- 12.1.10.3. Company Financials
- 12.1.10.4. SWOT Analysis
- 12.1.11 Medinformatix Inc
- 12.1.11.1. Company Overview
- 12.1.11.2. Products
- 12.1.11.3. Company Financials
- 12.1.11.4. SWOT Analysis
- 12.1.12 Allscripts Healthcare Solutions Inc
- 12.1.12.1. Company Overview
- 12.1.12.2. Products
- 12.1.12.3. Company Financials
- 12.1.12.4. SWOT Analysis
- 12.1.13 patientNOW Inc
- 12.1.13.1. Company Overview
- 12.1.13.2. Products
- 12.1.13.3. Company Financials
- 12.1.13.4. SWOT Analysis
- 12.1.14 Konica Minolta Healthcare Americas Inc
- 12.1.14.1. Company Overview
- 12.1.14.2. Products
- 12.1.14.3. Company Financials
- 12.1.14.4. SWOT Analysis
- 12.1.15 Practice Fusion
- 12.1.15.1. Company Overview
- 12.1.15.2. Products
- 12.1.15.3. Company Financials
- 12.1.15.4. SWOT Analysis
- 12.1.1 Mckesson Corporation
- 12.2. Market Entropy
- 12.2.1 Company's Key Areas Served
- 12.2.2 Recent Developments
- 12.3. Company Market Share Analysis 2025
- 12.3.1 Top 5 Companies Market Share Analysis
- 12.3.2 Top 3 Companies Market Share Analysis
- 12.4. List of Potential Customers
- 13. Research Methodology
List of Figures
- Figure 1: Global Radiology Information System Industry Revenue Breakdown (Million, %) by Region 2025 & 2033
- Figure 2: Global Radiology Information System Industry Volume Breakdown (K Unit, %) by Region 2025 & 2033
- Figure 3: North America Radiology Information System Industry Revenue (Million), by Type 2025 & 2033
- Figure 4: North America Radiology Information System Industry Volume (K Unit), by Type 2025 & 2033
- Figure 5: North America Radiology Information System Industry Revenue Share (%), by Type 2025 & 2033
- Figure 6: North America Radiology Information System Industry Volume Share (%), by Type 2025 & 2033
- Figure 7: North America Radiology Information System Industry Revenue (Million), by Deployment Mode 2025 & 2033
- Figure 8: North America Radiology Information System Industry Volume (K Unit), by Deployment Mode 2025 & 2033
- Figure 9: North America Radiology Information System Industry Revenue Share (%), by Deployment Mode 2025 & 2033
- Figure 10: North America Radiology Information System Industry Volume Share (%), by Deployment Mode 2025 & 2033
- Figure 11: North America Radiology Information System Industry Revenue (Million), by Component 2025 & 2033
- Figure 12: North America Radiology Information System Industry Volume (K Unit), by Component 2025 & 2033
- Figure 13: North America Radiology Information System Industry Revenue Share (%), by Component 2025 & 2033
- Figure 14: North America Radiology Information System Industry Volume Share (%), by Component 2025 & 2033
- Figure 15: North America Radiology Information System Industry Revenue (Million), by Country 2025 & 2033
- Figure 16: North America Radiology Information System Industry Volume (K Unit), by Country 2025 & 2033
- Figure 17: North America Radiology Information System Industry Revenue Share (%), by Country 2025 & 2033
- Figure 18: North America Radiology Information System Industry Volume Share (%), by Country 2025 & 2033
- Figure 19: Europe Radiology Information System Industry Revenue (Million), by Type 2025 & 2033
- Figure 20: Europe Radiology Information System Industry Volume (K Unit), by Type 2025 & 2033
- Figure 21: Europe Radiology Information System Industry Revenue Share (%), by Type 2025 & 2033
- Figure 22: Europe Radiology Information System Industry Volume Share (%), by Type 2025 & 2033
- Figure 23: Europe Radiology Information System Industry Revenue (Million), by Deployment Mode 2025 & 2033
- Figure 24: Europe Radiology Information System Industry Volume (K Unit), by Deployment Mode 2025 & 2033
- Figure 25: Europe Radiology Information System Industry Revenue Share (%), by Deployment Mode 2025 & 2033
- Figure 26: Europe Radiology Information System Industry Volume Share (%), by Deployment Mode 2025 & 2033
- Figure 27: Europe Radiology Information System Industry Revenue (Million), by Component 2025 & 2033
- Figure 28: Europe Radiology Information System Industry Volume (K Unit), by Component 2025 & 2033
- Figure 29: Europe Radiology Information System Industry Revenue Share (%), by Component 2025 & 2033
- Figure 30: Europe Radiology Information System Industry Volume Share (%), by Component 2025 & 2033
- Figure 31: Europe Radiology Information System Industry Revenue (Million), by Country 2025 & 2033
- Figure 32: Europe Radiology Information System Industry Volume (K Unit), by Country 2025 & 2033
- Figure 33: Europe Radiology Information System Industry Revenue Share (%), by Country 2025 & 2033
- Figure 34: Europe Radiology Information System Industry Volume Share (%), by Country 2025 & 2033
- Figure 35: Asia Pacific Radiology Information System Industry Revenue (Million), by Type 2025 & 2033
- Figure 36: Asia Pacific Radiology Information System Industry Volume (K Unit), by Type 2025 & 2033
- Figure 37: Asia Pacific Radiology Information System Industry Revenue Share (%), by Type 2025 & 2033
- Figure 38: Asia Pacific Radiology Information System Industry Volume Share (%), by Type 2025 & 2033
- Figure 39: Asia Pacific Radiology Information System Industry Revenue (Million), by Deployment Mode 2025 & 2033
- Figure 40: Asia Pacific Radiology Information System Industry Volume (K Unit), by Deployment Mode 2025 & 2033
- Figure 41: Asia Pacific Radiology Information System Industry Revenue Share (%), by Deployment Mode 2025 & 2033
- Figure 42: Asia Pacific Radiology Information System Industry Volume Share (%), by Deployment Mode 2025 & 2033
- Figure 43: Asia Pacific Radiology Information System Industry Revenue (Million), by Component 2025 & 2033
- Figure 44: Asia Pacific Radiology Information System Industry Volume (K Unit), by Component 2025 & 2033
- Figure 45: Asia Pacific Radiology Information System Industry Revenue Share (%), by Component 2025 & 2033
- Figure 46: Asia Pacific Radiology Information System Industry Volume Share (%), by Component 2025 & 2033
- Figure 47: Asia Pacific Radiology Information System Industry Revenue (Million), by Country 2025 & 2033
- Figure 48: Asia Pacific Radiology Information System Industry Volume (K Unit), by Country 2025 & 2033
- Figure 49: Asia Pacific Radiology Information System Industry Revenue Share (%), by Country 2025 & 2033
- Figure 50: Asia Pacific Radiology Information System Industry Volume Share (%), by Country 2025 & 2033
- Figure 51: Middle East and Africa Radiology Information System Industry Revenue (Million), by Type 2025 & 2033
- Figure 52: Middle East and Africa Radiology Information System Industry Volume (K Unit), by Type 2025 & 2033
- Figure 53: Middle East and Africa Radiology Information System Industry Revenue Share (%), by Type 2025 & 2033
- Figure 54: Middle East and Africa Radiology Information System Industry Volume Share (%), by Type 2025 & 2033
- Figure 55: Middle East and Africa Radiology Information System Industry Revenue (Million), by Deployment Mode 2025 & 2033
- Figure 56: Middle East and Africa Radiology Information System Industry Volume (K Unit), by Deployment Mode 2025 & 2033
- Figure 57: Middle East and Africa Radiology Information System Industry Revenue Share (%), by Deployment Mode 2025 & 2033
- Figure 58: Middle East and Africa Radiology Information System Industry Volume Share (%), by Deployment Mode 2025 & 2033
- Figure 59: Middle East and Africa Radiology Information System Industry Revenue (Million), by Component 2025 & 2033
- Figure 60: Middle East and Africa Radiology Information System Industry Volume (K Unit), by Component 2025 & 2033
- Figure 61: Middle East and Africa Radiology Information System Industry Revenue Share (%), by Component 2025 & 2033
- Figure 62: Middle East and Africa Radiology Information System Industry Volume Share (%), by Component 2025 & 2033
- Figure 63: Middle East and Africa Radiology Information System Industry Revenue (Million), by Country 2025 & 2033
- Figure 64: Middle East and Africa Radiology Information System Industry Volume (K Unit), by Country 2025 & 2033
- Figure 65: Middle East and Africa Radiology Information System Industry Revenue Share (%), by Country 2025 & 2033
- Figure 66: Middle East and Africa Radiology Information System Industry Volume Share (%), by Country 2025 & 2033
- Figure 67: South America Radiology Information System Industry Revenue (Million), by Type 2025 & 2033
- Figure 68: South America Radiology Information System Industry Volume (K Unit), by Type 2025 & 2033
- Figure 69: South America Radiology Information System Industry Revenue Share (%), by Type 2025 & 2033
- Figure 70: South America Radiology Information System Industry Volume Share (%), by Type 2025 & 2033
- Figure 71: South America Radiology Information System Industry Revenue (Million), by Deployment Mode 2025 & 2033
- Figure 72: South America Radiology Information System Industry Volume (K Unit), by Deployment Mode 2025 & 2033
- Figure 73: South America Radiology Information System Industry Revenue Share (%), by Deployment Mode 2025 & 2033
- Figure 74: South America Radiology Information System Industry Volume Share (%), by Deployment Mode 2025 & 2033
- Figure 75: South America Radiology Information System Industry Revenue (Million), by Component 2025 & 2033
- Figure 76: South America Radiology Information System Industry Volume (K Unit), by Component 2025 & 2033
- Figure 77: South America Radiology Information System Industry Revenue Share (%), by Component 2025 & 2033
- Figure 78: South America Radiology Information System Industry Volume Share (%), by Component 2025 & 2033
- Figure 79: South America Radiology Information System Industry Revenue (Million), by Country 2025 & 2033
- Figure 80: South America Radiology Information System Industry Volume (K Unit), by Country 2025 & 2033
- Figure 81: South America Radiology Information System Industry Revenue Share (%), by Country 2025 & 2033
- Figure 82: South America Radiology Information System Industry Volume Share (%), by Country 2025 & 2033
List of Tables
- Table 1: Global Radiology Information System Industry Revenue Million Forecast, by Type 2020 & 2033
- Table 2: Global Radiology Information System Industry Volume K Unit Forecast, by Type 2020 & 2033
- Table 3: Global Radiology Information System Industry Revenue Million Forecast, by Deployment Mode 2020 & 2033
- Table 4: Global Radiology Information System Industry Volume K Unit Forecast, by Deployment Mode 2020 & 2033
- Table 5: Global Radiology Information System Industry Revenue Million Forecast, by Component 2020 & 2033
- Table 6: Global Radiology Information System Industry Volume K Unit Forecast, by Component 2020 & 2033
- Table 7: Global Radiology Information System Industry Revenue Million Forecast, by Region 2020 & 2033
- Table 8: Global Radiology Information System Industry Volume K Unit Forecast, by Region 2020 & 2033
- Table 9: Global Radiology Information System Industry Revenue Million Forecast, by Type 2020 & 2033
- Table 10: Global Radiology Information System Industry Volume K Unit Forecast, by Type 2020 & 2033
- Table 11: Global Radiology Information System Industry Revenue Million Forecast, by Deployment Mode 2020 & 2033
- Table 12: Global Radiology Information System Industry Volume K Unit Forecast, by Deployment Mode 2020 & 2033
- Table 13: Global Radiology Information System Industry Revenue Million Forecast, by Component 2020 & 2033
- Table 14: Global Radiology Information System Industry Volume K Unit Forecast, by Component 2020 & 2033
- Table 15: Global Radiology Information System Industry Revenue Million Forecast, by Country 2020 & 2033
- Table 16: Global Radiology Information System Industry Volume K Unit Forecast, by Country 2020 & 2033
- Table 17: United States Radiology Information System Industry Revenue (Million) Forecast, by Application 2020 & 2033
- Table 18: United States Radiology Information System Industry Volume (K Unit) Forecast, by Application 2020 & 2033
- Table 19: Canada Radiology Information System Industry Revenue (Million) Forecast, by Application 2020 & 2033
- Table 20: Canada Radiology Information System Industry Volume (K Unit) Forecast, by Application 2020 & 2033
- Table 21: Mexico Radiology Information System Industry Revenue (Million) Forecast, by Application 2020 & 2033
- Table 22: Mexico Radiology Information System Industry Volume (K Unit) Forecast, by Application 2020 & 2033
- Table 23: Global Radiology Information System Industry Revenue Million Forecast, by Type 2020 & 2033
- Table 24: Global Radiology Information System Industry Volume K Unit Forecast, by Type 2020 & 2033
- Table 25: Global Radiology Information System Industry Revenue Million Forecast, by Deployment Mode 2020 & 2033
- Table 26: Global Radiology Information System Industry Volume K Unit Forecast, by Deployment Mode 2020 & 2033
- Table 27: Global Radiology Information System Industry Revenue Million Forecast, by Component 2020 & 2033
- Table 28: Global Radiology Information System Industry Volume K Unit Forecast, by Component 2020 & 2033
- Table 29: Global Radiology Information System Industry Revenue Million Forecast, by Country 2020 & 2033
- Table 30: Global Radiology Information System Industry Volume K Unit Forecast, by Country 2020 & 2033
- Table 31: Germany Radiology Information System Industry Revenue (Million) Forecast, by Application 2020 & 2033
- Table 32: Germany Radiology Information System Industry Volume (K Unit) Forecast, by Application 2020 & 2033
- Table 33: United Kingdom Radiology Information System Industry Revenue (Million) Forecast, by Application 2020 & 2033
- Table 34: United Kingdom Radiology Information System Industry Volume (K Unit) Forecast, by Application 2020 & 2033
- Table 35: France Radiology Information System Industry Revenue (Million) Forecast, by Application 2020 & 2033
- Table 36: France Radiology Information System Industry Volume (K Unit) Forecast, by Application 2020 & 2033
- Table 37: Italy Radiology Information System Industry Revenue (Million) Forecast, by Application 2020 & 2033
- Table 38: Italy Radiology Information System Industry Volume (K Unit) Forecast, by Application 2020 & 2033
- Table 39: Spain Radiology Information System Industry Revenue (Million) Forecast, by Application 2020 & 2033
- Table 40: Spain Radiology Information System Industry Volume (K Unit) Forecast, by Application 2020 & 2033
- Table 41: Rest of Europe Radiology Information System Industry Revenue (Million) Forecast, by Application 2020 & 2033
- Table 42: Rest of Europe Radiology Information System Industry Volume (K Unit) Forecast, by Application 2020 & 2033
- Table 43: Global Radiology Information System Industry Revenue Million Forecast, by Type 2020 & 2033
- Table 44: Global Radiology Information System Industry Volume K Unit Forecast, by Type 2020 & 2033
- Table 45: Global Radiology Information System Industry Revenue Million Forecast, by Deployment Mode 2020 & 2033
- Table 46: Global Radiology Information System Industry Volume K Unit Forecast, by Deployment Mode 2020 & 2033
- Table 47: Global Radiology Information System Industry Revenue Million Forecast, by Component 2020 & 2033
- Table 48: Global Radiology Information System Industry Volume K Unit Forecast, by Component 2020 & 2033
- Table 49: Global Radiology Information System Industry Revenue Million Forecast, by Country 2020 & 2033
- Table 50: Global Radiology Information System Industry Volume K Unit Forecast, by Country 2020 & 2033
- Table 51: China Radiology Information System Industry Revenue (Million) Forecast, by Application 2020 & 2033
- Table 52: China Radiology Information System Industry Volume (K Unit) Forecast, by Application 2020 & 2033
- Table 53: Japan Radiology Information System Industry Revenue (Million) Forecast, by Application 2020 & 2033
- Table 54: Japan Radiology Information System Industry Volume (K Unit) Forecast, by Application 2020 & 2033
- Table 55: India Radiology Information System Industry Revenue (Million) Forecast, by Application 2020 & 2033
- Table 56: India Radiology Information System Industry Volume (K Unit) Forecast, by Application 2020 & 2033
- Table 57: Australia Radiology Information System Industry Revenue (Million) Forecast, by Application 2020 & 2033
- Table 58: Australia Radiology Information System Industry Volume (K Unit) Forecast, by Application 2020 & 2033
- Table 59: South Korea Radiology Information System Industry Revenue (Million) Forecast, by Application 2020 & 2033
- Table 60: South Korea Radiology Information System Industry Volume (K Unit) Forecast, by Application 2020 & 2033
- Table 61: Rest of Asia Pacific Radiology Information System Industry Revenue (Million) Forecast, by Application 2020 & 2033
- Table 62: Rest of Asia Pacific Radiology Information System Industry Volume (K Unit) Forecast, by Application 2020 & 2033
- Table 63: Global Radiology Information System Industry Revenue Million Forecast, by Type 2020 & 2033
- Table 64: Global Radiology Information System Industry Volume K Unit Forecast, by Type 2020 & 2033
- Table 65: Global Radiology Information System Industry Revenue Million Forecast, by Deployment Mode 2020 & 2033
- Table 66: Global Radiology Information System Industry Volume K Unit Forecast, by Deployment Mode 2020 & 2033
- Table 67: Global Radiology Information System Industry Revenue Million Forecast, by Component 2020 & 2033
- Table 68: Global Radiology Information System Industry Volume K Unit Forecast, by Component 2020 & 2033
- Table 69: Global Radiology Information System Industry Revenue Million Forecast, by Country 2020 & 2033
- Table 70: Global Radiology Information System Industry Volume K Unit Forecast, by Country 2020 & 2033
- Table 71: GCC Radiology Information System Industry Revenue (Million) Forecast, by Application 2020 & 2033
- Table 72: GCC Radiology Information System Industry Volume (K Unit) Forecast, by Application 2020 & 2033
- Table 73: South Africa Radiology Information System Industry Revenue (Million) Forecast, by Application 2020 & 2033
- Table 74: South Africa Radiology Information System Industry Volume (K Unit) Forecast, by Application 2020 & 2033
- Table 75: Rest of Middle East and Africa Radiology Information System Industry Revenue (Million) Forecast, by Application 2020 & 2033
- Table 76: Rest of Middle East and Africa Radiology Information System Industry Volume (K Unit) Forecast, by Application 2020 & 2033
- Table 77: Global Radiology Information System Industry Revenue Million Forecast, by Type 2020 & 2033
- Table 78: Global Radiology Information System Industry Volume K Unit Forecast, by Type 2020 & 2033
- Table 79: Global Radiology Information System Industry Revenue Million Forecast, by Deployment Mode 2020 & 2033
- Table 80: Global Radiology Information System Industry Volume K Unit Forecast, by Deployment Mode 2020 & 2033
- Table 81: Global Radiology Information System Industry Revenue Million Forecast, by Component 2020 & 2033
- Table 82: Global Radiology Information System Industry Volume K Unit Forecast, by Component 2020 & 2033
- Table 83: Global Radiology Information System Industry Revenue Million Forecast, by Country 2020 & 2033
- Table 84: Global Radiology Information System Industry Volume K Unit Forecast, by Country 2020 & 2033
- Table 85: Brazil Radiology Information System Industry Revenue (Million) Forecast, by Application 2020 & 2033
- Table 86: Brazil Radiology Information System Industry Volume (K Unit) Forecast, by Application 2020 & 2033
- Table 87: Argentina Radiology Information System Industry Revenue (Million) Forecast, by Application 2020 & 2033
- Table 88: Argentina Radiology Information System Industry Volume (K Unit) Forecast, by Application 2020 & 2033
- Table 89: Rest of South America Radiology Information System Industry Revenue (Million) Forecast, by Application 2020 & 2033
- Table 90: Rest of South America Radiology Information System Industry Volume (K Unit) Forecast, by Application 2020 & 2033
Frequently Asked Questions
1. What is the projected Compound Annual Growth Rate (CAGR) of the Radiology Information System Industry?
The projected CAGR is approximately 8.63%.
2. Which companies are prominent players in the Radiology Information System Industry?
Key companies in the market include Mckesson Corporation, NextGen Healthcare, Kareo, Epic Systems Corporation, Siemens Healthineers, GE Healthcare, Varian Medical Systems Inc, IBM (Merge Healthcare Incorporated), Cerner Corporation, Koninklijke Philips NV, Medinformatix Inc, Allscripts Healthcare Solutions Inc, patientNOW Inc, Konica Minolta Healthcare Americas Inc , Practice Fusion.
3. What are the main segments of the Radiology Information System Industry?
The market segments include Type, Deployment Mode, Component.
4. Can you provide details about the market size?
The market size is estimated to be USD 1.25 Million as of 2022.
5. What are some drivers contributing to market growth?
Improved Healthcare Information Technology Systems; Growth in the Incidence Rate of Chronic Diseases; Increase in Government Funding for Cancer-related Research.
6. What are the notable trends driving market growth?
The Cloud-based Segment is Expected to Witness High Growth over the Forecast Period.
7. Are there any restraints impacting market growth?
High Cost of the Installation; Scarcity of Skilled Labor.
8. Can you provide examples of recent developments in the market?
In March 2022, Intelerad Medical Systems launched the Enterprise Imaging and Informatics Suite at the 2022 Healthcare Information and Management Systems Society (HIMSS) Global Health Conference and Exhibition, which may provide radiologists with an emerging option for medical image management.
9. What pricing options are available for accessing the report?
Pricing options include single-user, multi-user, and enterprise licenses priced at USD 4750, USD 5250, and USD 8750 respectively.
10. Is the market size provided in terms of value or volume?
The market size is provided in terms of value, measured in Million and volume, measured in K Unit.
11. Are there any specific market keywords associated with the report?
Yes, the market keyword associated with the report is "Radiology Information System Industry," which aids in identifying and referencing the specific market segment covered.
12. How do I determine which pricing option suits my needs best?
The pricing options vary based on user requirements and access needs. Individual users may opt for single-user licenses, while businesses requiring broader access may choose multi-user or enterprise licenses for cost-effective access to the report.
13. Are there any additional resources or data provided in the Radiology Information System Industry report?
While the report offers comprehensive insights, it's advisable to review the specific contents or supplementary materials provided to ascertain if additional resources or data are available.
14. How can I stay updated on further developments or reports in the Radiology Information System Industry?
To stay informed about further developments, trends, and reports in the Radiology Information System Industry, consider subscribing to industry newsletters, following relevant companies and organizations, or regularly checking reputable industry news sources and publications.
Methodology
Step 1 - Identification of Relevant Samples Size from Population Database


Step 2 - Approaches for Defining Global Market Size (Value, Volume* & Price*)

Note*: In applicable scenarios
Step 3 - Data Sources
Primary Research
- Web Analytics
- Survey Reports
- Research Institute
- Latest Research Reports
- Opinion Leaders
Secondary Research
- Annual Reports
- White Paper
- Latest Press Release
- Industry Association
- Paid Database
- Investor Presentations

Step 4 - Data Triangulation
Involves using different sources of information in order to increase the validity of a study
These sources are likely to be stakeholders in a program - participants, other researchers, program staff, other community members, and so on.
Then we put all data in single framework & apply various statistical tools to find out the dynamic on the market.
During the analysis stage, feedback from the stakeholder groups would be compared to determine areas of agreement as well as areas of divergence