

Key Insights
The pet obesity management market is poised for significant expansion, propelled by escalating pet ownership, heightened pet humanization, and growing awareness of the health implications of excess weight in companion animals. The market, valued at approximately $9.67 billion in 2025, is projected to grow at a compound annual growth rate (CAGR) of 13.83% from 2025 to 2033. This robust growth trajectory is underpinned by several critical drivers. Firstly, the escalating incidence of pet obesity, mirroring trends in human populations, creates a substantial and expanding addressable market. Secondly, pet owners are increasingly prioritizing preventative healthcare and proactive health management for their pets, driving demand for effective obesity management solutions. The rising adoption of premium pet foods and dietary supplements, coupled with the growing availability of specialized veterinary weight management services, further contributes to market advancement. Moreover, the expanding e-commerce landscape enhances product accessibility and consumer convenience.
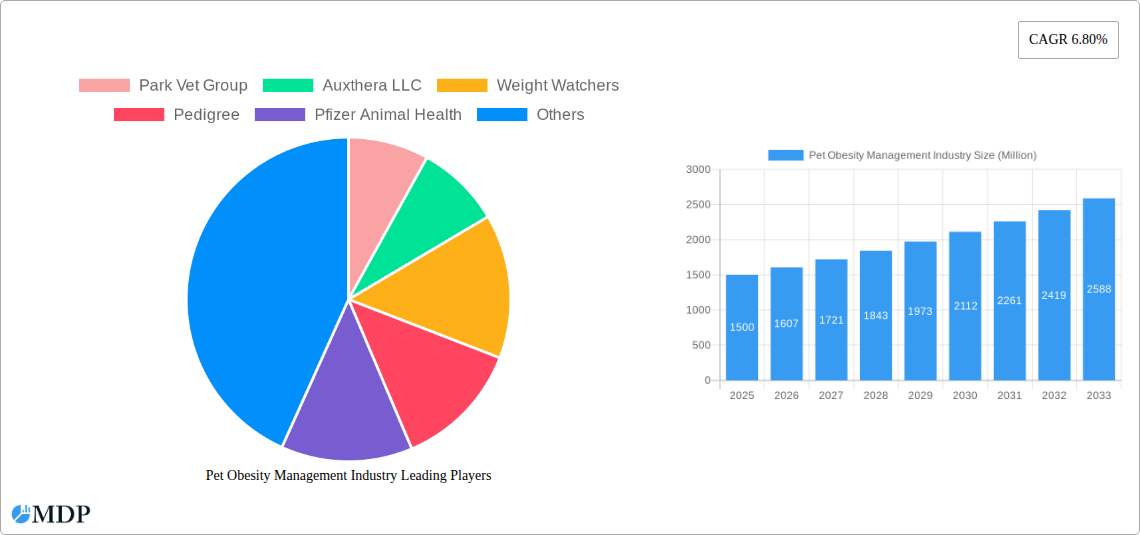
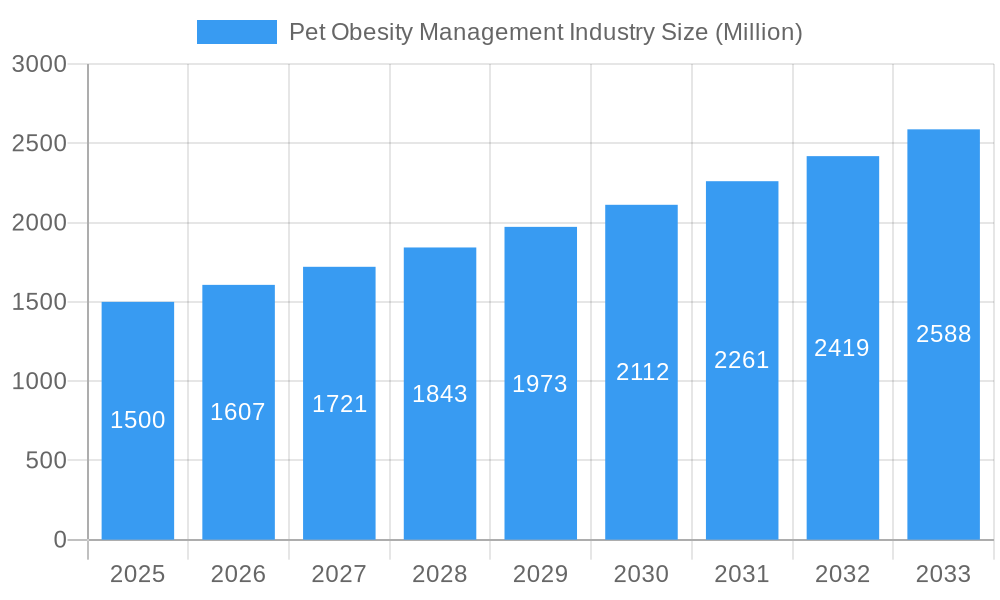
Pet Obesity Management Industry Market Size (In Billion)
Segmentation analysis indicates that the canine segment leads the market, followed by felines, with other animal segments representing a smaller but increasing share. Key distribution channels include pet specialty retailers and online platforms, reflecting evolving consumer purchasing behaviors. Product-wise, the market is segmented into pharmaceuticals and dietary supplements, with supplements expected to capture a larger share due to their broader availability and perceived safety profile. Leading market participants, including Park Vet Group, Auxthera LLC, Weight Watchers, Pedigree, Pfizer Animal Health, Vivaldis, KONG Company, Hills Pet Nutrition Inc, and Royal Canin, are actively engaged in product innovation and portfolio expansion to meet this burgeoning demand, fostering a competitive environment that fuels further market growth. Geographic expansion, particularly within the emerging economies of the Asia-Pacific region, presents considerable future growth prospects. However, potential market restraints include the relatively high cost of specialized pet obesity management products and challenges related to consistent adherence to prescribed treatment regimens.
Pet Obesity Management Industry Company Market Share
Pet Obesity Management Industry: A Comprehensive Market Report (2019-2033)
This comprehensive report provides a detailed analysis of the Pet Obesity Management industry, offering invaluable insights for stakeholders, investors, and industry professionals. With a study period spanning 2019-2033, a base year of 2025, and a forecast period of 2025-2033, this report unveils the market dynamics, trends, and future projections of this rapidly evolving sector. The global market size is predicted to reach xx Million by 2033.
Pet Obesity Management Industry Market Dynamics & Concentration
The pet obesity management market is characterized by moderate concentration, with key players like Park Vet Group, Auxthera LLC, Weight Watchers, Pedigree, Pfizer Animal Health, Vivaldis, KONG Company, Hills Pet Nutrition Inc, and Royal Canin holding significant market share. The market share of these companies collectively is estimated at xx%. Innovation, driven by advancements in pet food formulations and veterinary care, is a key driver. Stringent regulatory frameworks concerning pet food safety and labeling influence market dynamics. Product substitutes, such as alternative diets and lifestyle changes, exert competitive pressure. Increasing pet ownership and rising awareness of pet health contribute to growing end-user demand. M&A activities within the sector are moderate, with xx deals recorded in the historical period (2019-2024), indicating consolidation and growth opportunities.
- Market Concentration: Moderately concentrated, with top players holding xx% market share.
- Innovation Drivers: Advancements in pet food technology and veterinary services.
- Regulatory Framework: Stringent regulations on pet food safety and labeling.
- Product Substitutes: Alternative diets and lifestyle changes.
- End-User Trends: Increasing pet ownership and health awareness.
- M&A Activity: xx deals in 2019-2024, indicating consolidation.
Pet Obesity Management Industry Industry Trends & Analysis
The Pet Obesity Management industry exhibits robust growth, driven by escalating pet ownership, increasing disposable incomes, and heightened awareness regarding pet health. The market is witnessing a shift towards premium and specialized pet food products catering to specific dietary needs and health conditions, including obesity. Technological advancements in pet health monitoring and data analytics are transforming the industry, enabling personalized nutrition plans and proactive health management. The CAGR for the period 2025-2033 is projected to be xx%, with market penetration reaching xx% by 2033. Competitive dynamics are shaped by product differentiation, brand loyalty, and distribution channels. The growing prevalence of pet obesity among dogs and cats fuels market expansion, resulting in increased demand for weight management solutions.
Leading Markets & Segments in Pet Obesity Management Industry
The North American region holds the dominant position in the pet obesity management market, driven by high pet ownership rates, strong consumer spending on pet care, and advanced veterinary infrastructure. The dog segment dominates by animal type, representing approximately xx Million of the market. E-commerce channels witness significant growth, with online pet supply retailers gaining popularity among pet owners. The food supplement segment holds substantial market share, primarily driven by convenience and effectiveness in weight management.
By Animal Type:
- Dogs: Dominates the market due to high prevalence of obesity.
- Cats: Significant market share, with increasing awareness of feline obesity.
- Other Animals: A niche market with moderate growth potential.
By End User:
- Pet Specialty Stores: Holds significant market share due to established distribution network.
- E-commerce: Rapidly growing segment, due to convenience and wider reach.
- Other End Users: Includes veterinarians, breeders etc., providing incremental revenue.
By Product:
- Drugs: Provides prescription medication for managing severe obesity.
- Food Supplements: Largest market segment due to convenience, cost effectiveness, and effectiveness.
Pet Obesity Management Industry Product Developments
Recent advancements focus on developing innovative pet foods and supplements incorporating ingredients proven to aid weight loss and promote metabolic health. Technological integration enables personalized nutrition plans based on pet-specific data. Competition centers around product differentiation, unique ingredient formulations, and effective marketing strategies that highlight health benefits and consumer convenience. The focus is on creating palatable, scientifically-backed solutions that enhance pet health and improve quality of life.
Key Drivers of Pet Obesity Management Industry Growth
The industry's growth is fueled by several key factors: rising pet ownership globally, increasing awareness of pet obesity and its associated health issues, growing expenditure on pet healthcare, advancements in pet food technology leading to the development of specialized weight-management products, and supportive regulatory frameworks. The expansion of e-commerce channels further accelerates market growth. Government initiatives promoting responsible pet ownership also contribute to the market's expansion.
Challenges in the Pet Obesity Management Industry Market
Challenges include the relatively high cost of specialized weight-management products, potential side effects of certain weight-loss medications, the need for consistent owner compliance with dietary and exercise recommendations, and competition from alternative weight management methods. Supply chain disruptions and fluctuations in raw material costs pose additional challenges. Regulatory hurdles in different markets can complicate product launches and distribution. The industry faces increasing pressure to provide sustainable and ethically sourced ingredients.
Emerging Opportunities in Pet Obesity Management Industry
The industry is poised for growth due to the increasing adoption of personalized nutrition plans, based on data-driven insights. Strategic partnerships between pet food companies, veterinary clinics, and technology providers are creating opportunities for innovative solutions. Expansion into emerging markets with growing pet ownership and increasing disposable incomes offers significant growth potential. Development of novel weight management strategies focusing on gut microbiome health presents a significant opportunity.
Leading Players in the Pet Obesity Management Industry Sector
- Park Vet Group
- Auxthera LLC
- Weight Watchers
- Pedigree
- Pfizer Animal Health
- Vivaldis
- KONG Company
- Hills Pet Nutrition Inc
- Royal Canin
Key Milestones in Pet Obesity Management Industry Industry
- May 2022: Park Vet Group launched the Veterinary Nursing Awareness campaign, emphasizing pet nutrition balance.
- January 2022: Alton Brown partnered with Hill's Pet Nutrition to combat pet obesity, providing free educational resources.
Strategic Outlook for Pet Obesity Management Industry Market
The future of the pet obesity management industry is promising. Continued innovation in pet food and supplement formulations, personalized nutrition plans enabled by technology, strategic collaborations, and expansion into new markets will drive substantial growth. A focus on sustainable and ethically sourced ingredients will further enhance the industry's prospects. The market presents substantial opportunities for companies that can deliver effective, convenient, and affordable weight management solutions for pets.
Pet Obesity Management Industry Segmentation
-
1. Products
- 1.1. Drugs
- 1.2. Food Supplements
-
2. Animal Type
- 2.1. Dogs
- 2.2. Cats
- 2.3. Other Animals
-
3. End User
- 3.1. Pet Specialty Stores
- 3.2. E-commerce
- 3.3. Other End Users
Pet Obesity Management Industry Segmentation By Geography
-
1. North America
- 1.1. United States
- 1.2. Canada
- 1.3. Mexico
-
2. Europe
- 2.1. Germany
- 2.2. United Kingdom
- 2.3. France
- 2.4. Italy
- 2.5. Spain
- 2.6. Rest of Europe
-
3. Asia Pacific
- 3.1. China
- 3.2. Japan
- 3.3. India
- 3.4. Australia
- 3.5. South Korea
- 3.6. Rest of Asia Pacific
-
4. Middle East and Africa
- 4.1. GCC
- 4.2. South Africa
- 4.3. Rest of Middle East and Africa
-
5. South America
- 5.1. Brazil
- 5.2. Argentina
- 5.3. Rest of South America
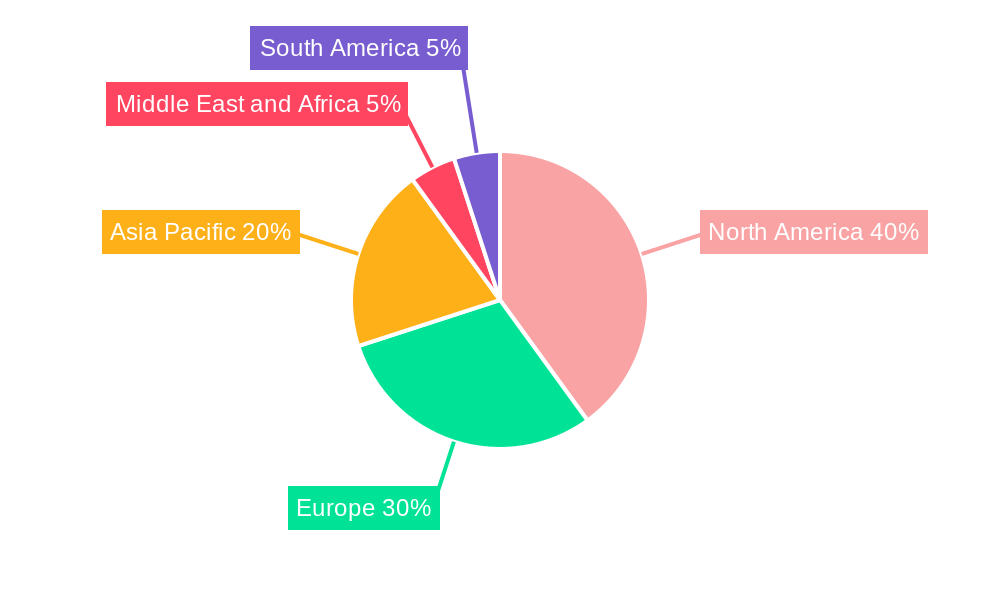
Pet Obesity Management Industry Regional Market Share
Geographic Coverage of Pet Obesity Management Industry
Pet Obesity Management Industry REPORT HIGHLIGHTS
| Aspects | Details |
|---|---|
| Study Period | 2020-2034 |
| Base Year | 2025 |
| Estimated Year | 2026 |
| Forecast Period | 2026-2034 |
| Historical Period | 2020-2025 |
| Growth Rate | CAGR of 13.83% from 2020-2034 |
| Segmentation |
|
Table of Contents
- 1. Introduction
- 1.1. Research Scope
- 1.2. Market Segmentation
- 1.3. Research Objective
- 1.4. Definitions and Assumptions
- 2. Executive Summary
- 2.1. Market Snapshot
- 3. Market Dynamics
- 3.1. Market Drivers
- 3.2. Market Restrains
- 3.3. Market Trends
- 3.4. Market Opportunities
- 4. Market Factor Analysis
- 4.1. Porters Five Forces
- 4.1.1. Bargaining Power of Suppliers
- 4.1.2. Bargaining Power of Buyers
- 4.1.3. Threat of New Entrants
- 4.1.4. Threat of Substitutes
- 4.1.5. Competitive Rivalry
- 4.2. PESTEL analysis
- 4.3. BCG Analysis
- 4.3.1. Stars (High Growth, High Market Share)
- 4.3.2. Cash Cows (Low Growth, High Market Share)
- 4.3.3. Question Mark (High Growth, Low Market Share)
- 4.3.4. Dogs (Low Growth, Low Market Share)
- 4.4. Ansoff Matrix Analysis
- 4.5. Supply Chain Analysis
- 4.6. Regulatory Landscape
- 4.7. Current Market Potential and Opportunity Assessment (TAM–SAM–SOM Framework)
- 4.8. MDP Analyst Note
- 4.1. Porters Five Forces
- 5. Market Analysis, Insights and Forecast 2021-2033
- 5.1. Market Analysis, Insights and Forecast - by Products
- 5.1.1. Drugs
- 5.1.2. Food Supplements
- 5.2. Market Analysis, Insights and Forecast - by Animal Type
- 5.2.1. Dogs
- 5.2.2. Cats
- 5.2.3. Other Animals
- 5.3. Market Analysis, Insights and Forecast - by End User
- 5.3.1. Pet Specialty Stores
- 5.3.2. E-commerce
- 5.3.3. Other End Users
- 5.4. Market Analysis, Insights and Forecast - by Region
- 5.4.1. North America
- 5.4.2. Europe
- 5.4.3. Asia Pacific
- 5.4.4. Middle East and Africa
- 5.4.5. South America
- 5.1. Market Analysis, Insights and Forecast - by Products
- 6. Global Pet Obesity Management Industry Analysis, Insights and Forecast, 2021-2033
- 6.1. Market Analysis, Insights and Forecast - by Products
- 6.1.1. Drugs
- 6.1.2. Food Supplements
- 6.2. Market Analysis, Insights and Forecast - by Animal Type
- 6.2.1. Dogs
- 6.2.2. Cats
- 6.2.3. Other Animals
- 6.3. Market Analysis, Insights and Forecast - by End User
- 6.3.1. Pet Specialty Stores
- 6.3.2. E-commerce
- 6.3.3. Other End Users
- 6.1. Market Analysis, Insights and Forecast - by Products
- 7. North America Pet Obesity Management Industry Analysis, Insights and Forecast, 2020-2032
- 7.1. Market Analysis, Insights and Forecast - by Products
- 7.1.1. Drugs
- 7.1.2. Food Supplements
- 7.2. Market Analysis, Insights and Forecast - by Animal Type
- 7.2.1. Dogs
- 7.2.2. Cats
- 7.2.3. Other Animals
- 7.3. Market Analysis, Insights and Forecast - by End User
- 7.3.1. Pet Specialty Stores
- 7.3.2. E-commerce
- 7.3.3. Other End Users
- 7.1. Market Analysis, Insights and Forecast - by Products
- 8. Europe Pet Obesity Management Industry Analysis, Insights and Forecast, 2020-2032
- 8.1. Market Analysis, Insights and Forecast - by Products
- 8.1.1. Drugs
- 8.1.2. Food Supplements
- 8.2. Market Analysis, Insights and Forecast - by Animal Type
- 8.2.1. Dogs
- 8.2.2. Cats
- 8.2.3. Other Animals
- 8.3. Market Analysis, Insights and Forecast - by End User
- 8.3.1. Pet Specialty Stores
- 8.3.2. E-commerce
- 8.3.3. Other End Users
- 8.1. Market Analysis, Insights and Forecast - by Products
- 9. Asia Pacific Pet Obesity Management Industry Analysis, Insights and Forecast, 2020-2032
- 9.1. Market Analysis, Insights and Forecast - by Products
- 9.1.1. Drugs
- 9.1.2. Food Supplements
- 9.2. Market Analysis, Insights and Forecast - by Animal Type
- 9.2.1. Dogs
- 9.2.2. Cats
- 9.2.3. Other Animals
- 9.3. Market Analysis, Insights and Forecast - by End User
- 9.3.1. Pet Specialty Stores
- 9.3.2. E-commerce
- 9.3.3. Other End Users
- 9.1. Market Analysis, Insights and Forecast - by Products
- 10. Middle East and Africa Pet Obesity Management Industry Analysis, Insights and Forecast, 2020-2032
- 10.1. Market Analysis, Insights and Forecast - by Products
- 10.1.1. Drugs
- 10.1.2. Food Supplements
- 10.2. Market Analysis, Insights and Forecast - by Animal Type
- 10.2.1. Dogs
- 10.2.2. Cats
- 10.2.3. Other Animals
- 10.3. Market Analysis, Insights and Forecast - by End User
- 10.3.1. Pet Specialty Stores
- 10.3.2. E-commerce
- 10.3.3. Other End Users
- 10.1. Market Analysis, Insights and Forecast - by Products
- 11. South America Pet Obesity Management Industry Analysis, Insights and Forecast, 2020-2032
- 11.1. Market Analysis, Insights and Forecast - by Products
- 11.1.1. Drugs
- 11.1.2. Food Supplements
- 11.2. Market Analysis, Insights and Forecast - by Animal Type
- 11.2.1. Dogs
- 11.2.2. Cats
- 11.2.3. Other Animals
- 11.3. Market Analysis, Insights and Forecast - by End User
- 11.3.1. Pet Specialty Stores
- 11.3.2. E-commerce
- 11.3.3. Other End Users
- 11.1. Market Analysis, Insights and Forecast - by Products
- 12. Competitive Analysis
- 12.1. Company Profiles
- 12.1.1 Park Vet Group
- 12.1.1.1. Company Overview
- 12.1.1.2. Products
- 12.1.1.3. Company Financials
- 12.1.1.4. SWOT Analysis
- 12.1.2 Auxthera LLC
- 12.1.2.1. Company Overview
- 12.1.2.2. Products
- 12.1.2.3. Company Financials
- 12.1.2.4. SWOT Analysis
- 12.1.3 Weight Watchers
- 12.1.3.1. Company Overview
- 12.1.3.2. Products
- 12.1.3.3. Company Financials
- 12.1.3.4. SWOT Analysis
- 12.1.4 Pedigree
- 12.1.4.1. Company Overview
- 12.1.4.2. Products
- 12.1.4.3. Company Financials
- 12.1.4.4. SWOT Analysis
- 12.1.5 Pfizer Animal Health
- 12.1.5.1. Company Overview
- 12.1.5.2. Products
- 12.1.5.3. Company Financials
- 12.1.5.4. SWOT Analysis
- 12.1.6 Vivaldis
- 12.1.6.1. Company Overview
- 12.1.6.2. Products
- 12.1.6.3. Company Financials
- 12.1.6.4. SWOT Analysis
- 12.1.7 KONG Company
- 12.1.7.1. Company Overview
- 12.1.7.2. Products
- 12.1.7.3. Company Financials
- 12.1.7.4. SWOT Analysis
- 12.1.8 Hills Pet Nutrition Inc
- 12.1.8.1. Company Overview
- 12.1.8.2. Products
- 12.1.8.3. Company Financials
- 12.1.8.4. SWOT Analysis
- 12.1.9 Royal Canin
- 12.1.9.1. Company Overview
- 12.1.9.2. Products
- 12.1.9.3. Company Financials
- 12.1.9.4. SWOT Analysis
- 12.1.1 Park Vet Group
- 12.2. Market Entropy
- 12.2.1 Company's Key Areas Served
- 12.2.2 Recent Developments
- 12.3. Company Market Share Analysis 2025
- 12.3.1 Top 5 Companies Market Share Analysis
- 12.3.2 Top 3 Companies Market Share Analysis
- 12.4. List of Potential Customers
- 13. Research Methodology
List of Figures
- Figure 1: Global Pet Obesity Management Industry Revenue Breakdown (billion, %) by Region 2025 & 2033
- Figure 2: Global Pet Obesity Management Industry Volume Breakdown (K Unit, %) by Region 2025 & 2033
- Figure 3: North America Pet Obesity Management Industry Revenue (billion), by Products 2025 & 2033
- Figure 4: North America Pet Obesity Management Industry Volume (K Unit), by Products 2025 & 2033
- Figure 5: North America Pet Obesity Management Industry Revenue Share (%), by Products 2025 & 2033
- Figure 6: North America Pet Obesity Management Industry Volume Share (%), by Products 2025 & 2033
- Figure 7: North America Pet Obesity Management Industry Revenue (billion), by Animal Type 2025 & 2033
- Figure 8: North America Pet Obesity Management Industry Volume (K Unit), by Animal Type 2025 & 2033
- Figure 9: North America Pet Obesity Management Industry Revenue Share (%), by Animal Type 2025 & 2033
- Figure 10: North America Pet Obesity Management Industry Volume Share (%), by Animal Type 2025 & 2033
- Figure 11: North America Pet Obesity Management Industry Revenue (billion), by End User 2025 & 2033
- Figure 12: North America Pet Obesity Management Industry Volume (K Unit), by End User 2025 & 2033
- Figure 13: North America Pet Obesity Management Industry Revenue Share (%), by End User 2025 & 2033
- Figure 14: North America Pet Obesity Management Industry Volume Share (%), by End User 2025 & 2033
- Figure 15: North America Pet Obesity Management Industry Revenue (billion), by Country 2025 & 2033
- Figure 16: North America Pet Obesity Management Industry Volume (K Unit), by Country 2025 & 2033
- Figure 17: North America Pet Obesity Management Industry Revenue Share (%), by Country 2025 & 2033
- Figure 18: North America Pet Obesity Management Industry Volume Share (%), by Country 2025 & 2033
- Figure 19: Europe Pet Obesity Management Industry Revenue (billion), by Products 2025 & 2033
- Figure 20: Europe Pet Obesity Management Industry Volume (K Unit), by Products 2025 & 2033
- Figure 21: Europe Pet Obesity Management Industry Revenue Share (%), by Products 2025 & 2033
- Figure 22: Europe Pet Obesity Management Industry Volume Share (%), by Products 2025 & 2033
- Figure 23: Europe Pet Obesity Management Industry Revenue (billion), by Animal Type 2025 & 2033
- Figure 24: Europe Pet Obesity Management Industry Volume (K Unit), by Animal Type 2025 & 2033
- Figure 25: Europe Pet Obesity Management Industry Revenue Share (%), by Animal Type 2025 & 2033
- Figure 26: Europe Pet Obesity Management Industry Volume Share (%), by Animal Type 2025 & 2033
- Figure 27: Europe Pet Obesity Management Industry Revenue (billion), by End User 2025 & 2033
- Figure 28: Europe Pet Obesity Management Industry Volume (K Unit), by End User 2025 & 2033
- Figure 29: Europe Pet Obesity Management Industry Revenue Share (%), by End User 2025 & 2033
- Figure 30: Europe Pet Obesity Management Industry Volume Share (%), by End User 2025 & 2033
- Figure 31: Europe Pet Obesity Management Industry Revenue (billion), by Country 2025 & 2033
- Figure 32: Europe Pet Obesity Management Industry Volume (K Unit), by Country 2025 & 2033
- Figure 33: Europe Pet Obesity Management Industry Revenue Share (%), by Country 2025 & 2033
- Figure 34: Europe Pet Obesity Management Industry Volume Share (%), by Country 2025 & 2033
- Figure 35: Asia Pacific Pet Obesity Management Industry Revenue (billion), by Products 2025 & 2033
- Figure 36: Asia Pacific Pet Obesity Management Industry Volume (K Unit), by Products 2025 & 2033
- Figure 37: Asia Pacific Pet Obesity Management Industry Revenue Share (%), by Products 2025 & 2033
- Figure 38: Asia Pacific Pet Obesity Management Industry Volume Share (%), by Products 2025 & 2033
- Figure 39: Asia Pacific Pet Obesity Management Industry Revenue (billion), by Animal Type 2025 & 2033
- Figure 40: Asia Pacific Pet Obesity Management Industry Volume (K Unit), by Animal Type 2025 & 2033
- Figure 41: Asia Pacific Pet Obesity Management Industry Revenue Share (%), by Animal Type 2025 & 2033
- Figure 42: Asia Pacific Pet Obesity Management Industry Volume Share (%), by Animal Type 2025 & 2033
- Figure 43: Asia Pacific Pet Obesity Management Industry Revenue (billion), by End User 2025 & 2033
- Figure 44: Asia Pacific Pet Obesity Management Industry Volume (K Unit), by End User 2025 & 2033
- Figure 45: Asia Pacific Pet Obesity Management Industry Revenue Share (%), by End User 2025 & 2033
- Figure 46: Asia Pacific Pet Obesity Management Industry Volume Share (%), by End User 2025 & 2033
- Figure 47: Asia Pacific Pet Obesity Management Industry Revenue (billion), by Country 2025 & 2033
- Figure 48: Asia Pacific Pet Obesity Management Industry Volume (K Unit), by Country 2025 & 2033
- Figure 49: Asia Pacific Pet Obesity Management Industry Revenue Share (%), by Country 2025 & 2033
- Figure 50: Asia Pacific Pet Obesity Management Industry Volume Share (%), by Country 2025 & 2033
- Figure 51: Middle East and Africa Pet Obesity Management Industry Revenue (billion), by Products 2025 & 2033
- Figure 52: Middle East and Africa Pet Obesity Management Industry Volume (K Unit), by Products 2025 & 2033
- Figure 53: Middle East and Africa Pet Obesity Management Industry Revenue Share (%), by Products 2025 & 2033
- Figure 54: Middle East and Africa Pet Obesity Management Industry Volume Share (%), by Products 2025 & 2033
- Figure 55: Middle East and Africa Pet Obesity Management Industry Revenue (billion), by Animal Type 2025 & 2033
- Figure 56: Middle East and Africa Pet Obesity Management Industry Volume (K Unit), by Animal Type 2025 & 2033
- Figure 57: Middle East and Africa Pet Obesity Management Industry Revenue Share (%), by Animal Type 2025 & 2033
- Figure 58: Middle East and Africa Pet Obesity Management Industry Volume Share (%), by Animal Type 2025 & 2033
- Figure 59: Middle East and Africa Pet Obesity Management Industry Revenue (billion), by End User 2025 & 2033
- Figure 60: Middle East and Africa Pet Obesity Management Industry Volume (K Unit), by End User 2025 & 2033
- Figure 61: Middle East and Africa Pet Obesity Management Industry Revenue Share (%), by End User 2025 & 2033
- Figure 62: Middle East and Africa Pet Obesity Management Industry Volume Share (%), by End User 2025 & 2033
- Figure 63: Middle East and Africa Pet Obesity Management Industry Revenue (billion), by Country 2025 & 2033
- Figure 64: Middle East and Africa Pet Obesity Management Industry Volume (K Unit), by Country 2025 & 2033
- Figure 65: Middle East and Africa Pet Obesity Management Industry Revenue Share (%), by Country 2025 & 2033
- Figure 66: Middle East and Africa Pet Obesity Management Industry Volume Share (%), by Country 2025 & 2033
- Figure 67: South America Pet Obesity Management Industry Revenue (billion), by Products 2025 & 2033
- Figure 68: South America Pet Obesity Management Industry Volume (K Unit), by Products 2025 & 2033
- Figure 69: South America Pet Obesity Management Industry Revenue Share (%), by Products 2025 & 2033
- Figure 70: South America Pet Obesity Management Industry Volume Share (%), by Products 2025 & 2033
- Figure 71: South America Pet Obesity Management Industry Revenue (billion), by Animal Type 2025 & 2033
- Figure 72: South America Pet Obesity Management Industry Volume (K Unit), by Animal Type 2025 & 2033
- Figure 73: South America Pet Obesity Management Industry Revenue Share (%), by Animal Type 2025 & 2033
- Figure 74: South America Pet Obesity Management Industry Volume Share (%), by Animal Type 2025 & 2033
- Figure 75: South America Pet Obesity Management Industry Revenue (billion), by End User 2025 & 2033
- Figure 76: South America Pet Obesity Management Industry Volume (K Unit), by End User 2025 & 2033
- Figure 77: South America Pet Obesity Management Industry Revenue Share (%), by End User 2025 & 2033
- Figure 78: South America Pet Obesity Management Industry Volume Share (%), by End User 2025 & 2033
- Figure 79: South America Pet Obesity Management Industry Revenue (billion), by Country 2025 & 2033
- Figure 80: South America Pet Obesity Management Industry Volume (K Unit), by Country 2025 & 2033
- Figure 81: South America Pet Obesity Management Industry Revenue Share (%), by Country 2025 & 2033
- Figure 82: South America Pet Obesity Management Industry Volume Share (%), by Country 2025 & 2033
List of Tables
- Table 1: Global Pet Obesity Management Industry Revenue billion Forecast, by Products 2020 & 2033
- Table 2: Global Pet Obesity Management Industry Volume K Unit Forecast, by Products 2020 & 2033
- Table 3: Global Pet Obesity Management Industry Revenue billion Forecast, by Animal Type 2020 & 2033
- Table 4: Global Pet Obesity Management Industry Volume K Unit Forecast, by Animal Type 2020 & 2033
- Table 5: Global Pet Obesity Management Industry Revenue billion Forecast, by End User 2020 & 2033
- Table 6: Global Pet Obesity Management Industry Volume K Unit Forecast, by End User 2020 & 2033
- Table 7: Global Pet Obesity Management Industry Revenue billion Forecast, by Region 2020 & 2033
- Table 8: Global Pet Obesity Management Industry Volume K Unit Forecast, by Region 2020 & 2033
- Table 9: Global Pet Obesity Management Industry Revenue billion Forecast, by Products 2020 & 2033
- Table 10: Global Pet Obesity Management Industry Volume K Unit Forecast, by Products 2020 & 2033
- Table 11: Global Pet Obesity Management Industry Revenue billion Forecast, by Animal Type 2020 & 2033
- Table 12: Global Pet Obesity Management Industry Volume K Unit Forecast, by Animal Type 2020 & 2033
- Table 13: Global Pet Obesity Management Industry Revenue billion Forecast, by End User 2020 & 2033
- Table 14: Global Pet Obesity Management Industry Volume K Unit Forecast, by End User 2020 & 2033
- Table 15: Global Pet Obesity Management Industry Revenue billion Forecast, by Country 2020 & 2033
- Table 16: Global Pet Obesity Management Industry Volume K Unit Forecast, by Country 2020 & 2033
- Table 17: United States Pet Obesity Management Industry Revenue (billion) Forecast, by Application 2020 & 2033
- Table 18: United States Pet Obesity Management Industry Volume (K Unit) Forecast, by Application 2020 & 2033
- Table 19: Canada Pet Obesity Management Industry Revenue (billion) Forecast, by Application 2020 & 2033
- Table 20: Canada Pet Obesity Management Industry Volume (K Unit) Forecast, by Application 2020 & 2033
- Table 21: Mexico Pet Obesity Management Industry Revenue (billion) Forecast, by Application 2020 & 2033
- Table 22: Mexico Pet Obesity Management Industry Volume (K Unit) Forecast, by Application 2020 & 2033
- Table 23: Global Pet Obesity Management Industry Revenue billion Forecast, by Products 2020 & 2033
- Table 24: Global Pet Obesity Management Industry Volume K Unit Forecast, by Products 2020 & 2033
- Table 25: Global Pet Obesity Management Industry Revenue billion Forecast, by Animal Type 2020 & 2033
- Table 26: Global Pet Obesity Management Industry Volume K Unit Forecast, by Animal Type 2020 & 2033
- Table 27: Global Pet Obesity Management Industry Revenue billion Forecast, by End User 2020 & 2033
- Table 28: Global Pet Obesity Management Industry Volume K Unit Forecast, by End User 2020 & 2033
- Table 29: Global Pet Obesity Management Industry Revenue billion Forecast, by Country 2020 & 2033
- Table 30: Global Pet Obesity Management Industry Volume K Unit Forecast, by Country 2020 & 2033
- Table 31: Germany Pet Obesity Management Industry Revenue (billion) Forecast, by Application 2020 & 2033
- Table 32: Germany Pet Obesity Management Industry Volume (K Unit) Forecast, by Application 2020 & 2033
- Table 33: United Kingdom Pet Obesity Management Industry Revenue (billion) Forecast, by Application 2020 & 2033
- Table 34: United Kingdom Pet Obesity Management Industry Volume (K Unit) Forecast, by Application 2020 & 2033
- Table 35: France Pet Obesity Management Industry Revenue (billion) Forecast, by Application 2020 & 2033
- Table 36: France Pet Obesity Management Industry Volume (K Unit) Forecast, by Application 2020 & 2033
- Table 37: Italy Pet Obesity Management Industry Revenue (billion) Forecast, by Application 2020 & 2033
- Table 38: Italy Pet Obesity Management Industry Volume (K Unit) Forecast, by Application 2020 & 2033
- Table 39: Spain Pet Obesity Management Industry Revenue (billion) Forecast, by Application 2020 & 2033
- Table 40: Spain Pet Obesity Management Industry Volume (K Unit) Forecast, by Application 2020 & 2033
- Table 41: Rest of Europe Pet Obesity Management Industry Revenue (billion) Forecast, by Application 2020 & 2033
- Table 42: Rest of Europe Pet Obesity Management Industry Volume (K Unit) Forecast, by Application 2020 & 2033
- Table 43: Global Pet Obesity Management Industry Revenue billion Forecast, by Products 2020 & 2033
- Table 44: Global Pet Obesity Management Industry Volume K Unit Forecast, by Products 2020 & 2033
- Table 45: Global Pet Obesity Management Industry Revenue billion Forecast, by Animal Type 2020 & 2033
- Table 46: Global Pet Obesity Management Industry Volume K Unit Forecast, by Animal Type 2020 & 2033
- Table 47: Global Pet Obesity Management Industry Revenue billion Forecast, by End User 2020 & 2033
- Table 48: Global Pet Obesity Management Industry Volume K Unit Forecast, by End User 2020 & 2033
- Table 49: Global Pet Obesity Management Industry Revenue billion Forecast, by Country 2020 & 2033
- Table 50: Global Pet Obesity Management Industry Volume K Unit Forecast, by Country 2020 & 2033
- Table 51: China Pet Obesity Management Industry Revenue (billion) Forecast, by Application 2020 & 2033
- Table 52: China Pet Obesity Management Industry Volume (K Unit) Forecast, by Application 2020 & 2033
- Table 53: Japan Pet Obesity Management Industry Revenue (billion) Forecast, by Application 2020 & 2033
- Table 54: Japan Pet Obesity Management Industry Volume (K Unit) Forecast, by Application 2020 & 2033
- Table 55: India Pet Obesity Management Industry Revenue (billion) Forecast, by Application 2020 & 2033
- Table 56: India Pet Obesity Management Industry Volume (K Unit) Forecast, by Application 2020 & 2033
- Table 57: Australia Pet Obesity Management Industry Revenue (billion) Forecast, by Application 2020 & 2033
- Table 58: Australia Pet Obesity Management Industry Volume (K Unit) Forecast, by Application 2020 & 2033
- Table 59: South Korea Pet Obesity Management Industry Revenue (billion) Forecast, by Application 2020 & 2033
- Table 60: South Korea Pet Obesity Management Industry Volume (K Unit) Forecast, by Application 2020 & 2033
- Table 61: Rest of Asia Pacific Pet Obesity Management Industry Revenue (billion) Forecast, by Application 2020 & 2033
- Table 62: Rest of Asia Pacific Pet Obesity Management Industry Volume (K Unit) Forecast, by Application 2020 & 2033
- Table 63: Global Pet Obesity Management Industry Revenue billion Forecast, by Products 2020 & 2033
- Table 64: Global Pet Obesity Management Industry Volume K Unit Forecast, by Products 2020 & 2033
- Table 65: Global Pet Obesity Management Industry Revenue billion Forecast, by Animal Type 2020 & 2033
- Table 66: Global Pet Obesity Management Industry Volume K Unit Forecast, by Animal Type 2020 & 2033
- Table 67: Global Pet Obesity Management Industry Revenue billion Forecast, by End User 2020 & 2033
- Table 68: Global Pet Obesity Management Industry Volume K Unit Forecast, by End User 2020 & 2033
- Table 69: Global Pet Obesity Management Industry Revenue billion Forecast, by Country 2020 & 2033
- Table 70: Global Pet Obesity Management Industry Volume K Unit Forecast, by Country 2020 & 2033
- Table 71: GCC Pet Obesity Management Industry Revenue (billion) Forecast, by Application 2020 & 2033
- Table 72: GCC Pet Obesity Management Industry Volume (K Unit) Forecast, by Application 2020 & 2033
- Table 73: South Africa Pet Obesity Management Industry Revenue (billion) Forecast, by Application 2020 & 2033
- Table 74: South Africa Pet Obesity Management Industry Volume (K Unit) Forecast, by Application 2020 & 2033
- Table 75: Rest of Middle East and Africa Pet Obesity Management Industry Revenue (billion) Forecast, by Application 2020 & 2033
- Table 76: Rest of Middle East and Africa Pet Obesity Management Industry Volume (K Unit) Forecast, by Application 2020 & 2033
- Table 77: Global Pet Obesity Management Industry Revenue billion Forecast, by Products 2020 & 2033
- Table 78: Global Pet Obesity Management Industry Volume K Unit Forecast, by Products 2020 & 2033
- Table 79: Global Pet Obesity Management Industry Revenue billion Forecast, by Animal Type 2020 & 2033
- Table 80: Global Pet Obesity Management Industry Volume K Unit Forecast, by Animal Type 2020 & 2033
- Table 81: Global Pet Obesity Management Industry Revenue billion Forecast, by End User 2020 & 2033
- Table 82: Global Pet Obesity Management Industry Volume K Unit Forecast, by End User 2020 & 2033
- Table 83: Global Pet Obesity Management Industry Revenue billion Forecast, by Country 2020 & 2033
- Table 84: Global Pet Obesity Management Industry Volume K Unit Forecast, by Country 2020 & 2033
- Table 85: Brazil Pet Obesity Management Industry Revenue (billion) Forecast, by Application 2020 & 2033
- Table 86: Brazil Pet Obesity Management Industry Volume (K Unit) Forecast, by Application 2020 & 2033
- Table 87: Argentina Pet Obesity Management Industry Revenue (billion) Forecast, by Application 2020 & 2033
- Table 88: Argentina Pet Obesity Management Industry Volume (K Unit) Forecast, by Application 2020 & 2033
- Table 89: Rest of South America Pet Obesity Management Industry Revenue (billion) Forecast, by Application 2020 & 2033
- Table 90: Rest of South America Pet Obesity Management Industry Volume (K Unit) Forecast, by Application 2020 & 2033
Frequently Asked Questions
1. What is the projected Compound Annual Growth Rate (CAGR) of the Pet Obesity Management Industry?
The projected CAGR is approximately 13.83%.
2. Which companies are prominent players in the Pet Obesity Management Industry?
Key companies in the market include Park Vet Group, Auxthera LLC, Weight Watchers, Pedigree, Pfizer Animal Health, Vivaldis, KONG Company, Hills Pet Nutrition Inc, Royal Canin.
3. What are the main segments of the Pet Obesity Management Industry?
The market segments include Products, Animal Type, End User.
4. Can you provide details about the market size?
The market size is estimated to be USD 9.67 billion as of 2022.
5. What are some drivers contributing to market growth?
Increasing Pet Ownership; Increasing Prevalence of Diabetes and Other Chronic Diseases Among Pets; Increasing Pet Insurance Policies and Coverage.
6. What are the notable trends driving market growth?
Dogs Segment is Expected to Hold a Major Share in the Pet Obesity Management Market.
7. Are there any restraints impacting market growth?
Lack of Awareness About Pet Obesity Management in Developing Economies.
8. Can you provide examples of recent developments in the market?
In May 2022, Park Vet Group launched the Veterinary Nursing Awareness campaign to raise awareness regarding the importance of veterinary nursing and pet nutrition balances.
9. What pricing options are available for accessing the report?
Pricing options include single-user, multi-user, and enterprise licenses priced at USD 4750, USD 5250, and USD 8750 respectively.
10. Is the market size provided in terms of value or volume?
The market size is provided in terms of value, measured in billion and volume, measured in K Unit.
11. Are there any specific market keywords associated with the report?
Yes, the market keyword associated with the report is "Pet Obesity Management Industry," which aids in identifying and referencing the specific market segment covered.
12. How do I determine which pricing option suits my needs best?
The pricing options vary based on user requirements and access needs. Individual users may opt for single-user licenses, while businesses requiring broader access may choose multi-user or enterprise licenses for cost-effective access to the report.
13. Are there any additional resources or data provided in the Pet Obesity Management Industry report?
While the report offers comprehensive insights, it's advisable to review the specific contents or supplementary materials provided to ascertain if additional resources or data are available.
14. How can I stay updated on further developments or reports in the Pet Obesity Management Industry?
To stay informed about further developments, trends, and reports in the Pet Obesity Management Industry, consider subscribing to industry newsletters, following relevant companies and organizations, or regularly checking reputable industry news sources and publications.
Methodology
Step 1 - Identification of Relevant Samples Size from Population Database


Step 2 - Approaches for Defining Global Market Size (Value, Volume* & Price*)

Note*: In applicable scenarios
Step 3 - Data Sources
Primary Research
- Web Analytics
- Survey Reports
- Research Institute
- Latest Research Reports
- Opinion Leaders
Secondary Research
- Annual Reports
- White Paper
- Latest Press Release
- Industry Association
- Paid Database
- Investor Presentations

Step 4 - Data Triangulation
Involves using different sources of information in order to increase the validity of a study
These sources are likely to be stakeholders in a program - participants, other researchers, program staff, other community members, and so on.
Then we put all data in single framework & apply various statistical tools to find out the dynamic on the market.
During the analysis stage, feedback from the stakeholder groups would be compared to determine areas of agreement as well as areas of divergence