

Key Insights
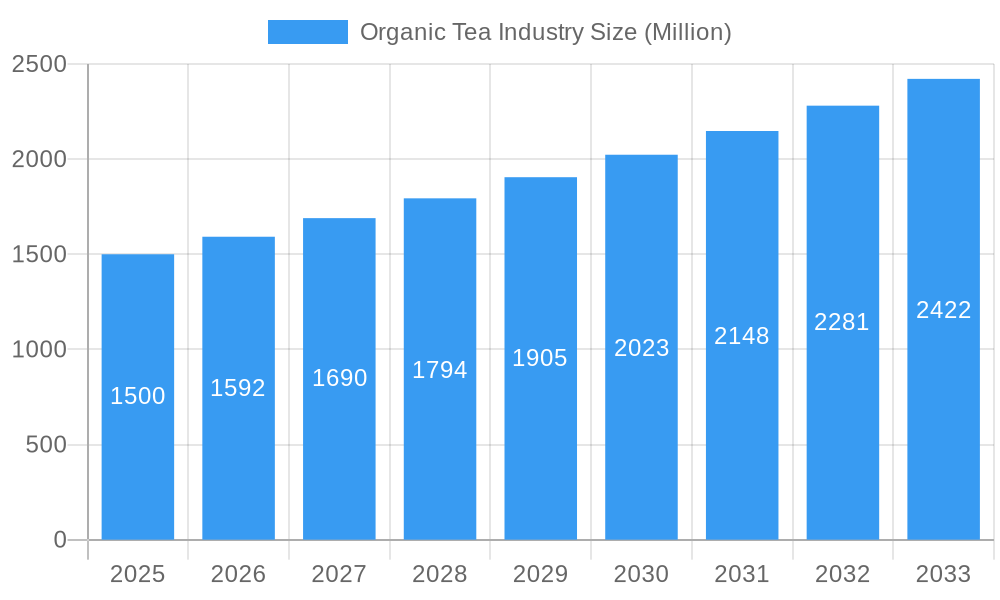
The organic tea market, valued at approximately 93.9 million in 2025, is projected to expand at a Compound Annual Growth Rate (CAGR) of 5.2% from 2025 to 2033. This expansion is propelled by escalating consumer awareness of organic tea's health and wellness advantages, alongside a growing preference for natural and ethically sourced products. The diverse range of organic tea varieties and packaging formats caters to varied consumer needs, while the growth of online retail enhances accessibility and market reach. Despite price sensitivity and competition from conventional tea, the trend towards premiumization and demand for specialized organic blends are expected to counter these challenges. North America and Europe currently lead market performance due to high disposable incomes and established health-conscious demographics. Asia-Pacific, particularly India and China, presents significant growth potential due to their large populations and increasing adoption of organic lifestyles.
Organic Tea Industry Market Size (In Million)
Segmentation analysis indicates that black organic tea holds the largest market share, followed by green organic tea. However, oolong and specialty organic teas are experiencing rapid growth, reflecting shifting consumer tastes. Tea bags remain the preferred packaging due to convenience, while cartons and paper pouches are gaining traction among environmentally conscious consumers seeking sustainable options. Supermarkets and hypermarkets are the primary distribution channels, though online retail is exhibiting substantial growth, improving accessibility and driving market expansion. Key industry players are strategically investing in product innovation, brand development, and distribution network expansion to secure a greater market share. The forecast period (2025-2033) predicts sustained growth driven by evolving consumer preferences and continuous industry innovation.
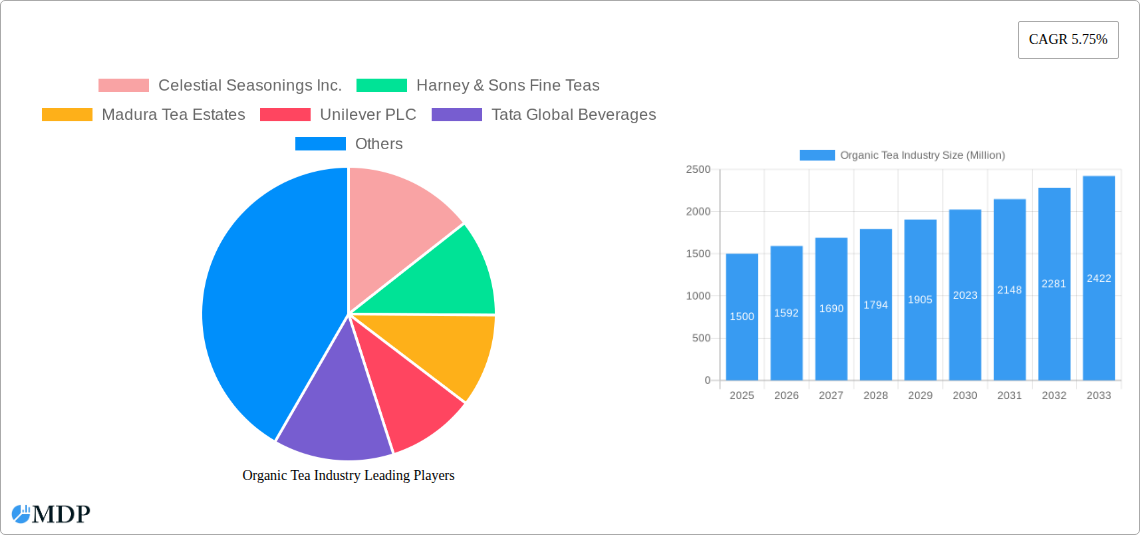
Organic Tea Industry Company Market Share
Organic Tea Industry: A Comprehensive Market Report (2019-2033)
This comprehensive report provides an in-depth analysis of the global organic tea market, offering invaluable insights for industry stakeholders, investors, and businesses seeking to navigate this dynamic sector. With a study period spanning 2019-2033, a base year of 2025, and a forecast period of 2025-2033, this report delivers a robust understanding of past trends, current market dynamics, and future growth potential. The market is projected to reach xx Million by 2033, exhibiting a significant CAGR of xx%.
Organic Tea Industry Market Dynamics & Concentration
The organic tea market exhibits a moderately concentrated landscape, with key players like Unilever PLC and Tata Global Beverages holding significant market share. However, smaller, specialized brands like Numi Inc PBC and Celestial Seasonings Inc. are also gaining traction through niche offerings and strong brand loyalty. Market concentration is influenced by factors including brand recognition, distribution networks, and innovation capabilities.
Innovation Drivers: The industry is driven by continuous innovation in product types (e.g., functional teas, flavored blends), packaging (e.g., sustainable and convenient options), and distribution channels (e.g., e-commerce expansion).
Regulatory Frameworks: Stringent organic certification standards and regulations influence production practices and market access, shaping the competitive landscape.
Product Substitutes: The market faces competition from other beverages, including herbal infusions, fruit juices, and soft drinks.
End-User Trends: Growing health consciousness, demand for natural and functional beverages, and increasing disposable incomes fuel market growth.
M&A Activities: The number of M&A deals in the organic tea industry has been steadily increasing over the past five years, averaging approximately xx deals annually. This reflects consolidation within the market and expansion strategies of larger players. Major players like Unilever are actively acquiring smaller organic tea brands to expand their product portfolios and market reach.
Organic Tea Industry Industry Trends & Analysis
The organic tea market is experiencing robust growth, driven by several key factors. The rising global demand for healthy and natural beverages is a major contributor. Consumers are increasingly aware of the health benefits associated with organic tea, including its antioxidant properties and potential health benefits, fueling market expansion. Technological advancements in tea processing and packaging are also enhancing product quality and shelf life.
The market is witnessing a shift towards convenient packaging formats such as tea bags and ready-to-drink options, catering to modern lifestyles. Competitive dynamics are shaped by innovation, branding, and distribution strategies. The industry also faces challenges such as fluctuations in raw material prices, supply chain disruptions and increased competition. The market penetration of organic tea is steadily increasing, with an estimated xx% of the total tea market currently representing organic tea consumption. This is forecasted to grow at a CAGR of xx% over the forecast period.
Leading Markets & Segments in Organic Tea Industry
Dominant Regions/Countries: North America and Europe currently dominate the organic tea market due to high consumer awareness, strong distribution networks, and established organic food cultures. However, Asia-Pacific is witnessing rapid growth, driven by increasing disposable incomes and rising demand for premium organic products.
Dominant Segments:
Type:
- Black Organic Tea: Remains a leading segment, driven by traditional consumption patterns and widespread availability.
- Green Organic Tea: Experiencing significant growth due to perceived health benefits and diverse flavor profiles.
Packaging Type:
- Teabags: Dominates due to convenience and ease of use.
- Cartons: Growing in popularity for its environmental friendliness and suitability for premium blends.
Distribution Channel:
- Supermarkets/Hypermarkets: Remain the primary distribution channel, offering wide reach and accessibility.
- Online Retail Stores: Witnessing rapid growth, offering convenience and direct-to-consumer access.
Key Drivers (by Region):
- North America: Strong consumer preference for healthy and natural products, well-established organic food retail infrastructure.
- Europe: High consumer awareness of organic certifications, strong regulatory frameworks.
- Asia-Pacific: Rising disposable incomes, increasing health consciousness, expanding retail infrastructure.
Organic Tea Industry Product Developments
The organic tea industry is witnessing significant innovation in product development, focusing on functional teas enriched with vitamins, minerals, or herbal extracts. There is a growing trend toward ready-to-drink organic iced teas and sparkling organic teas, catering to convenience-seeking consumers. Companies are also leveraging sustainable packaging materials such as biodegradable tea bags and recyclable cartons to appeal to environmentally conscious consumers. These developments offer companies the potential for improved market penetration and brand loyalty.
Key Drivers of Organic Tea Industry Growth
Several key factors drive the growth of the organic tea industry. Increasing health consciousness among consumers, the rise in demand for natural and healthy beverages, and the growing popularity of organic products worldwide are significant contributors. Furthermore, innovative packaging solutions and the expansion of e-commerce channels are also boosting market growth. Favorable government policies and regulations promoting organic agriculture also create a positive market environment.
Challenges in the Organic Tea Industry Market
The organic tea industry faces challenges such as fluctuations in raw material prices (e.g., tea leaves), supply chain disruptions (e.g., weather-related events), and intense competition from both established players and new entrants. Meeting stringent organic certification standards can also add to production costs and complicate the sourcing process. These factors collectively can impact profitability and market expansion. Furthermore, consumer preference shifting from traditional formats to new product offerings, such as ready-to-drink iced teas presents challenges to traditional producers.
Emerging Opportunities in Organic Tea Industry
Significant opportunities exist for growth in the organic tea industry. Technological advancements in tea processing, such as precision fermentation and innovative extraction methods, could significantly increase production efficiency and product quality. Strategic partnerships with retailers and distributors can enhance market reach. Expanding into new geographical markets, especially in developing economies with rising disposable incomes, presents substantial growth potential.
Leading Players in the Organic Tea Industry Sector
- Celestial Seasonings Inc.
- Harney & Sons Fine Teas
- Madura Tea Estates
- Unilever PLC
- Tata Global Beverages
- Equal Exchange Fairly Traded
- Numi Inc PBC
- Halssen & Lyon
- Shangri-la Tea
- Organic India
Key Milestones in Organic Tea Industry Industry
- September 2021: Launch of mymuse organic immunity-supporting enhanced waters and teas. This highlights the increasing demand for functional beverages within the organic tea sector.
- November 2022: 8th Wonder Tea launched its line of organic sparkling teas on Amazon. This demonstrates the growing importance of e-commerce in the organic beverage market and the trend towards innovative product formats.
- March 2023: Eat the Change expands its ready-to-drink organic iced tea line, Just Ice Tea. This underscores the growing popularity of ready-to-drink organic teas and the expansion of established brands into this segment.
Strategic Outlook for Organic Tea Industry Market
The organic tea market is poised for continued growth, driven by sustained consumer demand for healthy and convenient beverages. Strategic opportunities lie in product innovation, particularly functional and sustainably packaged teas, and expansion into new markets with untapped potential. Companies that effectively leverage technology to improve efficiency and embrace sustainable practices will be well-positioned for success in this increasingly competitive market. The long-term outlook remains positive, with significant growth potential across various segments and regions.
Organic Tea Industry Segmentation
-
1. Type
- 1.1. Black Organic Tea
- 1.2. Green Organic Tea
- 1.3. Oolong Organic Tea
- 1.4. Other Types
-
2. Packaging Type
- 2.1. Cartons
- 2.2. Teabags
- 2.3. Cans
- 2.4. Paper pouches
- 2.5. Other Packaging Types
-
3. Distribution Channel
- 3.1. Supermarkets/Hypermarkets
- 3.2. Convenience/Grocery Stores
- 3.3. Online Retail Stores
- 3.4. Other Distribution Channels
Organic Tea Industry Segmentation By Geography
-
1. North America
- 1.1. United States
- 1.2. Canada
- 1.3. Mexico
- 1.4. Rest of North America
-
2. Europe
- 2.1. United Kingdom
- 2.2. Spain
- 2.3. Germany
- 2.4. France
- 2.5. Italy
- 2.6. Russia
- 2.7. Rest of Europe
-
3. Asia Pacific
- 3.1. China
- 3.2. Japan
- 3.3. India
- 3.4. Australia
- 3.5. Rest of Asia Pacific
-
4. South America
- 4.1. Brazil
- 4.2. Argentina
- 4.3. Rest of South America
-
5. Middle East and Africa
- 5.1. South Africa
- 5.2. Saudi Arabia
- 5.3. Rest of Middle East and Africa
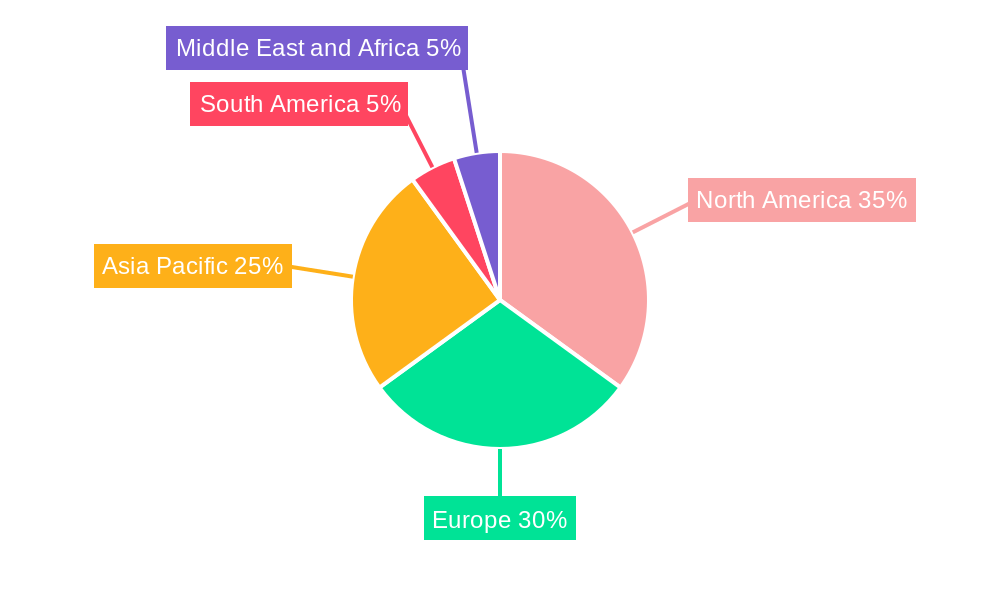
Organic Tea Industry Regional Market Share
Geographic Coverage of Organic Tea Industry
Organic Tea Industry REPORT HIGHLIGHTS
| Aspects | Details |
|---|---|
| Study Period | 2020-2034 |
| Base Year | 2025 |
| Estimated Year | 2026 |
| Forecast Period | 2026-2034 |
| Historical Period | 2020-2025 |
| Growth Rate | CAGR of 5.2% from 2020-2034 |
| Segmentation |
|
Table of Contents
- 1. Introduction
- 1.1. Research Scope
- 1.2. Market Segmentation
- 1.3. Research Objective
- 1.4. Definitions and Assumptions
- 2. Executive Summary
- 2.1. Market Snapshot
- 3. Market Dynamics
- 3.1. Market Drivers
- 3.2. Market Restrains
- 3.3. Market Trends
- 3.4. Market Opportunities
- 4. Market Factor Analysis
- 4.1. Porters Five Forces
- 4.1.1. Bargaining Power of Suppliers
- 4.1.2. Bargaining Power of Buyers
- 4.1.3. Threat of New Entrants
- 4.1.4. Threat of Substitutes
- 4.1.5. Competitive Rivalry
- 4.2. PESTEL analysis
- 4.3. BCG Analysis
- 4.3.1. Stars (High Growth, High Market Share)
- 4.3.2. Cash Cows (Low Growth, High Market Share)
- 4.3.3. Question Mark (High Growth, Low Market Share)
- 4.3.4. Dogs (Low Growth, Low Market Share)
- 4.4. Ansoff Matrix Analysis
- 4.5. Supply Chain Analysis
- 4.6. Regulatory Landscape
- 4.7. Current Market Potential and Opportunity Assessment (TAM–SAM–SOM Framework)
- 4.8. MDP Analyst Note
- 4.1. Porters Five Forces
- 5. Market Analysis, Insights and Forecast 2021-2033
- 5.1. Market Analysis, Insights and Forecast - by Type
- 5.1.1. Black Organic Tea
- 5.1.2. Green Organic Tea
- 5.1.3. Oolong Organic Tea
- 5.1.4. Other Types
- 5.2. Market Analysis, Insights and Forecast - by Packaging Type
- 5.2.1. Cartons
- 5.2.2. Teabags
- 5.2.3. Cans
- 5.2.4. Paper pouches
- 5.2.5. Other Packaging Types
- 5.3. Market Analysis, Insights and Forecast - by Distribution Channel
- 5.3.1. Supermarkets/Hypermarkets
- 5.3.2. Convenience/Grocery Stores
- 5.3.3. Online Retail Stores
- 5.3.4. Other Distribution Channels
- 5.4. Market Analysis, Insights and Forecast - by Region
- 5.4.1. North America
- 5.4.2. Europe
- 5.4.3. Asia Pacific
- 5.4.4. South America
- 5.4.5. Middle East and Africa
- 5.1. Market Analysis, Insights and Forecast - by Type
- 6. Global Organic Tea Industry Analysis, Insights and Forecast, 2021-2033
- 6.1. Market Analysis, Insights and Forecast - by Type
- 6.1.1. Black Organic Tea
- 6.1.2. Green Organic Tea
- 6.1.3. Oolong Organic Tea
- 6.1.4. Other Types
- 6.2. Market Analysis, Insights and Forecast - by Packaging Type
- 6.2.1. Cartons
- 6.2.2. Teabags
- 6.2.3. Cans
- 6.2.4. Paper pouches
- 6.2.5. Other Packaging Types
- 6.3. Market Analysis, Insights and Forecast - by Distribution Channel
- 6.3.1. Supermarkets/Hypermarkets
- 6.3.2. Convenience/Grocery Stores
- 6.3.3. Online Retail Stores
- 6.3.4. Other Distribution Channels
- 6.1. Market Analysis, Insights and Forecast - by Type
- 7. North America Organic Tea Industry Analysis, Insights and Forecast, 2020-2032
- 7.1. Market Analysis, Insights and Forecast - by Type
- 7.1.1. Black Organic Tea
- 7.1.2. Green Organic Tea
- 7.1.3. Oolong Organic Tea
- 7.1.4. Other Types
- 7.2. Market Analysis, Insights and Forecast - by Packaging Type
- 7.2.1. Cartons
- 7.2.2. Teabags
- 7.2.3. Cans
- 7.2.4. Paper pouches
- 7.2.5. Other Packaging Types
- 7.3. Market Analysis, Insights and Forecast - by Distribution Channel
- 7.3.1. Supermarkets/Hypermarkets
- 7.3.2. Convenience/Grocery Stores
- 7.3.3. Online Retail Stores
- 7.3.4. Other Distribution Channels
- 7.1. Market Analysis, Insights and Forecast - by Type
- 8. Europe Organic Tea Industry Analysis, Insights and Forecast, 2020-2032
- 8.1. Market Analysis, Insights and Forecast - by Type
- 8.1.1. Black Organic Tea
- 8.1.2. Green Organic Tea
- 8.1.3. Oolong Organic Tea
- 8.1.4. Other Types
- 8.2. Market Analysis, Insights and Forecast - by Packaging Type
- 8.2.1. Cartons
- 8.2.2. Teabags
- 8.2.3. Cans
- 8.2.4. Paper pouches
- 8.2.5. Other Packaging Types
- 8.3. Market Analysis, Insights and Forecast - by Distribution Channel
- 8.3.1. Supermarkets/Hypermarkets
- 8.3.2. Convenience/Grocery Stores
- 8.3.3. Online Retail Stores
- 8.3.4. Other Distribution Channels
- 8.1. Market Analysis, Insights and Forecast - by Type
- 9. Asia Pacific Organic Tea Industry Analysis, Insights and Forecast, 2020-2032
- 9.1. Market Analysis, Insights and Forecast - by Type
- 9.1.1. Black Organic Tea
- 9.1.2. Green Organic Tea
- 9.1.3. Oolong Organic Tea
- 9.1.4. Other Types
- 9.2. Market Analysis, Insights and Forecast - by Packaging Type
- 9.2.1. Cartons
- 9.2.2. Teabags
- 9.2.3. Cans
- 9.2.4. Paper pouches
- 9.2.5. Other Packaging Types
- 9.3. Market Analysis, Insights and Forecast - by Distribution Channel
- 9.3.1. Supermarkets/Hypermarkets
- 9.3.2. Convenience/Grocery Stores
- 9.3.3. Online Retail Stores
- 9.3.4. Other Distribution Channels
- 9.1. Market Analysis, Insights and Forecast - by Type
- 10. South America Organic Tea Industry Analysis, Insights and Forecast, 2020-2032
- 10.1. Market Analysis, Insights and Forecast - by Type
- 10.1.1. Black Organic Tea
- 10.1.2. Green Organic Tea
- 10.1.3. Oolong Organic Tea
- 10.1.4. Other Types
- 10.2. Market Analysis, Insights and Forecast - by Packaging Type
- 10.2.1. Cartons
- 10.2.2. Teabags
- 10.2.3. Cans
- 10.2.4. Paper pouches
- 10.2.5. Other Packaging Types
- 10.3. Market Analysis, Insights and Forecast - by Distribution Channel
- 10.3.1. Supermarkets/Hypermarkets
- 10.3.2. Convenience/Grocery Stores
- 10.3.3. Online Retail Stores
- 10.3.4. Other Distribution Channels
- 10.1. Market Analysis, Insights and Forecast - by Type
- 11. Middle East and Africa Organic Tea Industry Analysis, Insights and Forecast, 2020-2032
- 11.1. Market Analysis, Insights and Forecast - by Type
- 11.1.1. Black Organic Tea
- 11.1.2. Green Organic Tea
- 11.1.3. Oolong Organic Tea
- 11.1.4. Other Types
- 11.2. Market Analysis, Insights and Forecast - by Packaging Type
- 11.2.1. Cartons
- 11.2.2. Teabags
- 11.2.3. Cans
- 11.2.4. Paper pouches
- 11.2.5. Other Packaging Types
- 11.3. Market Analysis, Insights and Forecast - by Distribution Channel
- 11.3.1. Supermarkets/Hypermarkets
- 11.3.2. Convenience/Grocery Stores
- 11.3.3. Online Retail Stores
- 11.3.4. Other Distribution Channels
- 11.1. Market Analysis, Insights and Forecast - by Type
- 12. Competitive Analysis
- 12.1. Company Profiles
- 12.1.1 Celestial Seasonings Inc.
- 12.1.1.1. Company Overview
- 12.1.1.2. Products
- 12.1.1.3. Company Financials
- 12.1.1.4. SWOT Analysis
- 12.1.2 Harney & Sons Fine Teas
- 12.1.2.1. Company Overview
- 12.1.2.2. Products
- 12.1.2.3. Company Financials
- 12.1.2.4. SWOT Analysis
- 12.1.3 Madura Tea Estates
- 12.1.3.1. Company Overview
- 12.1.3.2. Products
- 12.1.3.3. Company Financials
- 12.1.3.4. SWOT Analysis
- 12.1.4 Unilever PLC
- 12.1.4.1. Company Overview
- 12.1.4.2. Products
- 12.1.4.3. Company Financials
- 12.1.4.4. SWOT Analysis
- 12.1.5 Tata Global Beverages
- 12.1.5.1. Company Overview
- 12.1.5.2. Products
- 12.1.5.3. Company Financials
- 12.1.5.4. SWOT Analysis
- 12.1.6 Equal Exchange Fairly Traded
- 12.1.6.1. Company Overview
- 12.1.6.2. Products
- 12.1.6.3. Company Financials
- 12.1.6.4. SWOT Analysis
- 12.1.7 Numi Inc PBC
- 12.1.7.1. Company Overview
- 12.1.7.2. Products
- 12.1.7.3. Company Financials
- 12.1.7.4. SWOT Analysis
- 12.1.8 Halssen & Lyon
- 12.1.8.1. Company Overview
- 12.1.8.2. Products
- 12.1.8.3. Company Financials
- 12.1.8.4. SWOT Analysis
- 12.1.9 Shangri-la Tea
- 12.1.9.1. Company Overview
- 12.1.9.2. Products
- 12.1.9.3. Company Financials
- 12.1.9.4. SWOT Analysis
- 12.1.10 Organic India
- 12.1.10.1. Company Overview
- 12.1.10.2. Products
- 12.1.10.3. Company Financials
- 12.1.10.4. SWOT Analysis
- 12.1.1 Celestial Seasonings Inc.
- 12.2. Market Entropy
- 12.2.1 Company's Key Areas Served
- 12.2.2 Recent Developments
- 12.3. Company Market Share Analysis 2025
- 12.3.1 Top 5 Companies Market Share Analysis
- 12.3.2 Top 3 Companies Market Share Analysis
- 12.4. List of Potential Customers
- 13. Research Methodology
List of Figures
- Figure 1: Global Organic Tea Industry Revenue Breakdown (million, %) by Region 2025 & 2033
- Figure 2: Global Organic Tea Industry Volume Breakdown (K Tons, %) by Region 2025 & 2033
- Figure 3: North America Organic Tea Industry Revenue (million), by Type 2025 & 2033
- Figure 4: North America Organic Tea Industry Volume (K Tons), by Type 2025 & 2033
- Figure 5: North America Organic Tea Industry Revenue Share (%), by Type 2025 & 2033
- Figure 6: North America Organic Tea Industry Volume Share (%), by Type 2025 & 2033
- Figure 7: North America Organic Tea Industry Revenue (million), by Packaging Type 2025 & 2033
- Figure 8: North America Organic Tea Industry Volume (K Tons), by Packaging Type 2025 & 2033
- Figure 9: North America Organic Tea Industry Revenue Share (%), by Packaging Type 2025 & 2033
- Figure 10: North America Organic Tea Industry Volume Share (%), by Packaging Type 2025 & 2033
- Figure 11: North America Organic Tea Industry Revenue (million), by Distribution Channel 2025 & 2033
- Figure 12: North America Organic Tea Industry Volume (K Tons), by Distribution Channel 2025 & 2033
- Figure 13: North America Organic Tea Industry Revenue Share (%), by Distribution Channel 2025 & 2033
- Figure 14: North America Organic Tea Industry Volume Share (%), by Distribution Channel 2025 & 2033
- Figure 15: North America Organic Tea Industry Revenue (million), by Country 2025 & 2033
- Figure 16: North America Organic Tea Industry Volume (K Tons), by Country 2025 & 2033
- Figure 17: North America Organic Tea Industry Revenue Share (%), by Country 2025 & 2033
- Figure 18: North America Organic Tea Industry Volume Share (%), by Country 2025 & 2033
- Figure 19: Europe Organic Tea Industry Revenue (million), by Type 2025 & 2033
- Figure 20: Europe Organic Tea Industry Volume (K Tons), by Type 2025 & 2033
- Figure 21: Europe Organic Tea Industry Revenue Share (%), by Type 2025 & 2033
- Figure 22: Europe Organic Tea Industry Volume Share (%), by Type 2025 & 2033
- Figure 23: Europe Organic Tea Industry Revenue (million), by Packaging Type 2025 & 2033
- Figure 24: Europe Organic Tea Industry Volume (K Tons), by Packaging Type 2025 & 2033
- Figure 25: Europe Organic Tea Industry Revenue Share (%), by Packaging Type 2025 & 2033
- Figure 26: Europe Organic Tea Industry Volume Share (%), by Packaging Type 2025 & 2033
- Figure 27: Europe Organic Tea Industry Revenue (million), by Distribution Channel 2025 & 2033
- Figure 28: Europe Organic Tea Industry Volume (K Tons), by Distribution Channel 2025 & 2033
- Figure 29: Europe Organic Tea Industry Revenue Share (%), by Distribution Channel 2025 & 2033
- Figure 30: Europe Organic Tea Industry Volume Share (%), by Distribution Channel 2025 & 2033
- Figure 31: Europe Organic Tea Industry Revenue (million), by Country 2025 & 2033
- Figure 32: Europe Organic Tea Industry Volume (K Tons), by Country 2025 & 2033
- Figure 33: Europe Organic Tea Industry Revenue Share (%), by Country 2025 & 2033
- Figure 34: Europe Organic Tea Industry Volume Share (%), by Country 2025 & 2033
- Figure 35: Asia Pacific Organic Tea Industry Revenue (million), by Type 2025 & 2033
- Figure 36: Asia Pacific Organic Tea Industry Volume (K Tons), by Type 2025 & 2033
- Figure 37: Asia Pacific Organic Tea Industry Revenue Share (%), by Type 2025 & 2033
- Figure 38: Asia Pacific Organic Tea Industry Volume Share (%), by Type 2025 & 2033
- Figure 39: Asia Pacific Organic Tea Industry Revenue (million), by Packaging Type 2025 & 2033
- Figure 40: Asia Pacific Organic Tea Industry Volume (K Tons), by Packaging Type 2025 & 2033
- Figure 41: Asia Pacific Organic Tea Industry Revenue Share (%), by Packaging Type 2025 & 2033
- Figure 42: Asia Pacific Organic Tea Industry Volume Share (%), by Packaging Type 2025 & 2033
- Figure 43: Asia Pacific Organic Tea Industry Revenue (million), by Distribution Channel 2025 & 2033
- Figure 44: Asia Pacific Organic Tea Industry Volume (K Tons), by Distribution Channel 2025 & 2033
- Figure 45: Asia Pacific Organic Tea Industry Revenue Share (%), by Distribution Channel 2025 & 2033
- Figure 46: Asia Pacific Organic Tea Industry Volume Share (%), by Distribution Channel 2025 & 2033
- Figure 47: Asia Pacific Organic Tea Industry Revenue (million), by Country 2025 & 2033
- Figure 48: Asia Pacific Organic Tea Industry Volume (K Tons), by Country 2025 & 2033
- Figure 49: Asia Pacific Organic Tea Industry Revenue Share (%), by Country 2025 & 2033
- Figure 50: Asia Pacific Organic Tea Industry Volume Share (%), by Country 2025 & 2033
- Figure 51: South America Organic Tea Industry Revenue (million), by Type 2025 & 2033
- Figure 52: South America Organic Tea Industry Volume (K Tons), by Type 2025 & 2033
- Figure 53: South America Organic Tea Industry Revenue Share (%), by Type 2025 & 2033
- Figure 54: South America Organic Tea Industry Volume Share (%), by Type 2025 & 2033
- Figure 55: South America Organic Tea Industry Revenue (million), by Packaging Type 2025 & 2033
- Figure 56: South America Organic Tea Industry Volume (K Tons), by Packaging Type 2025 & 2033
- Figure 57: South America Organic Tea Industry Revenue Share (%), by Packaging Type 2025 & 2033
- Figure 58: South America Organic Tea Industry Volume Share (%), by Packaging Type 2025 & 2033
- Figure 59: South America Organic Tea Industry Revenue (million), by Distribution Channel 2025 & 2033
- Figure 60: South America Organic Tea Industry Volume (K Tons), by Distribution Channel 2025 & 2033
- Figure 61: South America Organic Tea Industry Revenue Share (%), by Distribution Channel 2025 & 2033
- Figure 62: South America Organic Tea Industry Volume Share (%), by Distribution Channel 2025 & 2033
- Figure 63: South America Organic Tea Industry Revenue (million), by Country 2025 & 2033
- Figure 64: South America Organic Tea Industry Volume (K Tons), by Country 2025 & 2033
- Figure 65: South America Organic Tea Industry Revenue Share (%), by Country 2025 & 2033
- Figure 66: South America Organic Tea Industry Volume Share (%), by Country 2025 & 2033
- Figure 67: Middle East and Africa Organic Tea Industry Revenue (million), by Type 2025 & 2033
- Figure 68: Middle East and Africa Organic Tea Industry Volume (K Tons), by Type 2025 & 2033
- Figure 69: Middle East and Africa Organic Tea Industry Revenue Share (%), by Type 2025 & 2033
- Figure 70: Middle East and Africa Organic Tea Industry Volume Share (%), by Type 2025 & 2033
- Figure 71: Middle East and Africa Organic Tea Industry Revenue (million), by Packaging Type 2025 & 2033
- Figure 72: Middle East and Africa Organic Tea Industry Volume (K Tons), by Packaging Type 2025 & 2033
- Figure 73: Middle East and Africa Organic Tea Industry Revenue Share (%), by Packaging Type 2025 & 2033
- Figure 74: Middle East and Africa Organic Tea Industry Volume Share (%), by Packaging Type 2025 & 2033
- Figure 75: Middle East and Africa Organic Tea Industry Revenue (million), by Distribution Channel 2025 & 2033
- Figure 76: Middle East and Africa Organic Tea Industry Volume (K Tons), by Distribution Channel 2025 & 2033
- Figure 77: Middle East and Africa Organic Tea Industry Revenue Share (%), by Distribution Channel 2025 & 2033
- Figure 78: Middle East and Africa Organic Tea Industry Volume Share (%), by Distribution Channel 2025 & 2033
- Figure 79: Middle East and Africa Organic Tea Industry Revenue (million), by Country 2025 & 2033
- Figure 80: Middle East and Africa Organic Tea Industry Volume (K Tons), by Country 2025 & 2033
- Figure 81: Middle East and Africa Organic Tea Industry Revenue Share (%), by Country 2025 & 2033
- Figure 82: Middle East and Africa Organic Tea Industry Volume Share (%), by Country 2025 & 2033
List of Tables
- Table 1: Global Organic Tea Industry Revenue million Forecast, by Type 2020 & 2033
- Table 2: Global Organic Tea Industry Volume K Tons Forecast, by Type 2020 & 2033
- Table 3: Global Organic Tea Industry Revenue million Forecast, by Packaging Type 2020 & 2033
- Table 4: Global Organic Tea Industry Volume K Tons Forecast, by Packaging Type 2020 & 2033
- Table 5: Global Organic Tea Industry Revenue million Forecast, by Distribution Channel 2020 & 2033
- Table 6: Global Organic Tea Industry Volume K Tons Forecast, by Distribution Channel 2020 & 2033
- Table 7: Global Organic Tea Industry Revenue million Forecast, by Region 2020 & 2033
- Table 8: Global Organic Tea Industry Volume K Tons Forecast, by Region 2020 & 2033
- Table 9: Global Organic Tea Industry Revenue million Forecast, by Type 2020 & 2033
- Table 10: Global Organic Tea Industry Volume K Tons Forecast, by Type 2020 & 2033
- Table 11: Global Organic Tea Industry Revenue million Forecast, by Packaging Type 2020 & 2033
- Table 12: Global Organic Tea Industry Volume K Tons Forecast, by Packaging Type 2020 & 2033
- Table 13: Global Organic Tea Industry Revenue million Forecast, by Distribution Channel 2020 & 2033
- Table 14: Global Organic Tea Industry Volume K Tons Forecast, by Distribution Channel 2020 & 2033
- Table 15: Global Organic Tea Industry Revenue million Forecast, by Country 2020 & 2033
- Table 16: Global Organic Tea Industry Volume K Tons Forecast, by Country 2020 & 2033
- Table 17: United States Organic Tea Industry Revenue (million) Forecast, by Application 2020 & 2033
- Table 18: United States Organic Tea Industry Volume (K Tons) Forecast, by Application 2020 & 2033
- Table 19: Canada Organic Tea Industry Revenue (million) Forecast, by Application 2020 & 2033
- Table 20: Canada Organic Tea Industry Volume (K Tons) Forecast, by Application 2020 & 2033
- Table 21: Mexico Organic Tea Industry Revenue (million) Forecast, by Application 2020 & 2033
- Table 22: Mexico Organic Tea Industry Volume (K Tons) Forecast, by Application 2020 & 2033
- Table 23: Rest of North America Organic Tea Industry Revenue (million) Forecast, by Application 2020 & 2033
- Table 24: Rest of North America Organic Tea Industry Volume (K Tons) Forecast, by Application 2020 & 2033
- Table 25: Global Organic Tea Industry Revenue million Forecast, by Type 2020 & 2033
- Table 26: Global Organic Tea Industry Volume K Tons Forecast, by Type 2020 & 2033
- Table 27: Global Organic Tea Industry Revenue million Forecast, by Packaging Type 2020 & 2033
- Table 28: Global Organic Tea Industry Volume K Tons Forecast, by Packaging Type 2020 & 2033
- Table 29: Global Organic Tea Industry Revenue million Forecast, by Distribution Channel 2020 & 2033
- Table 30: Global Organic Tea Industry Volume K Tons Forecast, by Distribution Channel 2020 & 2033
- Table 31: Global Organic Tea Industry Revenue million Forecast, by Country 2020 & 2033
- Table 32: Global Organic Tea Industry Volume K Tons Forecast, by Country 2020 & 2033
- Table 33: United Kingdom Organic Tea Industry Revenue (million) Forecast, by Application 2020 & 2033
- Table 34: United Kingdom Organic Tea Industry Volume (K Tons) Forecast, by Application 2020 & 2033
- Table 35: Spain Organic Tea Industry Revenue (million) Forecast, by Application 2020 & 2033
- Table 36: Spain Organic Tea Industry Volume (K Tons) Forecast, by Application 2020 & 2033
- Table 37: Germany Organic Tea Industry Revenue (million) Forecast, by Application 2020 & 2033
- Table 38: Germany Organic Tea Industry Volume (K Tons) Forecast, by Application 2020 & 2033
- Table 39: France Organic Tea Industry Revenue (million) Forecast, by Application 2020 & 2033
- Table 40: France Organic Tea Industry Volume (K Tons) Forecast, by Application 2020 & 2033
- Table 41: Italy Organic Tea Industry Revenue (million) Forecast, by Application 2020 & 2033
- Table 42: Italy Organic Tea Industry Volume (K Tons) Forecast, by Application 2020 & 2033
- Table 43: Russia Organic Tea Industry Revenue (million) Forecast, by Application 2020 & 2033
- Table 44: Russia Organic Tea Industry Volume (K Tons) Forecast, by Application 2020 & 2033
- Table 45: Rest of Europe Organic Tea Industry Revenue (million) Forecast, by Application 2020 & 2033
- Table 46: Rest of Europe Organic Tea Industry Volume (K Tons) Forecast, by Application 2020 & 2033
- Table 47: Global Organic Tea Industry Revenue million Forecast, by Type 2020 & 2033
- Table 48: Global Organic Tea Industry Volume K Tons Forecast, by Type 2020 & 2033
- Table 49: Global Organic Tea Industry Revenue million Forecast, by Packaging Type 2020 & 2033
- Table 50: Global Organic Tea Industry Volume K Tons Forecast, by Packaging Type 2020 & 2033
- Table 51: Global Organic Tea Industry Revenue million Forecast, by Distribution Channel 2020 & 2033
- Table 52: Global Organic Tea Industry Volume K Tons Forecast, by Distribution Channel 2020 & 2033
- Table 53: Global Organic Tea Industry Revenue million Forecast, by Country 2020 & 2033
- Table 54: Global Organic Tea Industry Volume K Tons Forecast, by Country 2020 & 2033
- Table 55: China Organic Tea Industry Revenue (million) Forecast, by Application 2020 & 2033
- Table 56: China Organic Tea Industry Volume (K Tons) Forecast, by Application 2020 & 2033
- Table 57: Japan Organic Tea Industry Revenue (million) Forecast, by Application 2020 & 2033
- Table 58: Japan Organic Tea Industry Volume (K Tons) Forecast, by Application 2020 & 2033
- Table 59: India Organic Tea Industry Revenue (million) Forecast, by Application 2020 & 2033
- Table 60: India Organic Tea Industry Volume (K Tons) Forecast, by Application 2020 & 2033
- Table 61: Australia Organic Tea Industry Revenue (million) Forecast, by Application 2020 & 2033
- Table 62: Australia Organic Tea Industry Volume (K Tons) Forecast, by Application 2020 & 2033
- Table 63: Rest of Asia Pacific Organic Tea Industry Revenue (million) Forecast, by Application 2020 & 2033
- Table 64: Rest of Asia Pacific Organic Tea Industry Volume (K Tons) Forecast, by Application 2020 & 2033
- Table 65: Global Organic Tea Industry Revenue million Forecast, by Type 2020 & 2033
- Table 66: Global Organic Tea Industry Volume K Tons Forecast, by Type 2020 & 2033
- Table 67: Global Organic Tea Industry Revenue million Forecast, by Packaging Type 2020 & 2033
- Table 68: Global Organic Tea Industry Volume K Tons Forecast, by Packaging Type 2020 & 2033
- Table 69: Global Organic Tea Industry Revenue million Forecast, by Distribution Channel 2020 & 2033
- Table 70: Global Organic Tea Industry Volume K Tons Forecast, by Distribution Channel 2020 & 2033
- Table 71: Global Organic Tea Industry Revenue million Forecast, by Country 2020 & 2033
- Table 72: Global Organic Tea Industry Volume K Tons Forecast, by Country 2020 & 2033
- Table 73: Brazil Organic Tea Industry Revenue (million) Forecast, by Application 2020 & 2033
- Table 74: Brazil Organic Tea Industry Volume (K Tons) Forecast, by Application 2020 & 2033
- Table 75: Argentina Organic Tea Industry Revenue (million) Forecast, by Application 2020 & 2033
- Table 76: Argentina Organic Tea Industry Volume (K Tons) Forecast, by Application 2020 & 2033
- Table 77: Rest of South America Organic Tea Industry Revenue (million) Forecast, by Application 2020 & 2033
- Table 78: Rest of South America Organic Tea Industry Volume (K Tons) Forecast, by Application 2020 & 2033
- Table 79: Global Organic Tea Industry Revenue million Forecast, by Type 2020 & 2033
- Table 80: Global Organic Tea Industry Volume K Tons Forecast, by Type 2020 & 2033
- Table 81: Global Organic Tea Industry Revenue million Forecast, by Packaging Type 2020 & 2033
- Table 82: Global Organic Tea Industry Volume K Tons Forecast, by Packaging Type 2020 & 2033
- Table 83: Global Organic Tea Industry Revenue million Forecast, by Distribution Channel 2020 & 2033
- Table 84: Global Organic Tea Industry Volume K Tons Forecast, by Distribution Channel 2020 & 2033
- Table 85: Global Organic Tea Industry Revenue million Forecast, by Country 2020 & 2033
- Table 86: Global Organic Tea Industry Volume K Tons Forecast, by Country 2020 & 2033
- Table 87: South Africa Organic Tea Industry Revenue (million) Forecast, by Application 2020 & 2033
- Table 88: South Africa Organic Tea Industry Volume (K Tons) Forecast, by Application 2020 & 2033
- Table 89: Saudi Arabia Organic Tea Industry Revenue (million) Forecast, by Application 2020 & 2033
- Table 90: Saudi Arabia Organic Tea Industry Volume (K Tons) Forecast, by Application 2020 & 2033
- Table 91: Rest of Middle East and Africa Organic Tea Industry Revenue (million) Forecast, by Application 2020 & 2033
- Table 92: Rest of Middle East and Africa Organic Tea Industry Volume (K Tons) Forecast, by Application 2020 & 2033
Frequently Asked Questions
1. What is the projected Compound Annual Growth Rate (CAGR) of the Organic Tea Industry?
The projected CAGR is approximately 5.2%.
2. Which companies are prominent players in the Organic Tea Industry?
Key companies in the market include Celestial Seasonings Inc., Harney & Sons Fine Teas, Madura Tea Estates, Unilever PLC, Tata Global Beverages, Equal Exchange Fairly Traded, Numi Inc PBC, Halssen & Lyon, Shangri-la Tea, Organic India.
3. What are the main segments of the Organic Tea Industry?
The market segments include Type, Packaging Type, Distribution Channel.
4. Can you provide details about the market size?
The market size is estimated to be USD 93.9 million as of 2022.
5. What are some drivers contributing to market growth?
Increasing Demand for Herbal Teas; Increasing Consumer Awareness about Health Benefits of Tea.
6. What are the notable trends driving market growth?
Consumer Inclination Towards Healthy Beverages.
7. Are there any restraints impacting market growth?
High Cost of Production of Green Tea.
8. Can you provide examples of recent developments in the market?
March 2023: Eat the Change, a snack company, launched an extension of its ready-to-drink organic iced tea line, Just Ice Tea, in three new varieties: Mango White Tea, Original Black Tea, and Lemon Ginger Herbal Tea.
9. What pricing options are available for accessing the report?
Pricing options include single-user, multi-user, and enterprise licenses priced at USD 4750, USD 5250, and USD 8750 respectively.
10. Is the market size provided in terms of value or volume?
The market size is provided in terms of value, measured in million and volume, measured in K Tons.
11. Are there any specific market keywords associated with the report?
Yes, the market keyword associated with the report is "Organic Tea Industry," which aids in identifying and referencing the specific market segment covered.
12. How do I determine which pricing option suits my needs best?
The pricing options vary based on user requirements and access needs. Individual users may opt for single-user licenses, while businesses requiring broader access may choose multi-user or enterprise licenses for cost-effective access to the report.
13. Are there any additional resources or data provided in the Organic Tea Industry report?
While the report offers comprehensive insights, it's advisable to review the specific contents or supplementary materials provided to ascertain if additional resources or data are available.
14. How can I stay updated on further developments or reports in the Organic Tea Industry?
To stay informed about further developments, trends, and reports in the Organic Tea Industry, consider subscribing to industry newsletters, following relevant companies and organizations, or regularly checking reputable industry news sources and publications.
Methodology
Step 1 - Identification of Relevant Samples Size from Population Database


Step 2 - Approaches for Defining Global Market Size (Value, Volume* & Price*)

Note*: In applicable scenarios
Step 3 - Data Sources
Primary Research
- Web Analytics
- Survey Reports
- Research Institute
- Latest Research Reports
- Opinion Leaders
Secondary Research
- Annual Reports
- White Paper
- Latest Press Release
- Industry Association
- Paid Database
- Investor Presentations

Step 4 - Data Triangulation
Involves using different sources of information in order to increase the validity of a study
These sources are likely to be stakeholders in a program - participants, other researchers, program staff, other community members, and so on.
Then we put all data in single framework & apply various statistical tools to find out the dynamic on the market.
During the analysis stage, feedback from the stakeholder groups would be compared to determine areas of agreement as well as areas of divergence