

Key Insights
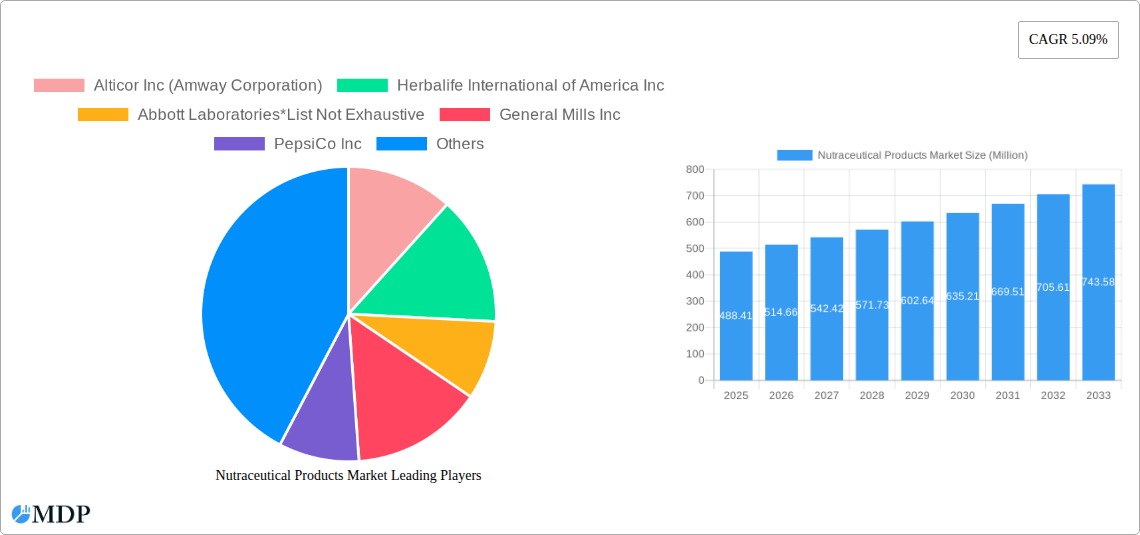
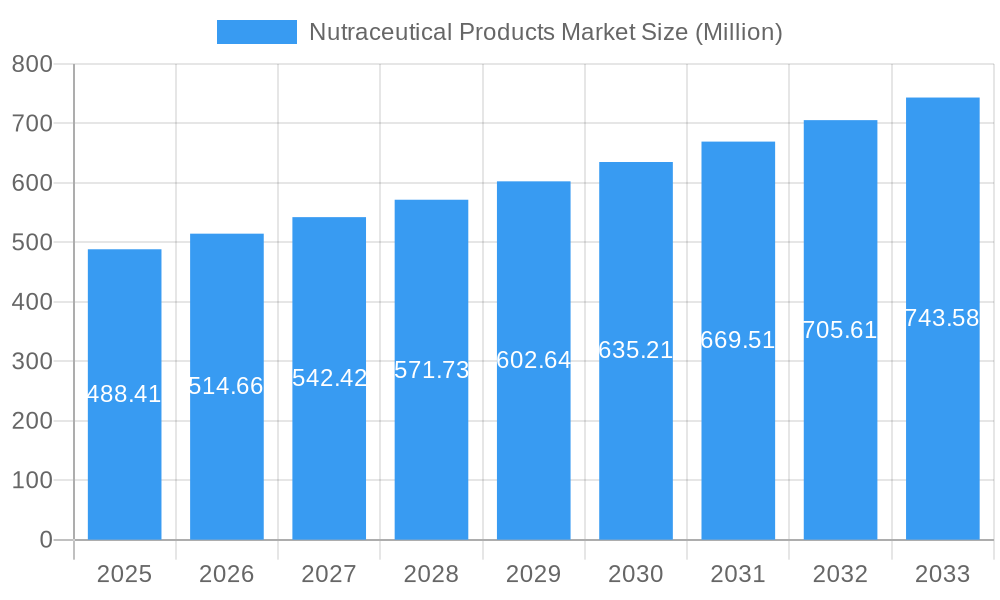
The global nutraceutical products market, valued at $488.41 million in 2025, is projected to experience robust growth, driven by a compound annual growth rate (CAGR) of 5.09% from 2025 to 2033. This expansion is fueled by several key factors. Increasing consumer awareness of preventative healthcare and the benefits of functional foods and supplements contributes significantly to market growth. The rising prevalence of chronic diseases, coupled with a growing preference for natural and holistic health solutions, further propels demand. Furthermore, the expanding distribution channels, including online retail and specialty stores, provide wider access to these products, facilitating market penetration. The market is segmented by product type (functional foods, functional beverages, dietary supplements) and distribution channel (specialty stores, supermarkets/hypermarkets, convenience stores, drug stores/pharmacies, online retail stores). The diverse product portfolio caters to various consumer needs and preferences, enhancing market breadth. Major players like Alticor Inc., Herbalife International, Abbott Laboratories, General Mills, PepsiCo, and Nestlé are actively shaping market dynamics through innovation and strategic expansion. Geographic growth is expected across regions, with North America, Europe, and Asia Pacific representing significant market shares, reflecting diverse health-conscious consumer bases and varying levels of disposable income.
Nutraceutical Products Market Market Size (In Million)
The competitive landscape is characterized by both established multinational corporations and smaller, specialized companies. The market’s future trajectory is influenced by several trends, including the increasing focus on personalized nutrition, growing demand for organic and sustainable products, and the integration of technology in product development and marketing. However, challenges such as stringent regulatory environments and concerns about product efficacy and safety must be addressed for sustained growth. The market's potential for expansion is considerable, given the evolving consumer landscape and continuous advancements in nutraceutical research and development. Strategic partnerships, product diversification, and targeted marketing initiatives will be crucial for success in this dynamic market.
Nutraceutical Products Market Company Market Share
Nutraceutical Products Market: A Comprehensive Report (2019-2033)
This comprehensive report provides a detailed analysis of the Nutraceutical Products Market, encompassing market dynamics, industry trends, leading segments, key players, and future outlook. With a study period spanning 2019-2033, a base year of 2025, and a forecast period of 2025-2033, this report is an invaluable resource for industry stakeholders, investors, and strategic decision-makers. The market is projected to reach xx Million by 2033, exhibiting a CAGR of xx% during the forecast period.
Nutraceutical Products Market Market Dynamics & Concentration
The Nutraceutical Products Market exhibits a moderately concentrated landscape, with several major players holding significant market share. Key drivers include increasing consumer health consciousness, rising disposable incomes, and growing awareness of preventive healthcare. Regulatory frameworks, while varying across regions, play a critical role in shaping market dynamics, influencing product development and marketing claims. The market faces competition from traditional food and beverage products, as well as alternative medicine approaches. Mergers and acquisitions (M&A) activity is prevalent, with larger companies seeking to consolidate their market position and expand their product portfolios.
- Market Concentration: The top 5 players account for approximately xx% of the global market share in 2025.
- Innovation Drivers: Growing demand for personalized nutrition, functional foods, and supplements with scientifically-backed benefits.
- Regulatory Frameworks: Varying regulations across countries concerning labeling, claims, and safety standards influence market access and product development.
- Product Substitutes: Traditional foods, dietary supplements, and alternative healthcare practices pose competitive challenges.
- End-User Trends: Increased focus on preventative healthcare, personalized nutrition, and convenience drives demand for functional foods and beverages.
- M&A Activity: The number of M&A deals in the sector averaged xx per year during the historical period (2019-2024).
Nutraceutical Products Market Industry Trends & Analysis
The Nutraceutical Products Market is experiencing robust growth, propelled by several factors. The increasing prevalence of chronic diseases, coupled with a growing preference for natural and functional foods, is driving demand. Technological advancements in product formulation, delivery systems, and personalized nutrition are further fueling market expansion. Consumer preferences are shifting towards clean-label products, with a focus on natural ingredients and minimal processing. Competitive dynamics are characterized by product innovation, brand building, and strategic partnerships, with established players facing increasing competition from smaller, specialized brands. Market penetration of functional foods and beverages is growing steadily, particularly in developed economies.
Leading Markets & Segments in Nutraceutical Products Market
The North American region currently dominates the Nutraceutical Products Market, followed by Europe and Asia-Pacific. Within product types, dietary supplements hold the largest market share, driven by their convenience and targeted benefits. Functional foods and beverages are experiencing strong growth, particularly functional beverages. Distribution channels are diversifying, with online retail experiencing significant expansion. Supermarkets/hypermarkets remain the dominant distribution channel, however.
- Key Drivers in Dominant Regions:
- North America: High health awareness, robust healthcare infrastructure, and significant disposable incomes.
- Europe: Growing demand for personalized nutrition and increasing adoption of functional foods and beverages.
- Asia-Pacific: Rapid economic growth, rising health consciousness, and increasing adoption of Western dietary habits.
- Dominant Segments: Dietary supplements segment leads in terms of market value driven by the increasing demand for products focused on specific health benefits and a rising aging population. The Functional beverages segment exhibits higher growth rate due to rising demand for healthy convenient beverages.
- Distribution Channel Analysis: Supermarkets and hypermarkets maintain the highest market share due to their wide reach, convenience and affordability. However, online retail is growing rapidly, driven by increased internet penetration and convenience.
Nutraceutical Products Market Product Developments
Recent product developments highlight trends toward personalized nutrition, clean-label formulations, and innovative delivery systems. Companies are focusing on incorporating functional ingredients with scientifically-proven benefits, such as probiotics, antioxidants, and adaptogens. This includes advancements in encapsulation technologies and the development of convenient formats such as snack bars and ready-to-drink beverages. The market is witnessing increased offerings of plant-based and organic products catering to consumer preferences for natural and sustainable options.
Key Drivers of Nutraceutical Products Market Growth
Several factors are driving the growth of the Nutraceutical Products Market. The rising prevalence of chronic diseases like obesity, diabetes, and cardiovascular disease is creating significant demand for products that promote health and well-being. Advances in research and technology are enabling the development of more effective and targeted nutraceutical products. Furthermore, increasing health awareness among consumers and a preference for preventive healthcare further fuel market expansion. Favorable government regulations and increased investment in the sector also contribute to growth.
Challenges in the Nutraceutical Products Market Market
The Nutraceutical Products Market faces several challenges, including stringent regulatory frameworks that impact product approvals and marketing claims, concerns about product safety and efficacy, and fluctuating raw material prices impacting profitability. Competition from established players and new entrants is intense, leading to price pressure. Furthermore, consumer trust in the authenticity and quality of products, especially given concerns about counterfeiting, remains a key challenge. These factors collectively pose significant hurdles to market expansion.
Emerging Opportunities in Nutraceutical Products Market
The future of the Nutraceutical Products Market looks promising, with significant opportunities for growth. The integration of personalized nutrition approaches, leveraging advancements in genomics and nutrigenomics, holds immense potential. Strategic partnerships between nutraceutical companies and healthcare providers can facilitate product integration into personalized care plans. Expanding into emerging markets with rising health awareness and disposable incomes presents further growth opportunities. The development of novel delivery systems and innovative product formats will further drive market expansion.
Leading Players in the Nutraceutical Products Market Sector
Key Milestones in Nutraceutical Products Market Industry
- June 2022: Kellogg's Special K launched new protein snack bars, signifying the increasing focus on convenient, protein-rich options within the functional foods category.
- February 2022: PepsiCo's Rockstar Energy launched a hemp-infused drink, indicating the growing interest in functional beverages with novel ingredients and health benefits.
- April 2021: Nestlé NIDO 3+ introduced an improved formula tailored to the nutritional needs of young children, highlighting the emphasis on products addressing specific age group deficiencies.
Strategic Outlook for Nutraceutical Products Market Market
The Nutraceutical Products Market is poised for continued growth, driven by evolving consumer preferences, technological advancements, and favorable regulatory landscapes. Strategic opportunities lie in developing personalized nutrition solutions, leveraging data analytics to understand consumer needs, and creating innovative product offerings that meet evolving demands for health and wellness. Focusing on sustainability and ethical sourcing of ingredients will be crucial for long-term market success. Companies should invest in research and development to create effective products with clear evidence of efficacy and safety.
Nutraceutical Products Market Segmentation
-
1. Product Type
-
1.1. Functional Food
- 1.1.1. Cereal
- 1.1.2. Bakery and Confectionary
- 1.1.3. Dairy
- 1.1.4. Snack
- 1.1.5. Other Functional Foods
-
1.2. Functional Beverage
- 1.2.1. Energy Drink
- 1.2.2. Sports Drink
- 1.2.3. Fortified Juice
- 1.2.4. Dairy and Dairy Alternative Beverage
- 1.2.5. Other Functional Beverages
-
1.3. Dietary Supplements
- 1.3.1. Vitamins
- 1.3.2. Minerals
- 1.3.3. Botanicals
- 1.3.4. Enzyme
- 1.3.5. Fatty Acids
- 1.3.6. Proteins
- 1.3.7. Other Dietary Supplements
-
1.1. Functional Food
-
2. Distribution Channel
- 2.1. Specialty Stores
- 2.2. Supermarkets/Hypermarkets
- 2.3. Convenience Stores
- 2.4. Drug Stores/Pharmacies
- 2.5. Online Retail Stores
- 2.6. Other Distribution Channels
Nutraceutical Products Market Segmentation By Geography
-
1. North America
- 1.1. United States
- 1.2. Canada
- 1.3. Mexico
- 1.4. Rest of North America
-
2. Europe
- 2.1. Germany
- 2.2. United Kingdom
- 2.3. France
- 2.4. Sweden
- 2.5. Spain
- 2.6. Italy
- 2.7. Russia
- 2.8. Rest of Europe
-
3. Asia Pacific
- 3.1. China
- 3.2. Japan
- 3.3. India
- 3.4. Australia
- 3.5. Rest of Asia Pacific
-
4. South America
- 4.1. Brazil
- 4.2. Argentina
- 4.3. Rest of South America
- 5. Middle East
-
6. South Africa
- 6.1. United Arab Emirates
- 6.2. Rest of Middle East
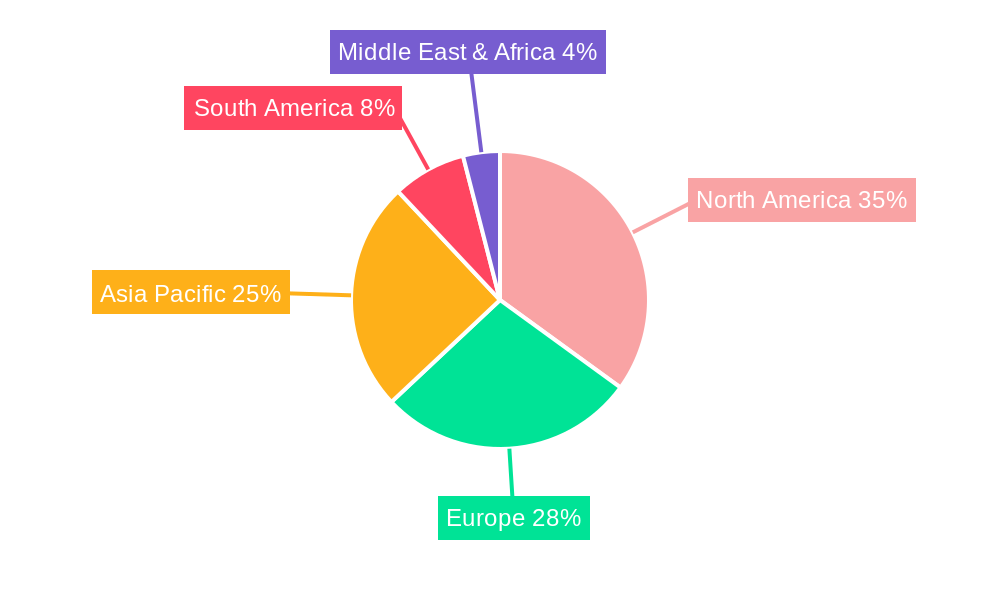
Nutraceutical Products Market Regional Market Share
Geographic Coverage of Nutraceutical Products Market
Nutraceutical Products Market REPORT HIGHLIGHTS
| Aspects | Details |
|---|---|
| Study Period | 2020-2034 |
| Base Year | 2025 |
| Estimated Year | 2026 |
| Forecast Period | 2026-2034 |
| Historical Period | 2020-2025 |
| Growth Rate | CAGR of 5.09% from 2020-2034 |
| Segmentation |
|
Table of Contents
- 1. Introduction
- 1.1. Research Scope
- 1.2. Market Segmentation
- 1.3. Research Objective
- 1.4. Definitions and Assumptions
- 2. Executive Summary
- 2.1. Market Snapshot
- 3. Market Dynamics
- 3.1. Market Drivers
- 3.2. Market Restrains
- 3.3. Market Trends
- 3.4. Market Opportunities
- 4. Market Factor Analysis
- 4.1. Porters Five Forces
- 4.1.1. Bargaining Power of Suppliers
- 4.1.2. Bargaining Power of Buyers
- 4.1.3. Threat of New Entrants
- 4.1.4. Threat of Substitutes
- 4.1.5. Competitive Rivalry
- 4.2. PESTEL analysis
- 4.3. BCG Analysis
- 4.3.1. Stars (High Growth, High Market Share)
- 4.3.2. Cash Cows (Low Growth, High Market Share)
- 4.3.3. Question Mark (High Growth, Low Market Share)
- 4.3.4. Dogs (Low Growth, Low Market Share)
- 4.4. Ansoff Matrix Analysis
- 4.5. Supply Chain Analysis
- 4.6. Regulatory Landscape
- 4.7. Current Market Potential and Opportunity Assessment (TAM–SAM–SOM Framework)
- 4.8. MDP Analyst Note
- 4.1. Porters Five Forces
- 5. Market Analysis, Insights and Forecast 2021-2033
- 5.1. Market Analysis, Insights and Forecast - by Product Type
- 5.1.1. Functional Food
- 5.1.1.1. Cereal
- 5.1.1.2. Bakery and Confectionary
- 5.1.1.3. Dairy
- 5.1.1.4. Snack
- 5.1.1.5. Other Functional Foods
- 5.1.2. Functional Beverage
- 5.1.2.1. Energy Drink
- 5.1.2.2. Sports Drink
- 5.1.2.3. Fortified Juice
- 5.1.2.4. Dairy and Dairy Alternative Beverage
- 5.1.2.5. Other Functional Beverages
- 5.1.3. Dietary Supplements
- 5.1.3.1. Vitamins
- 5.1.3.2. Minerals
- 5.1.3.3. Botanicals
- 5.1.3.4. Enzyme
- 5.1.3.5. Fatty Acids
- 5.1.3.6. Proteins
- 5.1.3.7. Other Dietary Supplements
- 5.1.1. Functional Food
- 5.2. Market Analysis, Insights and Forecast - by Distribution Channel
- 5.2.1. Specialty Stores
- 5.2.2. Supermarkets/Hypermarkets
- 5.2.3. Convenience Stores
- 5.2.4. Drug Stores/Pharmacies
- 5.2.5. Online Retail Stores
- 5.2.6. Other Distribution Channels
- 5.3. Market Analysis, Insights and Forecast - by Region
- 5.3.1. North America
- 5.3.2. Europe
- 5.3.3. Asia Pacific
- 5.3.4. South America
- 5.3.5. Middle East
- 5.3.6. South Africa
- 5.1. Market Analysis, Insights and Forecast - by Product Type
- 6. Global Nutraceutical Products Market Analysis, Insights and Forecast, 2021-2033
- 6.1. Market Analysis, Insights and Forecast - by Product Type
- 6.1.1. Functional Food
- 6.1.1.1. Cereal
- 6.1.1.2. Bakery and Confectionary
- 6.1.1.3. Dairy
- 6.1.1.4. Snack
- 6.1.1.5. Other Functional Foods
- 6.1.2. Functional Beverage
- 6.1.2.1. Energy Drink
- 6.1.2.2. Sports Drink
- 6.1.2.3. Fortified Juice
- 6.1.2.4. Dairy and Dairy Alternative Beverage
- 6.1.2.5. Other Functional Beverages
- 6.1.3. Dietary Supplements
- 6.1.3.1. Vitamins
- 6.1.3.2. Minerals
- 6.1.3.3. Botanicals
- 6.1.3.4. Enzyme
- 6.1.3.5. Fatty Acids
- 6.1.3.6. Proteins
- 6.1.3.7. Other Dietary Supplements
- 6.1.1. Functional Food
- 6.2. Market Analysis, Insights and Forecast - by Distribution Channel
- 6.2.1. Specialty Stores
- 6.2.2. Supermarkets/Hypermarkets
- 6.2.3. Convenience Stores
- 6.2.4. Drug Stores/Pharmacies
- 6.2.5. Online Retail Stores
- 6.2.6. Other Distribution Channels
- 6.1. Market Analysis, Insights and Forecast - by Product Type
- 7. North America Nutraceutical Products Market Analysis, Insights and Forecast, 2020-2032
- 7.1. Market Analysis, Insights and Forecast - by Product Type
- 7.1.1. Functional Food
- 7.1.1.1. Cereal
- 7.1.1.2. Bakery and Confectionary
- 7.1.1.3. Dairy
- 7.1.1.4. Snack
- 7.1.1.5. Other Functional Foods
- 7.1.2. Functional Beverage
- 7.1.2.1. Energy Drink
- 7.1.2.2. Sports Drink
- 7.1.2.3. Fortified Juice
- 7.1.2.4. Dairy and Dairy Alternative Beverage
- 7.1.2.5. Other Functional Beverages
- 7.1.3. Dietary Supplements
- 7.1.3.1. Vitamins
- 7.1.3.2. Minerals
- 7.1.3.3. Botanicals
- 7.1.3.4. Enzyme
- 7.1.3.5. Fatty Acids
- 7.1.3.6. Proteins
- 7.1.3.7. Other Dietary Supplements
- 7.1.1. Functional Food
- 7.2. Market Analysis, Insights and Forecast - by Distribution Channel
- 7.2.1. Specialty Stores
- 7.2.2. Supermarkets/Hypermarkets
- 7.2.3. Convenience Stores
- 7.2.4. Drug Stores/Pharmacies
- 7.2.5. Online Retail Stores
- 7.2.6. Other Distribution Channels
- 7.1. Market Analysis, Insights and Forecast - by Product Type
- 8. Europe Nutraceutical Products Market Analysis, Insights and Forecast, 2020-2032
- 8.1. Market Analysis, Insights and Forecast - by Product Type
- 8.1.1. Functional Food
- 8.1.1.1. Cereal
- 8.1.1.2. Bakery and Confectionary
- 8.1.1.3. Dairy
- 8.1.1.4. Snack
- 8.1.1.5. Other Functional Foods
- 8.1.2. Functional Beverage
- 8.1.2.1. Energy Drink
- 8.1.2.2. Sports Drink
- 8.1.2.3. Fortified Juice
- 8.1.2.4. Dairy and Dairy Alternative Beverage
- 8.1.2.5. Other Functional Beverages
- 8.1.3. Dietary Supplements
- 8.1.3.1. Vitamins
- 8.1.3.2. Minerals
- 8.1.3.3. Botanicals
- 8.1.3.4. Enzyme
- 8.1.3.5. Fatty Acids
- 8.1.3.6. Proteins
- 8.1.3.7. Other Dietary Supplements
- 8.1.1. Functional Food
- 8.2. Market Analysis, Insights and Forecast - by Distribution Channel
- 8.2.1. Specialty Stores
- 8.2.2. Supermarkets/Hypermarkets
- 8.2.3. Convenience Stores
- 8.2.4. Drug Stores/Pharmacies
- 8.2.5. Online Retail Stores
- 8.2.6. Other Distribution Channels
- 8.1. Market Analysis, Insights and Forecast - by Product Type
- 9. Asia Pacific Nutraceutical Products Market Analysis, Insights and Forecast, 2020-2032
- 9.1. Market Analysis, Insights and Forecast - by Product Type
- 9.1.1. Functional Food
- 9.1.1.1. Cereal
- 9.1.1.2. Bakery and Confectionary
- 9.1.1.3. Dairy
- 9.1.1.4. Snack
- 9.1.1.5. Other Functional Foods
- 9.1.2. Functional Beverage
- 9.1.2.1. Energy Drink
- 9.1.2.2. Sports Drink
- 9.1.2.3. Fortified Juice
- 9.1.2.4. Dairy and Dairy Alternative Beverage
- 9.1.2.5. Other Functional Beverages
- 9.1.3. Dietary Supplements
- 9.1.3.1. Vitamins
- 9.1.3.2. Minerals
- 9.1.3.3. Botanicals
- 9.1.3.4. Enzyme
- 9.1.3.5. Fatty Acids
- 9.1.3.6. Proteins
- 9.1.3.7. Other Dietary Supplements
- 9.1.1. Functional Food
- 9.2. Market Analysis, Insights and Forecast - by Distribution Channel
- 9.2.1. Specialty Stores
- 9.2.2. Supermarkets/Hypermarkets
- 9.2.3. Convenience Stores
- 9.2.4. Drug Stores/Pharmacies
- 9.2.5. Online Retail Stores
- 9.2.6. Other Distribution Channels
- 9.1. Market Analysis, Insights and Forecast - by Product Type
- 10. South America Nutraceutical Products Market Analysis, Insights and Forecast, 2020-2032
- 10.1. Market Analysis, Insights and Forecast - by Product Type
- 10.1.1. Functional Food
- 10.1.1.1. Cereal
- 10.1.1.2. Bakery and Confectionary
- 10.1.1.3. Dairy
- 10.1.1.4. Snack
- 10.1.1.5. Other Functional Foods
- 10.1.2. Functional Beverage
- 10.1.2.1. Energy Drink
- 10.1.2.2. Sports Drink
- 10.1.2.3. Fortified Juice
- 10.1.2.4. Dairy and Dairy Alternative Beverage
- 10.1.2.5. Other Functional Beverages
- 10.1.3. Dietary Supplements
- 10.1.3.1. Vitamins
- 10.1.3.2. Minerals
- 10.1.3.3. Botanicals
- 10.1.3.4. Enzyme
- 10.1.3.5. Fatty Acids
- 10.1.3.6. Proteins
- 10.1.3.7. Other Dietary Supplements
- 10.1.1. Functional Food
- 10.2. Market Analysis, Insights and Forecast - by Distribution Channel
- 10.2.1. Specialty Stores
- 10.2.2. Supermarkets/Hypermarkets
- 10.2.3. Convenience Stores
- 10.2.4. Drug Stores/Pharmacies
- 10.2.5. Online Retail Stores
- 10.2.6. Other Distribution Channels
- 10.1. Market Analysis, Insights and Forecast - by Product Type
- 11. Middle East Nutraceutical Products Market Analysis, Insights and Forecast, 2020-2032
- 11.1. Market Analysis, Insights and Forecast - by Product Type
- 11.1.1. Functional Food
- 11.1.1.1. Cereal
- 11.1.1.2. Bakery and Confectionary
- 11.1.1.3. Dairy
- 11.1.1.4. Snack
- 11.1.1.5. Other Functional Foods
- 11.1.2. Functional Beverage
- 11.1.2.1. Energy Drink
- 11.1.2.2. Sports Drink
- 11.1.2.3. Fortified Juice
- 11.1.2.4. Dairy and Dairy Alternative Beverage
- 11.1.2.5. Other Functional Beverages
- 11.1.3. Dietary Supplements
- 11.1.3.1. Vitamins
- 11.1.3.2. Minerals
- 11.1.3.3. Botanicals
- 11.1.3.4. Enzyme
- 11.1.3.5. Fatty Acids
- 11.1.3.6. Proteins
- 11.1.3.7. Other Dietary Supplements
- 11.1.1. Functional Food
- 11.2. Market Analysis, Insights and Forecast - by Distribution Channel
- 11.2.1. Specialty Stores
- 11.2.2. Supermarkets/Hypermarkets
- 11.2.3. Convenience Stores
- 11.2.4. Drug Stores/Pharmacies
- 11.2.5. Online Retail Stores
- 11.2.6. Other Distribution Channels
- 11.1. Market Analysis, Insights and Forecast - by Product Type
- 12. South Africa Nutraceutical Products Market Analysis, Insights and Forecast, 2020-2032
- 12.1. Market Analysis, Insights and Forecast - by Product Type
- 12.1.1. Functional Food
- 12.1.1.1. Cereal
- 12.1.1.2. Bakery and Confectionary
- 12.1.1.3. Dairy
- 12.1.1.4. Snack
- 12.1.1.5. Other Functional Foods
- 12.1.2. Functional Beverage
- 12.1.2.1. Energy Drink
- 12.1.2.2. Sports Drink
- 12.1.2.3. Fortified Juice
- 12.1.2.4. Dairy and Dairy Alternative Beverage
- 12.1.2.5. Other Functional Beverages
- 12.1.3. Dietary Supplements
- 12.1.3.1. Vitamins
- 12.1.3.2. Minerals
- 12.1.3.3. Botanicals
- 12.1.3.4. Enzyme
- 12.1.3.5. Fatty Acids
- 12.1.3.6. Proteins
- 12.1.3.7. Other Dietary Supplements
- 12.1.1. Functional Food
- 12.2. Market Analysis, Insights and Forecast - by Distribution Channel
- 12.2.1. Specialty Stores
- 12.2.2. Supermarkets/Hypermarkets
- 12.2.3. Convenience Stores
- 12.2.4. Drug Stores/Pharmacies
- 12.2.5. Online Retail Stores
- 12.2.6. Other Distribution Channels
- 12.1. Market Analysis, Insights and Forecast - by Product Type
- 13. Competitive Analysis
- 13.1. Company Profiles
- 13.1.1 Alticor Inc (Amway Corporation)
- 13.1.1.1. Company Overview
- 13.1.1.2. Products
- 13.1.1.3. Company Financials
- 13.1.1.4. SWOT Analysis
- 13.1.2 Herbalife International of America Inc
- 13.1.2.1. Company Overview
- 13.1.2.2. Products
- 13.1.2.3. Company Financials
- 13.1.2.4. SWOT Analysis
- 13.1.3 Abbott Laboratories*List Not Exhaustive
- 13.1.3.1. Company Overview
- 13.1.3.2. Products
- 13.1.3.3. Company Financials
- 13.1.3.4. SWOT Analysis
- 13.1.4 General Mills Inc
- 13.1.4.1. Company Overview
- 13.1.4.2. Products
- 13.1.4.3. Company Financials
- 13.1.4.4. SWOT Analysis
- 13.1.5 PepsiCo Inc
- 13.1.5.1. Company Overview
- 13.1.5.2. Products
- 13.1.5.3. Company Financials
- 13.1.5.4. SWOT Analysis
- 13.1.6 Red Bull GmbH
- 13.1.6.1. Company Overview
- 13.1.6.2. Products
- 13.1.6.3. Company Financials
- 13.1.6.4. SWOT Analysis
- 13.1.7 Danone S A
- 13.1.7.1. Company Overview
- 13.1.7.2. Products
- 13.1.7.3. Company Financials
- 13.1.7.4. SWOT Analysis
- 13.1.8 Now Health Group Inc (NOW Foods)
- 13.1.8.1. Company Overview
- 13.1.8.2. Products
- 13.1.8.3. Company Financials
- 13.1.8.4. SWOT Analysis
- 13.1.9 Kellogg Company
- 13.1.9.1. Company Overview
- 13.1.9.2. Products
- 13.1.9.3. Company Financials
- 13.1.9.4. SWOT Analysis
- 13.1.10 Nestlé S A
- 13.1.10.1. Company Overview
- 13.1.10.2. Products
- 13.1.10.3. Company Financials
- 13.1.10.4. SWOT Analysis
- 13.1.1 Alticor Inc (Amway Corporation)
- 13.2. Market Entropy
- 13.2.1 Company's Key Areas Served
- 13.2.2 Recent Developments
- 13.3. Company Market Share Analysis 2025
- 13.3.1 Top 5 Companies Market Share Analysis
- 13.3.2 Top 3 Companies Market Share Analysis
- 13.4. List of Potential Customers
- 14. Research Methodology
List of Figures
- Figure 1: Global Nutraceutical Products Market Revenue Breakdown (Million, %) by Region 2025 & 2033
- Figure 2: North America Nutraceutical Products Market Revenue (Million), by Product Type 2025 & 2033
- Figure 3: North America Nutraceutical Products Market Revenue Share (%), by Product Type 2025 & 2033
- Figure 4: North America Nutraceutical Products Market Revenue (Million), by Distribution Channel 2025 & 2033
- Figure 5: North America Nutraceutical Products Market Revenue Share (%), by Distribution Channel 2025 & 2033
- Figure 6: North America Nutraceutical Products Market Revenue (Million), by Country 2025 & 2033
- Figure 7: North America Nutraceutical Products Market Revenue Share (%), by Country 2025 & 2033
- Figure 8: Europe Nutraceutical Products Market Revenue (Million), by Product Type 2025 & 2033
- Figure 9: Europe Nutraceutical Products Market Revenue Share (%), by Product Type 2025 & 2033
- Figure 10: Europe Nutraceutical Products Market Revenue (Million), by Distribution Channel 2025 & 2033
- Figure 11: Europe Nutraceutical Products Market Revenue Share (%), by Distribution Channel 2025 & 2033
- Figure 12: Europe Nutraceutical Products Market Revenue (Million), by Country 2025 & 2033
- Figure 13: Europe Nutraceutical Products Market Revenue Share (%), by Country 2025 & 2033
- Figure 14: Asia Pacific Nutraceutical Products Market Revenue (Million), by Product Type 2025 & 2033
- Figure 15: Asia Pacific Nutraceutical Products Market Revenue Share (%), by Product Type 2025 & 2033
- Figure 16: Asia Pacific Nutraceutical Products Market Revenue (Million), by Distribution Channel 2025 & 2033
- Figure 17: Asia Pacific Nutraceutical Products Market Revenue Share (%), by Distribution Channel 2025 & 2033
- Figure 18: Asia Pacific Nutraceutical Products Market Revenue (Million), by Country 2025 & 2033
- Figure 19: Asia Pacific Nutraceutical Products Market Revenue Share (%), by Country 2025 & 2033
- Figure 20: South America Nutraceutical Products Market Revenue (Million), by Product Type 2025 & 2033
- Figure 21: South America Nutraceutical Products Market Revenue Share (%), by Product Type 2025 & 2033
- Figure 22: South America Nutraceutical Products Market Revenue (Million), by Distribution Channel 2025 & 2033
- Figure 23: South America Nutraceutical Products Market Revenue Share (%), by Distribution Channel 2025 & 2033
- Figure 24: South America Nutraceutical Products Market Revenue (Million), by Country 2025 & 2033
- Figure 25: South America Nutraceutical Products Market Revenue Share (%), by Country 2025 & 2033
- Figure 26: Middle East Nutraceutical Products Market Revenue (Million), by Product Type 2025 & 2033
- Figure 27: Middle East Nutraceutical Products Market Revenue Share (%), by Product Type 2025 & 2033
- Figure 28: Middle East Nutraceutical Products Market Revenue (Million), by Distribution Channel 2025 & 2033
- Figure 29: Middle East Nutraceutical Products Market Revenue Share (%), by Distribution Channel 2025 & 2033
- Figure 30: Middle East Nutraceutical Products Market Revenue (Million), by Country 2025 & 2033
- Figure 31: Middle East Nutraceutical Products Market Revenue Share (%), by Country 2025 & 2033
- Figure 32: South Africa Nutraceutical Products Market Revenue (Million), by Product Type 2025 & 2033
- Figure 33: South Africa Nutraceutical Products Market Revenue Share (%), by Product Type 2025 & 2033
- Figure 34: South Africa Nutraceutical Products Market Revenue (Million), by Distribution Channel 2025 & 2033
- Figure 35: South Africa Nutraceutical Products Market Revenue Share (%), by Distribution Channel 2025 & 2033
- Figure 36: South Africa Nutraceutical Products Market Revenue (Million), by Country 2025 & 2033
- Figure 37: South Africa Nutraceutical Products Market Revenue Share (%), by Country 2025 & 2033
List of Tables
- Table 1: Global Nutraceutical Products Market Revenue Million Forecast, by Product Type 2020 & 2033
- Table 2: Global Nutraceutical Products Market Revenue Million Forecast, by Distribution Channel 2020 & 2033
- Table 3: Global Nutraceutical Products Market Revenue Million Forecast, by Region 2020 & 2033
- Table 4: Global Nutraceutical Products Market Revenue Million Forecast, by Product Type 2020 & 2033
- Table 5: Global Nutraceutical Products Market Revenue Million Forecast, by Distribution Channel 2020 & 2033
- Table 6: Global Nutraceutical Products Market Revenue Million Forecast, by Country 2020 & 2033
- Table 7: United States Nutraceutical Products Market Revenue (Million) Forecast, by Application 2020 & 2033
- Table 8: Canada Nutraceutical Products Market Revenue (Million) Forecast, by Application 2020 & 2033
- Table 9: Mexico Nutraceutical Products Market Revenue (Million) Forecast, by Application 2020 & 2033
- Table 10: Rest of North America Nutraceutical Products Market Revenue (Million) Forecast, by Application 2020 & 2033
- Table 11: Global Nutraceutical Products Market Revenue Million Forecast, by Product Type 2020 & 2033
- Table 12: Global Nutraceutical Products Market Revenue Million Forecast, by Distribution Channel 2020 & 2033
- Table 13: Global Nutraceutical Products Market Revenue Million Forecast, by Country 2020 & 2033
- Table 14: Germany Nutraceutical Products Market Revenue (Million) Forecast, by Application 2020 & 2033
- Table 15: United Kingdom Nutraceutical Products Market Revenue (Million) Forecast, by Application 2020 & 2033
- Table 16: France Nutraceutical Products Market Revenue (Million) Forecast, by Application 2020 & 2033
- Table 17: Sweden Nutraceutical Products Market Revenue (Million) Forecast, by Application 2020 & 2033
- Table 18: Spain Nutraceutical Products Market Revenue (Million) Forecast, by Application 2020 & 2033
- Table 19: Italy Nutraceutical Products Market Revenue (Million) Forecast, by Application 2020 & 2033
- Table 20: Russia Nutraceutical Products Market Revenue (Million) Forecast, by Application 2020 & 2033
- Table 21: Rest of Europe Nutraceutical Products Market Revenue (Million) Forecast, by Application 2020 & 2033
- Table 22: Global Nutraceutical Products Market Revenue Million Forecast, by Product Type 2020 & 2033
- Table 23: Global Nutraceutical Products Market Revenue Million Forecast, by Distribution Channel 2020 & 2033
- Table 24: Global Nutraceutical Products Market Revenue Million Forecast, by Country 2020 & 2033
- Table 25: China Nutraceutical Products Market Revenue (Million) Forecast, by Application 2020 & 2033
- Table 26: Japan Nutraceutical Products Market Revenue (Million) Forecast, by Application 2020 & 2033
- Table 27: India Nutraceutical Products Market Revenue (Million) Forecast, by Application 2020 & 2033
- Table 28: Australia Nutraceutical Products Market Revenue (Million) Forecast, by Application 2020 & 2033
- Table 29: Rest of Asia Pacific Nutraceutical Products Market Revenue (Million) Forecast, by Application 2020 & 2033
- Table 30: Global Nutraceutical Products Market Revenue Million Forecast, by Product Type 2020 & 2033
- Table 31: Global Nutraceutical Products Market Revenue Million Forecast, by Distribution Channel 2020 & 2033
- Table 32: Global Nutraceutical Products Market Revenue Million Forecast, by Country 2020 & 2033
- Table 33: Brazil Nutraceutical Products Market Revenue (Million) Forecast, by Application 2020 & 2033
- Table 34: Argentina Nutraceutical Products Market Revenue (Million) Forecast, by Application 2020 & 2033
- Table 35: Rest of South America Nutraceutical Products Market Revenue (Million) Forecast, by Application 2020 & 2033
- Table 36: Global Nutraceutical Products Market Revenue Million Forecast, by Product Type 2020 & 2033
- Table 37: Global Nutraceutical Products Market Revenue Million Forecast, by Distribution Channel 2020 & 2033
- Table 38: Global Nutraceutical Products Market Revenue Million Forecast, by Country 2020 & 2033
- Table 39: Global Nutraceutical Products Market Revenue Million Forecast, by Product Type 2020 & 2033
- Table 40: Global Nutraceutical Products Market Revenue Million Forecast, by Distribution Channel 2020 & 2033
- Table 41: Global Nutraceutical Products Market Revenue Million Forecast, by Country 2020 & 2033
- Table 42: United Arab Emirates Nutraceutical Products Market Revenue (Million) Forecast, by Application 2020 & 2033
- Table 43: Rest of Middle East Nutraceutical Products Market Revenue (Million) Forecast, by Application 2020 & 2033
Frequently Asked Questions
1. What is the projected Compound Annual Growth Rate (CAGR) of the Nutraceutical Products Market?
The projected CAGR is approximately 5.09%.
2. Which companies are prominent players in the Nutraceutical Products Market?
Key companies in the market include Alticor Inc (Amway Corporation), Herbalife International of America Inc, Abbott Laboratories*List Not Exhaustive, General Mills Inc, PepsiCo Inc, Red Bull GmbH, Danone S A, Now Health Group Inc (NOW Foods), Kellogg Company, Nestlé S A.
3. What are the main segments of the Nutraceutical Products Market?
The market segments include Product Type, Distribution Channel.
4. Can you provide details about the market size?
The market size is estimated to be USD 488.41 Million as of 2022.
5. What are some drivers contributing to market growth?
Popularity of On-the-Go Snacking Options; Trend Of Clean Label and Plant-Based Bars.
6. What are the notable trends driving market growth?
Increased Demand From Healthy & Functional Foods.
7. Are there any restraints impacting market growth?
Availability of Counterfeit Products.
8. Can you provide examples of recent developments in the market?
June 2022: Kellogg's Special K released new Protein Snack Bars containing 6 grams of protein and 90 calories. The snack bar is offered in two delectable flavors, sweet Berry Vanilla and rich chocolaty Brownie Sundae, and provides a simple on-the-go protein grab without compromising taste.
9. What pricing options are available for accessing the report?
Pricing options include single-user, multi-user, and enterprise licenses priced at USD 4750, USD 5250, and USD 8750 respectively.
10. Is the market size provided in terms of value or volume?
The market size is provided in terms of value, measured in Million.
11. Are there any specific market keywords associated with the report?
Yes, the market keyword associated with the report is "Nutraceutical Products Market," which aids in identifying and referencing the specific market segment covered.
12. How do I determine which pricing option suits my needs best?
The pricing options vary based on user requirements and access needs. Individual users may opt for single-user licenses, while businesses requiring broader access may choose multi-user or enterprise licenses for cost-effective access to the report.
13. Are there any additional resources or data provided in the Nutraceutical Products Market report?
While the report offers comprehensive insights, it's advisable to review the specific contents or supplementary materials provided to ascertain if additional resources or data are available.
14. How can I stay updated on further developments or reports in the Nutraceutical Products Market?
To stay informed about further developments, trends, and reports in the Nutraceutical Products Market, consider subscribing to industry newsletters, following relevant companies and organizations, or regularly checking reputable industry news sources and publications.
Methodology
Step 1 - Identification of Relevant Samples Size from Population Database


Step 2 - Approaches for Defining Global Market Size (Value, Volume* & Price*)

Note*: In applicable scenarios
Step 3 - Data Sources
Primary Research
- Web Analytics
- Survey Reports
- Research Institute
- Latest Research Reports
- Opinion Leaders
Secondary Research
- Annual Reports
- White Paper
- Latest Press Release
- Industry Association
- Paid Database
- Investor Presentations

Step 4 - Data Triangulation
Involves using different sources of information in order to increase the validity of a study
These sources are likely to be stakeholders in a program - participants, other researchers, program staff, other community members, and so on.
Then we put all data in single framework & apply various statistical tools to find out the dynamic on the market.
During the analysis stage, feedback from the stakeholder groups would be compared to determine areas of agreement as well as areas of divergence