

Key Insights
The global non-alcoholic concentrated syrups market is poised for substantial growth, projected to reach $10.97 billion by 2033, with a Compound Annual Growth Rate (CAGR) of 14.17% from the base year 2025. This expansion is driven by increasing consumer demand for health-conscious beverages, home-based beverage customization, and the appeal of convenient, cost-effective solutions. Innovation in unique flavor profiles and the introduction of functional syrups fortified with vitamins and antioxidants are broadening market appeal. The market is segmented by type, with fruit-based syrups leading due to their established popularity. The off-trade sales channel, including retail and supermarkets, currently dominates but is expected to see consistent growth alongside the on-trade segment. Key industry players are focusing on product innovation and strategic expansion to leverage this market opportunity. North America and Europe demonstrate strong performance, supported by high disposable incomes and robust distribution networks. However, the Asia-Pacific region is anticipated to become a significant growth driver due to its expanding middle class and rising demand for convenient beverage options.
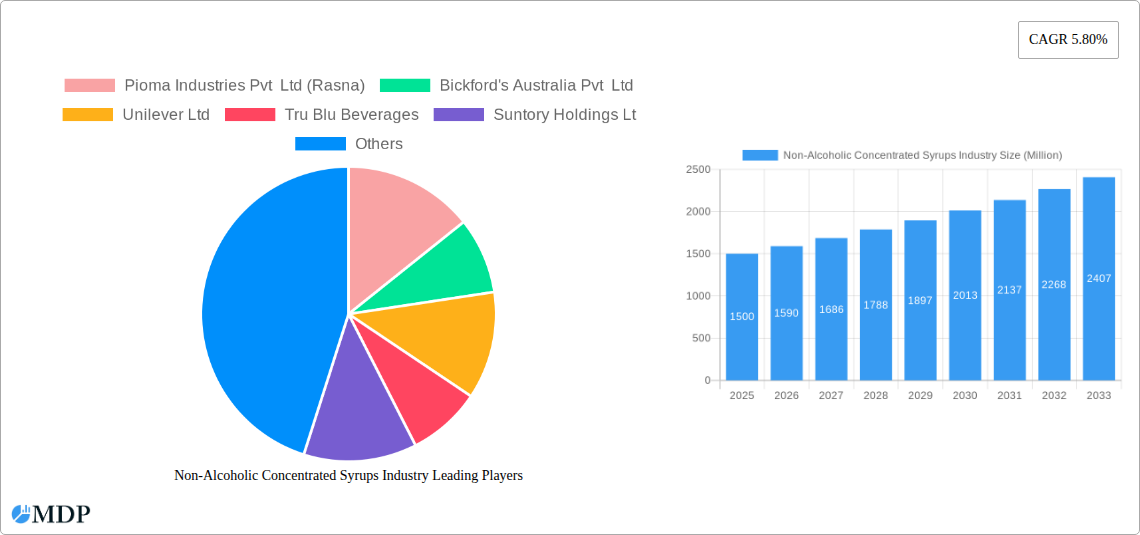
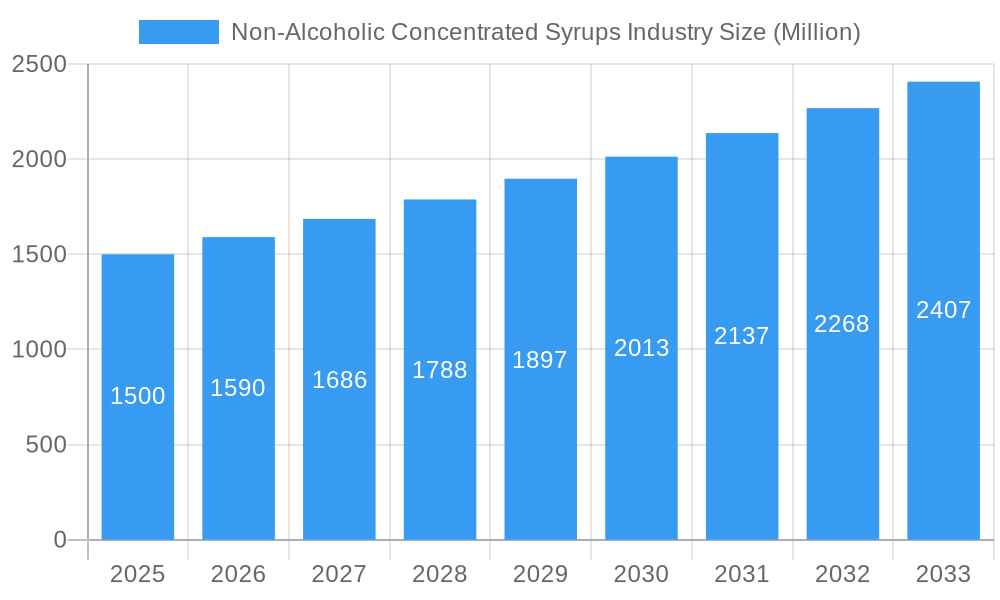
Non-Alcoholic Concentrated Syrups Industry Market Size (In Billion)
Geographic market penetration varies, with North America and Europe maintaining strong positions due to established brands and high per capita consumption. Conversely, the Asia-Pacific region offers considerable untapped potential. Potential restraints include fluctuating raw material prices and competition from alternative beverage categories. Nevertheless, continuous product development, strategic marketing, and a growing emphasis on health and wellness are expected to offset these challenges. The forecast period (2025-2033) indicates sustained growth, particularly in emerging markets, as consumers increasingly value the convenience, affordability, and versatility of non-alcoholic concentrated syrups. The competitive environment will likely remain dynamic, with established and emerging companies competing through product diversification and strategic alliances.
Non-Alcoholic Concentrated Syrups Industry Company Market Share
Non-Alcoholic Concentrated Syrups Industry: A Comprehensive Market Report (2019-2033)
This comprehensive report provides an in-depth analysis of the Non-Alcoholic Concentrated Syrups industry, offering invaluable insights for stakeholders seeking to navigate this dynamic market. Covering the period from 2019 to 2033, with a base year of 2025 and a forecast period of 2025-2033, this report meticulously examines market dynamics, trends, leading players, and future opportunities. The global market size is estimated at XX Million in 2025 and is projected to reach XX Million by 2033, exhibiting a CAGR of xx%. This report is essential for businesses involved in the production, distribution, and retail of non-alcoholic concentrated syrups, including fruit squashes, vegetable squashes, and other types, sold through both off-trade and on-trade channels.
Non-Alcoholic Concentrated Syrups Industry Market Dynamics & Concentration
The Non-Alcoholic Concentrated Syrups industry is characterized by a moderate level of concentration, with key players like Pioma Industries Pvt Ltd (Rasna), Bickford's Australia Pvt Ltd, Unilever Ltd, Tru Blu Beverages, Suntory Holdings Ltd, Britvic PLC, and Golden Circle Ltd holding significant market share. The market share distribution is dynamic, with ongoing M&A activity influencing the competitive landscape. Over the historical period (2019-2024), approximately xx M&A deals were recorded, primarily driven by companies seeking to expand their product portfolios and geographical reach. Innovation in flavor profiles, packaging, and health-focused formulations is a key driver. Stringent regulatory frameworks concerning food safety and labeling influence product development and marketing strategies. The presence of substitutes, such as ready-to-drink beverages and fresh juices, presents a competitive challenge. Growing consumer demand for healthier and more convenient options, coupled with shifting dietary preferences, significantly impact market dynamics.
Non-Alcoholic Concentrated Syrups Industry Industry Trends & Analysis
The Non-Alcoholic Concentrated Syrups market is experiencing robust growth, fueled by several key trends. Increasing disposable incomes in emerging economies drive demand for convenient and affordable beverages. The rising preference for natural and organic ingredients is pushing manufacturers to reformulate their products. Technological advancements in flavor extraction and preservation methods are enhancing product quality and shelf life. The market penetration of fruit squashes in developing countries remains high compared to vegetable squashes, and other types are experiencing niche market growth. The growing popularity of health-conscious lifestyles is driving the demand for low-sugar and functional beverages. Intense competition necessitates continuous innovation and effective marketing strategies to maintain market share. The shift towards sustainable and ethically sourced ingredients is also gaining traction. The competitive dynamics are shaped by pricing strategies, brand loyalty, and distribution networks.
Leading Markets & Segments in Non-Alcoholic Concentrated Syrups Industry
The Asia-Pacific region dominates the Non-Alcoholic Concentrated Syrups market, driven by factors such as high population density, rising disposable incomes, and a preference for flavored beverages. Within this region, India and China stand out as key markets.
Key Drivers in Asia-Pacific:
- Rapid urbanization and changing lifestyles
- Growing middle class with increased purchasing power
- Favorable government policies promoting food and beverage industries
- Well-established distribution networks
Segment Dominance:
- Type: Fruit squashes constitute the largest segment due to widespread consumer preference and established production capabilities.
- Sales Channel: The off-trade channel (retail stores, supermarkets) holds a larger market share compared to the on-trade channel (restaurants, hotels) due to greater accessibility and convenience for consumers.
Detailed dominance analysis reveals that fruit squashes in the off-trade channel of the Asia-Pacific region commands the highest market share, significantly ahead of other segments and regions due to factors outlined above.
Non-Alcoholic Concentrated Syrups Industry Product Developments
Recent product innovations focus on healthier options, with reduced sugar content and the addition of functional ingredients like vitamins and antioxidants. Manufacturers are also exploring new and exotic flavor profiles to cater to evolving consumer preferences. The use of sustainable packaging materials, such as recyclable bottles and pouches, is also gaining traction to improve the environmental footprint. These developments aim to enhance the competitive advantage by catering to the increasing health consciousness and environmental awareness among consumers.
Key Drivers of Non-Alcoholic Concentrated Syrups Industry Growth
Several factors are driving growth in this industry. Technological advancements in processing and packaging are enhancing efficiency and product quality. Favorable economic conditions in several emerging markets are expanding consumer purchasing power. Relaxed regulatory frameworks in some regions are facilitating market entry and expansion. Furthermore, government initiatives promoting local agriculture and food processing are supporting industry development.
Challenges in the Non-Alcoholic Concentrated Syrups Industry Market
The industry faces challenges such as fluctuating raw material prices which impact production costs and profitability. Stringent regulatory requirements related to food safety and labeling increase compliance costs for manufacturers. Intense competition from established and emerging players puts pressure on pricing and market share. Supply chain disruptions due to geopolitical events can severely impact the availability of raw materials and create delays. These factors collectively limit the overall growth potential.
Emerging Opportunities in Non-Alcoholic Concentrated Syrups Industry
Significant opportunities lie in expanding into new markets, particularly in Africa and Latin America. The development of innovative products catering to specific dietary needs (e.g., low-sugar, diabetic-friendly) promises strong market potential. Strategic partnerships with food retailers and distributors can broaden reach and enhance distribution efficiency. Technological advancements in flavor creation, and sustainable packaging solutions will drive long-term growth.
Leading Players in the Non-Alcoholic Concentrated Syrups Industry Sector
- Pioma Industries Pvt Ltd (Rasna)
- Bickford's Australia Pvt Ltd
- Unilever Ltd
- Tru Blu Beverages
- Suntory Holdings Ltd
- Britvic PLC
- Golden Circle Ltd
Key Milestones in Non-Alcoholic Concentrated Syrups Industry Industry
- 2020: Unilever launches a new range of organic fruit squashes.
- 2021: Rasna introduces a line of low-sugar fruit squashes in response to changing consumer preferences.
- 2022: A significant merger occurs between two smaller players in the industry, consolidating market share.
- 2023: Britvic PLC invests heavily in sustainable packaging solutions for its products.
- 2024: Several key players introduce new flavors and product variants to stay ahead of the competition.
Strategic Outlook for Non-Alcoholic Concentrated Syrups Industry Market
The future of the Non-Alcoholic Concentrated Syrups market appears bright, driven by consistent innovation, expanding consumer demand, and the continuous exploration of new product categories and regional markets. Companies that strategically invest in research and development, sustainable practices, and effective marketing will be best positioned for long-term success. The focus should be on creating high-quality, healthy, and convenient products tailored to evolving consumer preferences, ensuring sustainable growth in this dynamic industry.
Non-Alcoholic Concentrated Syrups Industry Segmentation
-
1. Type
- 1.1. Fruit Squashes
- 1.2. Vegetable Squashes
- 1.3. Other Types
-
2. Sales Channel
- 2.1. Off-trade
- 2.2. On-trade
Non-Alcoholic Concentrated Syrups Industry Segmentation By Geography
-
1. North America
- 1.1. United States
- 1.2. Canada
- 1.3. Mexico
- 1.4. Rest of North America
-
2. Europe
- 2.1. Spain
- 2.2. United Kingdom
- 2.3. Germany
- 2.4. France
- 2.5. Italy
- 2.6. Russia
- 2.7. Rest of Europe
-
3. Asia Pacific
- 3.1. China
- 3.2. Japan
- 3.3. India
- 3.4. Australia
- 3.5. Rest of Asia Pacific
-
4. Rest of the World
- 4.1. South America
- 4.2. Middle East
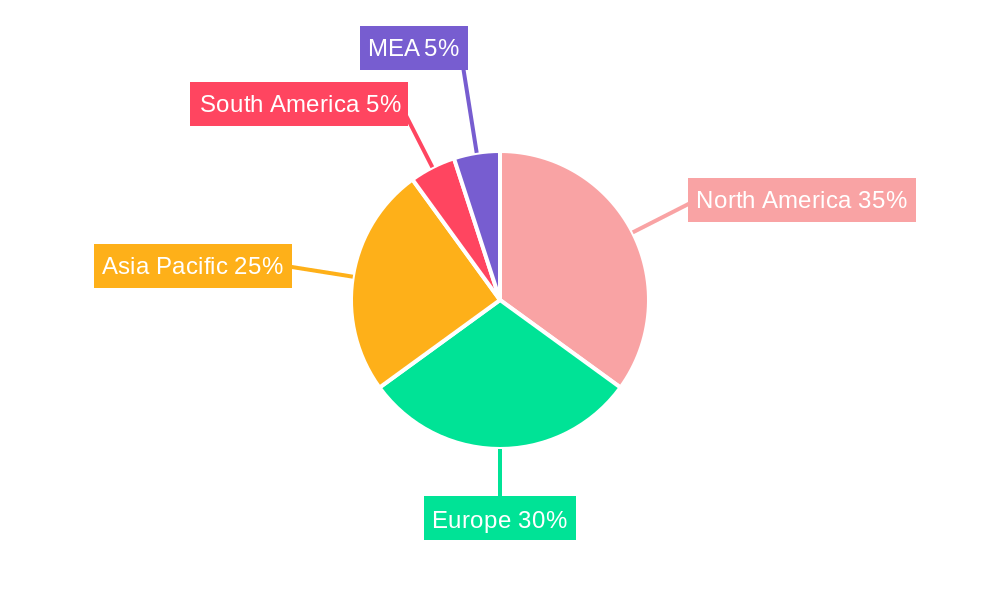
Non-Alcoholic Concentrated Syrups Industry Regional Market Share
Geographic Coverage of Non-Alcoholic Concentrated Syrups Industry
Non-Alcoholic Concentrated Syrups Industry REPORT HIGHLIGHTS
| Aspects | Details |
|---|---|
| Study Period | 2020-2034 |
| Base Year | 2025 |
| Estimated Year | 2026 |
| Forecast Period | 2026-2034 |
| Historical Period | 2020-2025 |
| Growth Rate | CAGR of 14.17% from 2020-2034 |
| Segmentation |
|
Table of Contents
- 1. Introduction
- 1.1. Research Scope
- 1.2. Market Segmentation
- 1.3. Research Objective
- 1.4. Definitions and Assumptions
- 2. Executive Summary
- 2.1. Market Snapshot
- 3. Market Dynamics
- 3.1. Market Drivers
- 3.2. Market Restrains
- 3.3. Market Trends
- 3.4. Market Opportunities
- 4. Market Factor Analysis
- 4.1. Porters Five Forces
- 4.1.1. Bargaining Power of Suppliers
- 4.1.2. Bargaining Power of Buyers
- 4.1.3. Threat of New Entrants
- 4.1.4. Threat of Substitutes
- 4.1.5. Competitive Rivalry
- 4.2. PESTEL analysis
- 4.3. BCG Analysis
- 4.3.1. Stars (High Growth, High Market Share)
- 4.3.2. Cash Cows (Low Growth, High Market Share)
- 4.3.3. Question Mark (High Growth, Low Market Share)
- 4.3.4. Dogs (Low Growth, Low Market Share)
- 4.4. Ansoff Matrix Analysis
- 4.5. Supply Chain Analysis
- 4.6. Regulatory Landscape
- 4.7. Current Market Potential and Opportunity Assessment (TAM–SAM–SOM Framework)
- 4.8. MDP Analyst Note
- 4.1. Porters Five Forces
- 5. Market Analysis, Insights and Forecast 2021-2033
- 5.1. Market Analysis, Insights and Forecast - by Type
- 5.1.1. Fruit Squashes
- 5.1.2. Vegetable Squashes
- 5.1.3. Other Types
- 5.2. Market Analysis, Insights and Forecast - by Sales Channel
- 5.2.1. Off-trade
- 5.2.2. On-trade
- 5.3. Market Analysis, Insights and Forecast - by Region
- 5.3.1. North America
- 5.3.2. Europe
- 5.3.3. Asia Pacific
- 5.3.4. Rest of the World
- 5.1. Market Analysis, Insights and Forecast - by Type
- 6. Global Non-Alcoholic Concentrated Syrups Industry Analysis, Insights and Forecast, 2021-2033
- 6.1. Market Analysis, Insights and Forecast - by Type
- 6.1.1. Fruit Squashes
- 6.1.2. Vegetable Squashes
- 6.1.3. Other Types
- 6.2. Market Analysis, Insights and Forecast - by Sales Channel
- 6.2.1. Off-trade
- 6.2.2. On-trade
- 6.1. Market Analysis, Insights and Forecast - by Type
- 7. North America Non-Alcoholic Concentrated Syrups Industry Analysis, Insights and Forecast, 2020-2032
- 7.1. Market Analysis, Insights and Forecast - by Type
- 7.1.1. Fruit Squashes
- 7.1.2. Vegetable Squashes
- 7.1.3. Other Types
- 7.2. Market Analysis, Insights and Forecast - by Sales Channel
- 7.2.1. Off-trade
- 7.2.2. On-trade
- 7.1. Market Analysis, Insights and Forecast - by Type
- 8. Europe Non-Alcoholic Concentrated Syrups Industry Analysis, Insights and Forecast, 2020-2032
- 8.1. Market Analysis, Insights and Forecast - by Type
- 8.1.1. Fruit Squashes
- 8.1.2. Vegetable Squashes
- 8.1.3. Other Types
- 8.2. Market Analysis, Insights and Forecast - by Sales Channel
- 8.2.1. Off-trade
- 8.2.2. On-trade
- 8.1. Market Analysis, Insights and Forecast - by Type
- 9. Asia Pacific Non-Alcoholic Concentrated Syrups Industry Analysis, Insights and Forecast, 2020-2032
- 9.1. Market Analysis, Insights and Forecast - by Type
- 9.1.1. Fruit Squashes
- 9.1.2. Vegetable Squashes
- 9.1.3. Other Types
- 9.2. Market Analysis, Insights and Forecast - by Sales Channel
- 9.2.1. Off-trade
- 9.2.2. On-trade
- 9.1. Market Analysis, Insights and Forecast - by Type
- 10. Rest of the World Non-Alcoholic Concentrated Syrups Industry Analysis, Insights and Forecast, 2020-2032
- 10.1. Market Analysis, Insights and Forecast - by Type
- 10.1.1. Fruit Squashes
- 10.1.2. Vegetable Squashes
- 10.1.3. Other Types
- 10.2. Market Analysis, Insights and Forecast - by Sales Channel
- 10.2.1. Off-trade
- 10.2.2. On-trade
- 10.1. Market Analysis, Insights and Forecast - by Type
- 11. Competitive Analysis
- 11.1. Company Profiles
- 11.1.1 Pioma Industries Pvt Ltd (Rasna)
- 11.1.1.1. Company Overview
- 11.1.1.2. Products
- 11.1.1.3. Company Financials
- 11.1.1.4. SWOT Analysis
- 11.1.2 Bickford's Australia Pvt Ltd
- 11.1.2.1. Company Overview
- 11.1.2.2. Products
- 11.1.2.3. Company Financials
- 11.1.2.4. SWOT Analysis
- 11.1.3 Unilever Ltd
- 11.1.3.1. Company Overview
- 11.1.3.2. Products
- 11.1.3.3. Company Financials
- 11.1.3.4. SWOT Analysis
- 11.1.4 Tru Blu Beverages
- 11.1.4.1. Company Overview
- 11.1.4.2. Products
- 11.1.4.3. Company Financials
- 11.1.4.4. SWOT Analysis
- 11.1.5 Suntory Holdings Lt
- 11.1.5.1. Company Overview
- 11.1.5.2. Products
- 11.1.5.3. Company Financials
- 11.1.5.4. SWOT Analysis
- 11.1.6 Britvic PLC
- 11.1.6.1. Company Overview
- 11.1.6.2. Products
- 11.1.6.3. Company Financials
- 11.1.6.4. SWOT Analysis
- 11.1.7 Golden Circle Ltd
- 11.1.7.1. Company Overview
- 11.1.7.2. Products
- 11.1.7.3. Company Financials
- 11.1.7.4. SWOT Analysis
- 11.1.1 Pioma Industries Pvt Ltd (Rasna)
- 11.2. Market Entropy
- 11.2.1 Company's Key Areas Served
- 11.2.2 Recent Developments
- 11.3. Company Market Share Analysis 2025
- 11.3.1 Top 5 Companies Market Share Analysis
- 11.3.2 Top 3 Companies Market Share Analysis
- 11.4. List of Potential Customers
- 12. Research Methodology
List of Figures
- Figure 1: Global Non-Alcoholic Concentrated Syrups Industry Revenue Breakdown (billion, %) by Region 2025 & 2033
- Figure 2: North America Non-Alcoholic Concentrated Syrups Industry Revenue (billion), by Type 2025 & 2033
- Figure 3: North America Non-Alcoholic Concentrated Syrups Industry Revenue Share (%), by Type 2025 & 2033
- Figure 4: North America Non-Alcoholic Concentrated Syrups Industry Revenue (billion), by Sales Channel 2025 & 2033
- Figure 5: North America Non-Alcoholic Concentrated Syrups Industry Revenue Share (%), by Sales Channel 2025 & 2033
- Figure 6: North America Non-Alcoholic Concentrated Syrups Industry Revenue (billion), by Country 2025 & 2033
- Figure 7: North America Non-Alcoholic Concentrated Syrups Industry Revenue Share (%), by Country 2025 & 2033
- Figure 8: Europe Non-Alcoholic Concentrated Syrups Industry Revenue (billion), by Type 2025 & 2033
- Figure 9: Europe Non-Alcoholic Concentrated Syrups Industry Revenue Share (%), by Type 2025 & 2033
- Figure 10: Europe Non-Alcoholic Concentrated Syrups Industry Revenue (billion), by Sales Channel 2025 & 2033
- Figure 11: Europe Non-Alcoholic Concentrated Syrups Industry Revenue Share (%), by Sales Channel 2025 & 2033
- Figure 12: Europe Non-Alcoholic Concentrated Syrups Industry Revenue (billion), by Country 2025 & 2033
- Figure 13: Europe Non-Alcoholic Concentrated Syrups Industry Revenue Share (%), by Country 2025 & 2033
- Figure 14: Asia Pacific Non-Alcoholic Concentrated Syrups Industry Revenue (billion), by Type 2025 & 2033
- Figure 15: Asia Pacific Non-Alcoholic Concentrated Syrups Industry Revenue Share (%), by Type 2025 & 2033
- Figure 16: Asia Pacific Non-Alcoholic Concentrated Syrups Industry Revenue (billion), by Sales Channel 2025 & 2033
- Figure 17: Asia Pacific Non-Alcoholic Concentrated Syrups Industry Revenue Share (%), by Sales Channel 2025 & 2033
- Figure 18: Asia Pacific Non-Alcoholic Concentrated Syrups Industry Revenue (billion), by Country 2025 & 2033
- Figure 19: Asia Pacific Non-Alcoholic Concentrated Syrups Industry Revenue Share (%), by Country 2025 & 2033
- Figure 20: Rest of the World Non-Alcoholic Concentrated Syrups Industry Revenue (billion), by Type 2025 & 2033
- Figure 21: Rest of the World Non-Alcoholic Concentrated Syrups Industry Revenue Share (%), by Type 2025 & 2033
- Figure 22: Rest of the World Non-Alcoholic Concentrated Syrups Industry Revenue (billion), by Sales Channel 2025 & 2033
- Figure 23: Rest of the World Non-Alcoholic Concentrated Syrups Industry Revenue Share (%), by Sales Channel 2025 & 2033
- Figure 24: Rest of the World Non-Alcoholic Concentrated Syrups Industry Revenue (billion), by Country 2025 & 2033
- Figure 25: Rest of the World Non-Alcoholic Concentrated Syrups Industry Revenue Share (%), by Country 2025 & 2033
List of Tables
- Table 1: Global Non-Alcoholic Concentrated Syrups Industry Revenue billion Forecast, by Type 2020 & 2033
- Table 2: Global Non-Alcoholic Concentrated Syrups Industry Revenue billion Forecast, by Sales Channel 2020 & 2033
- Table 3: Global Non-Alcoholic Concentrated Syrups Industry Revenue billion Forecast, by Region 2020 & 2033
- Table 4: Global Non-Alcoholic Concentrated Syrups Industry Revenue billion Forecast, by Type 2020 & 2033
- Table 5: Global Non-Alcoholic Concentrated Syrups Industry Revenue billion Forecast, by Sales Channel 2020 & 2033
- Table 6: Global Non-Alcoholic Concentrated Syrups Industry Revenue billion Forecast, by Country 2020 & 2033
- Table 7: United States Non-Alcoholic Concentrated Syrups Industry Revenue (billion) Forecast, by Application 2020 & 2033
- Table 8: Canada Non-Alcoholic Concentrated Syrups Industry Revenue (billion) Forecast, by Application 2020 & 2033
- Table 9: Mexico Non-Alcoholic Concentrated Syrups Industry Revenue (billion) Forecast, by Application 2020 & 2033
- Table 10: Rest of North America Non-Alcoholic Concentrated Syrups Industry Revenue (billion) Forecast, by Application 2020 & 2033
- Table 11: Global Non-Alcoholic Concentrated Syrups Industry Revenue billion Forecast, by Type 2020 & 2033
- Table 12: Global Non-Alcoholic Concentrated Syrups Industry Revenue billion Forecast, by Sales Channel 2020 & 2033
- Table 13: Global Non-Alcoholic Concentrated Syrups Industry Revenue billion Forecast, by Country 2020 & 2033
- Table 14: Spain Non-Alcoholic Concentrated Syrups Industry Revenue (billion) Forecast, by Application 2020 & 2033
- Table 15: United Kingdom Non-Alcoholic Concentrated Syrups Industry Revenue (billion) Forecast, by Application 2020 & 2033
- Table 16: Germany Non-Alcoholic Concentrated Syrups Industry Revenue (billion) Forecast, by Application 2020 & 2033
- Table 17: France Non-Alcoholic Concentrated Syrups Industry Revenue (billion) Forecast, by Application 2020 & 2033
- Table 18: Italy Non-Alcoholic Concentrated Syrups Industry Revenue (billion) Forecast, by Application 2020 & 2033
- Table 19: Russia Non-Alcoholic Concentrated Syrups Industry Revenue (billion) Forecast, by Application 2020 & 2033
- Table 20: Rest of Europe Non-Alcoholic Concentrated Syrups Industry Revenue (billion) Forecast, by Application 2020 & 2033
- Table 21: Global Non-Alcoholic Concentrated Syrups Industry Revenue billion Forecast, by Type 2020 & 2033
- Table 22: Global Non-Alcoholic Concentrated Syrups Industry Revenue billion Forecast, by Sales Channel 2020 & 2033
- Table 23: Global Non-Alcoholic Concentrated Syrups Industry Revenue billion Forecast, by Country 2020 & 2033
- Table 24: China Non-Alcoholic Concentrated Syrups Industry Revenue (billion) Forecast, by Application 2020 & 2033
- Table 25: Japan Non-Alcoholic Concentrated Syrups Industry Revenue (billion) Forecast, by Application 2020 & 2033
- Table 26: India Non-Alcoholic Concentrated Syrups Industry Revenue (billion) Forecast, by Application 2020 & 2033
- Table 27: Australia Non-Alcoholic Concentrated Syrups Industry Revenue (billion) Forecast, by Application 2020 & 2033
- Table 28: Rest of Asia Pacific Non-Alcoholic Concentrated Syrups Industry Revenue (billion) Forecast, by Application 2020 & 2033
- Table 29: Global Non-Alcoholic Concentrated Syrups Industry Revenue billion Forecast, by Type 2020 & 2033
- Table 30: Global Non-Alcoholic Concentrated Syrups Industry Revenue billion Forecast, by Sales Channel 2020 & 2033
- Table 31: Global Non-Alcoholic Concentrated Syrups Industry Revenue billion Forecast, by Country 2020 & 2033
- Table 32: South America Non-Alcoholic Concentrated Syrups Industry Revenue (billion) Forecast, by Application 2020 & 2033
- Table 33: Middle East Non-Alcoholic Concentrated Syrups Industry Revenue (billion) Forecast, by Application 2020 & 2033
Frequently Asked Questions
1. What is the projected Compound Annual Growth Rate (CAGR) of the Non-Alcoholic Concentrated Syrups Industry?
The projected CAGR is approximately 14.17%.
2. Which companies are prominent players in the Non-Alcoholic Concentrated Syrups Industry?
Key companies in the market include Pioma Industries Pvt Ltd (Rasna), Bickford's Australia Pvt Ltd, Unilever Ltd, Tru Blu Beverages, Suntory Holdings Lt, Britvic PLC, Golden Circle Ltd.
3. What are the main segments of the Non-Alcoholic Concentrated Syrups Industry?
The market segments include Type, Sales Channel.
4. Can you provide details about the market size?
The market size is estimated to be USD 10.97 billion as of 2022.
5. What are some drivers contributing to market growth?
The ease of use and long shelf life of concentrated syrups make them popular for both commercial use and at-home preparation of beverages..
6. What are the notable trends driving market growth?
Increasing interest in syrups made with natural ingredients. reduced sugar content. and organic certifications to cater to health-conscious consumers.
7. Are there any restraints impacting market growth?
Some consumers may be wary of concentrated syrups due to concerns about high sugar content and artificial ingredients. which can affect market growth.
8. Can you provide examples of recent developments in the market?
N/A
9. What pricing options are available for accessing the report?
Pricing options include single-user, multi-user, and enterprise licenses priced at USD 4750, USD 5250, and USD 8750 respectively.
10. Is the market size provided in terms of value or volume?
The market size is provided in terms of value, measured in billion.
11. Are there any specific market keywords associated with the report?
Yes, the market keyword associated with the report is "Non-Alcoholic Concentrated Syrups Industry," which aids in identifying and referencing the specific market segment covered.
12. How do I determine which pricing option suits my needs best?
The pricing options vary based on user requirements and access needs. Individual users may opt for single-user licenses, while businesses requiring broader access may choose multi-user or enterprise licenses for cost-effective access to the report.
13. Are there any additional resources or data provided in the Non-Alcoholic Concentrated Syrups Industry report?
While the report offers comprehensive insights, it's advisable to review the specific contents or supplementary materials provided to ascertain if additional resources or data are available.
14. How can I stay updated on further developments or reports in the Non-Alcoholic Concentrated Syrups Industry?
To stay informed about further developments, trends, and reports in the Non-Alcoholic Concentrated Syrups Industry, consider subscribing to industry newsletters, following relevant companies and organizations, or regularly checking reputable industry news sources and publications.
Methodology
Step 1 - Identification of Relevant Samples Size from Population Database


Step 2 - Approaches for Defining Global Market Size (Value, Volume* & Price*)

Note*: In applicable scenarios
Step 3 - Data Sources
Primary Research
- Web Analytics
- Survey Reports
- Research Institute
- Latest Research Reports
- Opinion Leaders
Secondary Research
- Annual Reports
- White Paper
- Latest Press Release
- Industry Association
- Paid Database
- Investor Presentations

Step 4 - Data Triangulation
Involves using different sources of information in order to increase the validity of a study
These sources are likely to be stakeholders in a program - participants, other researchers, program staff, other community members, and so on.
Then we put all data in single framework & apply various statistical tools to find out the dynamic on the market.
During the analysis stage, feedback from the stakeholder groups would be compared to determine areas of agreement as well as areas of divergence