

Key Insights
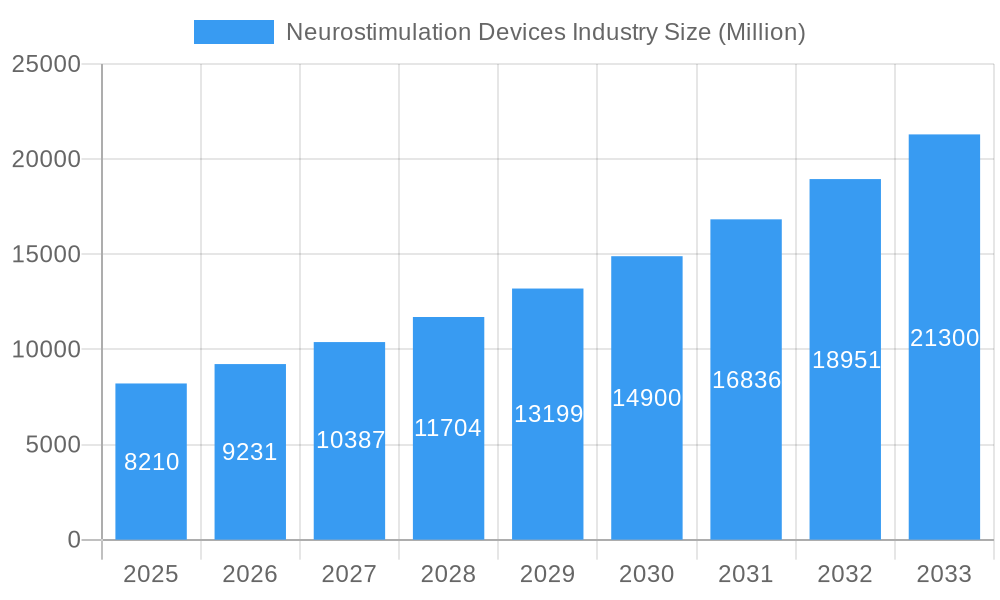
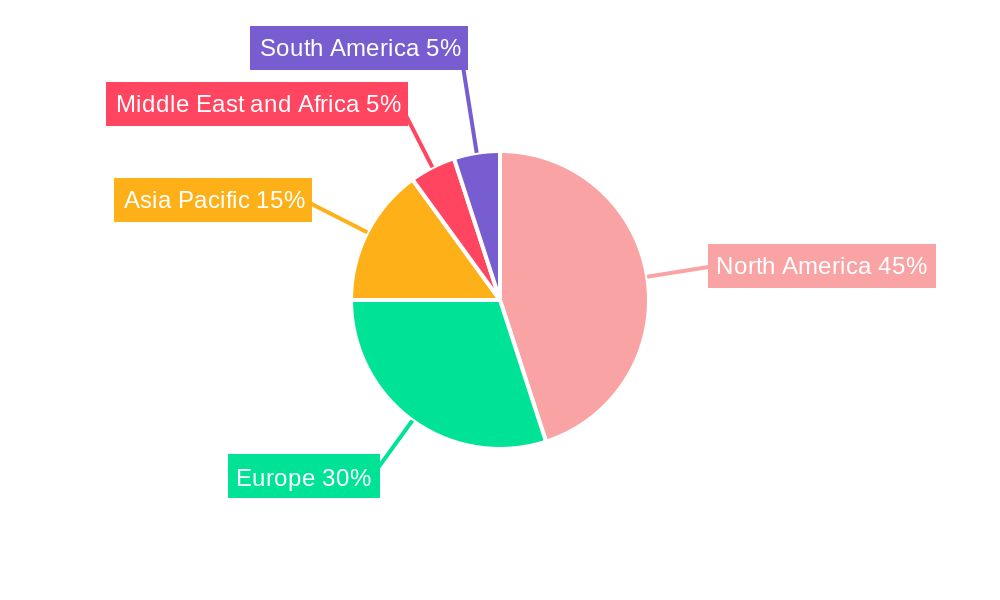
The neurostimulation devices market, valued at $8.21 billion in 2025, is experiencing robust growth, projected to expand at a compound annual growth rate (CAGR) of 12.50% from 2025 to 2033. This significant expansion is driven by several key factors. The increasing prevalence of neurological disorders like Parkinson's disease, epilepsy, and chronic pain is a major catalyst. Advancements in device technology, leading to smaller, more effective, and less invasive implants, are further fueling market growth. Moreover, rising awareness among patients and healthcare professionals regarding the benefits of neurostimulation, coupled with supportive reimbursement policies in developed regions, contributes to market expansion. The market is segmented by device type (implantable and external), application (Parkinson's disease, epilepsy, depression, dystonia, pain management, and others), and end-users (clinics, hospitals, and rehabilitation centers). The implantable device segment currently holds a larger market share due to its efficacy in treating severe neurological conditions. However, the external device segment is projected to witness considerable growth due to its minimally invasive nature and increasing preference for less-intensive treatments. North America, particularly the United States, currently dominates the market, owing to high healthcare expenditure and technological advancements. However, rapidly developing economies in Asia Pacific are expected to show significant growth over the forecast period, driven by increasing awareness and rising disposable incomes.
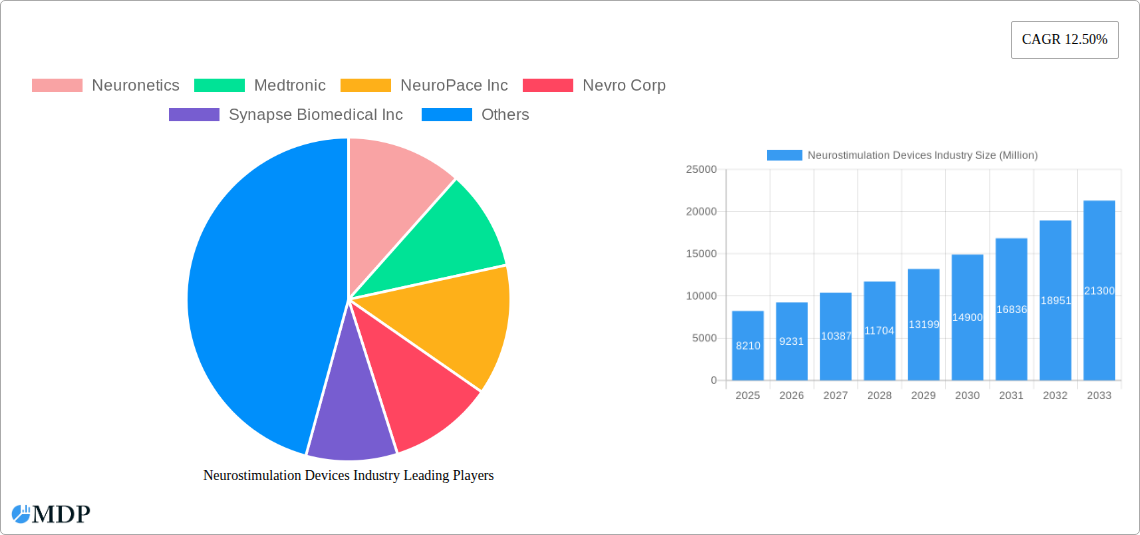
Neurostimulation Devices Industry Market Size (In Billion)
Competition in the neurostimulation devices market is intense, with key players such as Medtronic, Boston Scientific, Abbott, Neuronetics, and NeuroPace Inc. constantly innovating and expanding their product portfolios. Strategic partnerships, mergers, and acquisitions are also common strategies employed to gain a competitive edge. Despite the positive growth outlook, certain challenges remain. High treatment costs and potential side effects associated with some devices pose barriers to wider adoption. Furthermore, stringent regulatory approvals and reimbursement processes can impact market entry and growth, particularly in emerging markets. However, ongoing research and development efforts are focused on addressing these limitations, potentially leading to safer, more effective, and more affordable neurostimulation therapies in the future. The overall market trajectory indicates a promising future for neurostimulation devices, driven by technological progress, increasing prevalence of target conditions, and improved healthcare infrastructure globally.
Neurostimulation Devices Industry Company Market Share
Neurostimulation Devices Industry Market Report: 2019-2033
This comprehensive report provides an in-depth analysis of the Neurostimulation Devices market, offering crucial insights for stakeholders, investors, and industry professionals. The study period spans 2019-2033, with 2025 serving as the base and estimated year. The report projects market trends to 2033, leveraging data from the historical period (2019-2024) and incorporating recent key developments. The market is segmented by device type (implantable and external), application (Parkinson's Disease, Epilepsy, Depression, Dystonia, Pain Management, and Other Applications), and end-users (Clinics, Hospitals, and Rehabilitation Centers). Key players analyzed include Neuronetics, Medtronic, NeuroPace Inc, Nevro Corp, Synapse Biomedical Inc, LivaNova PLC, Abbott, Curonix LLC, Boston Scientific Corporation, and Aleva Neurotherapeutics. The report projects a market value exceeding xx Million by 2033.
Neurostimulation Devices Industry Market Dynamics & Concentration
The neurostimulation devices market is characterized by moderate concentration, with a few major players holding significant market share. Medtronic and Boston Scientific are currently estimated to control approximately 40% of the global market, while other companies such as Abbott and Nevro Corp hold smaller, but still significant, shares. Market share fluctuations are influenced by new product launches, regulatory approvals, and strategic mergers and acquisitions (M&A). The historical period (2019-2024) witnessed approximately xx M&A deals, primarily driven by the desire to expand product portfolios and access new markets. Innovation in device technology, particularly in areas like rechargeable batteries and minimally invasive implantation techniques, is a key driver. Stringent regulatory frameworks, including FDA approvals in the US and CE marking in Europe, shape market entry and product development. The market faces competition from alternative therapies, such as medication and physiotherapy, but the increasing efficacy and patient preference for neurostimulation are contributing to market growth. End-user trends show a preference for minimally invasive procedures and improved patient outcomes, pushing innovation toward smaller, more sophisticated devices.
Neurostimulation Devices Industry Trends & Analysis
The global neurostimulation devices market is experiencing robust growth, driven by several factors. The increasing prevalence of neurological disorders like Parkinson's disease, epilepsy, and chronic pain is a primary catalyst. Technological advancements, such as the development of advanced stimulation techniques, improved battery technology, and sophisticated data analytics, are significantly enhancing the efficacy and safety of these devices. The rising preference for minimally invasive procedures is boosting the adoption of external and implantable devices. Market penetration rates are increasing across various therapeutic applications, especially in developed regions like North America and Europe. The market is also witnessing a shift towards personalized medicine, with tailored treatment plans based on individual patient needs. The CAGR for the forecast period (2025-2033) is estimated to be xx%, reflecting the positive market outlook. Competitive dynamics are shaping the market with companies focusing on product differentiation through enhanced features, improved patient outcomes, and strategic partnerships.
Leading Markets & Segments in Neurostimulation Devices Industry
Dominant Region: North America currently holds the largest market share, driven by factors such as high healthcare expenditure, advanced medical infrastructure, and a high prevalence of target neurological disorders. Europe is expected to follow closely. Emerging economies in Asia-Pacific are showing substantial growth potential.
Dominant Segment (Device Type): Implantable devices dominate the market owing to their long-term efficacy and effectiveness in managing chronic conditions. However, external devices are witnessing substantial growth due to increasing demand for non-invasive treatment options.
Dominant Segment (Application): Pain management currently holds a leading position in terms of revenue due to the wide range of chronic pain conditions and the growing acceptance of neurostimulation as an effective treatment modality. Epilepsy and Parkinson's Disease are also major application segments.
Dominant Segment (End-User): Hospitals and specialized clinics are the primary end-users, given their infrastructure and expertise in handling neurostimulation procedures. Rehabilitation centers also play an important role in post-implantation care and patient recovery.
Key drivers for regional dominance include robust healthcare infrastructure, supportive regulatory environments, high per capita healthcare spending, and higher disease prevalence. North America’s dominance is also fueled by strong technological innovation and the presence of major market players.
Neurostimulation Devices Industry Product Developments
Recent years have witnessed significant advancements in neurostimulation devices, focusing on improved targeting, reduced side effects, and enhanced patient comfort. Miniaturization of devices, along with advancements in battery technology (e.g., rechargeable systems), are key improvements. Innovative stimulation techniques, including closed-loop systems and personalized stimulation algorithms, are enhancing therapeutic efficacy. The introduction of wireless connectivity features allows for remote monitoring and adjustments, improving patient management and reducing the need for frequent clinic visits. These technological trends align with market demand for less invasive, more effective, and convenient treatment solutions. This is driving market growth and increasing the competitiveness among companies.
Key Drivers of Neurostimulation Devices Industry Growth
Several factors fuel the growth of the neurostimulation devices market:
Rising Prevalence of Neurological Disorders: The increasing incidence of Parkinson's disease, epilepsy, chronic pain, and other neurological conditions drives demand for effective treatment options.
Technological Advancements: Innovations in device design, stimulation techniques, and data analytics enhance treatment efficacy and patient comfort.
Favorable Regulatory Environment: Approvals by regulatory bodies such as the FDA facilitate market entry and expansion.
Increasing Healthcare Expenditure: Growing healthcare spending in developed and developing economies supports investment in advanced medical technologies.
Challenges in the Neurostimulation Devices Industry Market
The industry faces challenges such as:
High Cost of Devices and Procedures: The high cost can limit accessibility, particularly in low- and middle-income countries.
Stringent Regulatory Approvals: The lengthy and complex regulatory processes can delay product launches.
Intense Competition: The market is increasingly competitive, with established players and new entrants vying for market share.
Potential Side Effects: While generally safe, neurostimulation carries risks of side effects that can limit patient adoption. These factors collectively impact market growth, requiring strategic approaches by manufacturers to overcome these limitations.
Emerging Opportunities in Neurostimulation Devices Industry
The market offers exciting opportunities driven by several factors. Continued technological innovation, particularly in the development of closed-loop systems and AI-powered therapies, will increase treatment efficacy and personalize care. Strategic partnerships between device manufacturers and healthcare providers are expanding access to these technologies. Market expansion in emerging economies offers significant growth potential, especially as healthcare infrastructure improves and awareness of neurostimulation therapy increases. Finally, the development of novel applications for neurostimulation beyond the currently established therapeutic areas will further drive market expansion.
Leading Players in the Neurostimulation Devices Industry Sector
- Neuronetics
- Medtronic
- NeuroPace Inc
- Nevro Corp
- Synapse Biomedical Inc
- LivaNova PLC
- Abbott
- Curonix LLC
- Boston Scientific Corporation
- Aleva Neurotherapeutics
Key Milestones in Neurostimulation Devices Industry Industry
May 2023: Abbott received FDA approval for its spinal cord stimulation (SCS) systems for treating non-surgical chronic back pain. This significantly expands the addressable market for Abbott's SCS products.
January 2023: Axonics, Inc. received FDA approval for its fourth-generation rechargeable sacral neuromodulation system. This represents a significant advancement in rechargeable technology, improving patient convenience and reducing the need for surgical revisions.
Strategic Outlook for Neurostimulation Devices Market
The neurostimulation devices market is poised for continued strong growth, driven by technological advancements, expanding applications, and increasing prevalence of neurological disorders. Companies focusing on innovation, strategic partnerships, and effective market penetration strategies will be well-positioned to capitalize on this growth. The development of minimally invasive procedures, closed-loop systems, and personalized therapies will shape the future of neurostimulation, driving greater adoption and improving patient outcomes. Expansion into emerging markets and exploring new applications will be key to unlocking the full market potential.
Neurostimulation Devices Industry Segmentation
-
1. Device Type
-
1.1. Implantable Devices
- 1.1.1. Spinal Cord Stimulators
- 1.1.2. Deep Brain Stimulators
- 1.1.3. Sacral Nerve Stimulators
- 1.1.4. Vagus Nerve Stimulators
- 1.1.5. Gastric Electric Stimulators
- 1.1.6. Other Device Types
-
1.2. External Devices
- 1.2.1. Transcranial Magnetic Stimulation (TMS)
- 1.2.2. Transcutaneous Electrical Nerve Stimulation (TENS)
- 1.2.3. Other External Devices
-
1.1. Implantable Devices
-
2. Application
- 2.1. Parkinson's Disease
- 2.2. Epilepsy
- 2.3. Depression
- 2.4. Dystonia
- 2.5. Pain Management
- 2.6. Other Applications
-
3. End-Users
- 3.1. Clinics
- 3.2. Hospitals
- 3.3. Rehabilitation Centers
Neurostimulation Devices Industry Segmentation By Geography
-
1. North America
- 1.1. United States
- 1.2. Canada
- 1.3. Mexico
-
2. Europe
- 2.1. Germany
- 2.2. United Kingdom
- 2.3. France
- 2.4. Italy
- 2.5. Spain
- 2.6. Rest of Europe
-
3. Asia Pacific
- 3.1. China
- 3.2. Japan
- 3.3. India
- 3.4. Australia
- 3.5. South Korea
- 3.6. Rest of Asia Pacific
-
4. Middle East and Africa
- 4.1. GCC
- 4.2. South Africa
- 4.3. Rest of Middle East and Africa
-
5. South America
- 5.1. Brazil
- 5.2. Argentina
- 5.3. Rest of South America
Neurostimulation Devices Industry Regional Market Share
Geographic Coverage of Neurostimulation Devices Industry
Neurostimulation Devices Industry REPORT HIGHLIGHTS
| Aspects | Details |
|---|---|
| Study Period | 2020-2034 |
| Base Year | 2025 |
| Estimated Year | 2026 |
| Forecast Period | 2026-2034 |
| Historical Period | 2020-2025 |
| Growth Rate | CAGR of 12.50% from 2020-2034 |
| Segmentation |
|
Table of Contents
- 1. Introduction
- 1.1. Research Scope
- 1.2. Market Segmentation
- 1.3. Research Methodology
- 1.4. Definitions and Assumptions
- 2. Executive Summary
- 2.1. Introduction
- 3. Market Dynamics
- 3.1. Introduction
- 3.2. Market Drivers
- 3.2.1. Rise in Prevalence of Neurological Disorders; Technological Advancements in Neurostimulation Devices
- 3.3. Market Restrains
- 3.3.1. Complications Associated with Neurostimulation Devices; Stringent Device Approval Regulations
- 3.4. Market Trends
- 3.4.1. Spinal Cord Stimulator is Expected to Dominate the Market During the Forecast Period
- 4. Market Factor Analysis
- 4.1. Porters Five Forces
- 4.2. Supply/Value Chain
- 4.3. PESTEL analysis
- 4.4. Market Entropy
- 4.5. Patent/Trademark Analysis
- 5. Global Neurostimulation Devices Industry Analysis, Insights and Forecast, 2020-2032
- 5.1. Market Analysis, Insights and Forecast - by Device Type
- 5.1.1. Implantable Devices
- 5.1.1.1. Spinal Cord Stimulators
- 5.1.1.2. Deep Brain Stimulators
- 5.1.1.3. Sacral Nerve Stimulators
- 5.1.1.4. Vagus Nerve Stimulators
- 5.1.1.5. Gastric Electric Stimulators
- 5.1.1.6. Other Device Types
- 5.1.2. External Devices
- 5.1.2.1. Transcranial Magnetic Stimulation (TMS)
- 5.1.2.2. Transcutaneous Electrical Nerve Stimulation (TENS)
- 5.1.2.3. Other External Devices
- 5.1.1. Implantable Devices
- 5.2. Market Analysis, Insights and Forecast - by Application
- 5.2.1. Parkinson's Disease
- 5.2.2. Epilepsy
- 5.2.3. Depression
- 5.2.4. Dystonia
- 5.2.5. Pain Management
- 5.2.6. Other Applications
- 5.3. Market Analysis, Insights and Forecast - by End-Users
- 5.3.1. Clinics
- 5.3.2. Hospitals
- 5.3.3. Rehabilitation Centers
- 5.4. Market Analysis, Insights and Forecast - by Region
- 5.4.1. North America
- 5.4.2. Europe
- 5.4.3. Asia Pacific
- 5.4.4. Middle East and Africa
- 5.4.5. South America
- 5.1. Market Analysis, Insights and Forecast - by Device Type
- 6. North America Neurostimulation Devices Industry Analysis, Insights and Forecast, 2020-2032
- 6.1. Market Analysis, Insights and Forecast - by Device Type
- 6.1.1. Implantable Devices
- 6.1.1.1. Spinal Cord Stimulators
- 6.1.1.2. Deep Brain Stimulators
- 6.1.1.3. Sacral Nerve Stimulators
- 6.1.1.4. Vagus Nerve Stimulators
- 6.1.1.5. Gastric Electric Stimulators
- 6.1.1.6. Other Device Types
- 6.1.2. External Devices
- 6.1.2.1. Transcranial Magnetic Stimulation (TMS)
- 6.1.2.2. Transcutaneous Electrical Nerve Stimulation (TENS)
- 6.1.2.3. Other External Devices
- 6.1.1. Implantable Devices
- 6.2. Market Analysis, Insights and Forecast - by Application
- 6.2.1. Parkinson's Disease
- 6.2.2. Epilepsy
- 6.2.3. Depression
- 6.2.4. Dystonia
- 6.2.5. Pain Management
- 6.2.6. Other Applications
- 6.3. Market Analysis, Insights and Forecast - by End-Users
- 6.3.1. Clinics
- 6.3.2. Hospitals
- 6.3.3. Rehabilitation Centers
- 6.1. Market Analysis, Insights and Forecast - by Device Type
- 7. Europe Neurostimulation Devices Industry Analysis, Insights and Forecast, 2020-2032
- 7.1. Market Analysis, Insights and Forecast - by Device Type
- 7.1.1. Implantable Devices
- 7.1.1.1. Spinal Cord Stimulators
- 7.1.1.2. Deep Brain Stimulators
- 7.1.1.3. Sacral Nerve Stimulators
- 7.1.1.4. Vagus Nerve Stimulators
- 7.1.1.5. Gastric Electric Stimulators
- 7.1.1.6. Other Device Types
- 7.1.2. External Devices
- 7.1.2.1. Transcranial Magnetic Stimulation (TMS)
- 7.1.2.2. Transcutaneous Electrical Nerve Stimulation (TENS)
- 7.1.2.3. Other External Devices
- 7.1.1. Implantable Devices
- 7.2. Market Analysis, Insights and Forecast - by Application
- 7.2.1. Parkinson's Disease
- 7.2.2. Epilepsy
- 7.2.3. Depression
- 7.2.4. Dystonia
- 7.2.5. Pain Management
- 7.2.6. Other Applications
- 7.3. Market Analysis, Insights and Forecast - by End-Users
- 7.3.1. Clinics
- 7.3.2. Hospitals
- 7.3.3. Rehabilitation Centers
- 7.1. Market Analysis, Insights and Forecast - by Device Type
- 8. Asia Pacific Neurostimulation Devices Industry Analysis, Insights and Forecast, 2020-2032
- 8.1. Market Analysis, Insights and Forecast - by Device Type
- 8.1.1. Implantable Devices
- 8.1.1.1. Spinal Cord Stimulators
- 8.1.1.2. Deep Brain Stimulators
- 8.1.1.3. Sacral Nerve Stimulators
- 8.1.1.4. Vagus Nerve Stimulators
- 8.1.1.5. Gastric Electric Stimulators
- 8.1.1.6. Other Device Types
- 8.1.2. External Devices
- 8.1.2.1. Transcranial Magnetic Stimulation (TMS)
- 8.1.2.2. Transcutaneous Electrical Nerve Stimulation (TENS)
- 8.1.2.3. Other External Devices
- 8.1.1. Implantable Devices
- 8.2. Market Analysis, Insights and Forecast - by Application
- 8.2.1. Parkinson's Disease
- 8.2.2. Epilepsy
- 8.2.3. Depression
- 8.2.4. Dystonia
- 8.2.5. Pain Management
- 8.2.6. Other Applications
- 8.3. Market Analysis, Insights and Forecast - by End-Users
- 8.3.1. Clinics
- 8.3.2. Hospitals
- 8.3.3. Rehabilitation Centers
- 8.1. Market Analysis, Insights and Forecast - by Device Type
- 9. Middle East and Africa Neurostimulation Devices Industry Analysis, Insights and Forecast, 2020-2032
- 9.1. Market Analysis, Insights and Forecast - by Device Type
- 9.1.1. Implantable Devices
- 9.1.1.1. Spinal Cord Stimulators
- 9.1.1.2. Deep Brain Stimulators
- 9.1.1.3. Sacral Nerve Stimulators
- 9.1.1.4. Vagus Nerve Stimulators
- 9.1.1.5. Gastric Electric Stimulators
- 9.1.1.6. Other Device Types
- 9.1.2. External Devices
- 9.1.2.1. Transcranial Magnetic Stimulation (TMS)
- 9.1.2.2. Transcutaneous Electrical Nerve Stimulation (TENS)
- 9.1.2.3. Other External Devices
- 9.1.1. Implantable Devices
- 9.2. Market Analysis, Insights and Forecast - by Application
- 9.2.1. Parkinson's Disease
- 9.2.2. Epilepsy
- 9.2.3. Depression
- 9.2.4. Dystonia
- 9.2.5. Pain Management
- 9.2.6. Other Applications
- 9.3. Market Analysis, Insights and Forecast - by End-Users
- 9.3.1. Clinics
- 9.3.2. Hospitals
- 9.3.3. Rehabilitation Centers
- 9.1. Market Analysis, Insights and Forecast - by Device Type
- 10. South America Neurostimulation Devices Industry Analysis, Insights and Forecast, 2020-2032
- 10.1. Market Analysis, Insights and Forecast - by Device Type
- 10.1.1. Implantable Devices
- 10.1.1.1. Spinal Cord Stimulators
- 10.1.1.2. Deep Brain Stimulators
- 10.1.1.3. Sacral Nerve Stimulators
- 10.1.1.4. Vagus Nerve Stimulators
- 10.1.1.5. Gastric Electric Stimulators
- 10.1.1.6. Other Device Types
- 10.1.2. External Devices
- 10.1.2.1. Transcranial Magnetic Stimulation (TMS)
- 10.1.2.2. Transcutaneous Electrical Nerve Stimulation (TENS)
- 10.1.2.3. Other External Devices
- 10.1.1. Implantable Devices
- 10.2. Market Analysis, Insights and Forecast - by Application
- 10.2.1. Parkinson's Disease
- 10.2.2. Epilepsy
- 10.2.3. Depression
- 10.2.4. Dystonia
- 10.2.5. Pain Management
- 10.2.6. Other Applications
- 10.3. Market Analysis, Insights and Forecast - by End-Users
- 10.3.1. Clinics
- 10.3.2. Hospitals
- 10.3.3. Rehabilitation Centers
- 10.1. Market Analysis, Insights and Forecast - by Device Type
- 11. Competitive Analysis
- 11.1. Global Market Share Analysis 2025
- 11.2. Company Profiles
- 11.2.1 Neuronetics
- 11.2.1.1. Overview
- 11.2.1.2. Products
- 11.2.1.3. SWOT Analysis
- 11.2.1.4. Recent Developments
- 11.2.1.5. Financials (Based on Availability)
- 11.2.2 Medtronic
- 11.2.2.1. Overview
- 11.2.2.2. Products
- 11.2.2.3. SWOT Analysis
- 11.2.2.4. Recent Developments
- 11.2.2.5. Financials (Based on Availability)
- 11.2.3 NeuroPace Inc
- 11.2.3.1. Overview
- 11.2.3.2. Products
- 11.2.3.3. SWOT Analysis
- 11.2.3.4. Recent Developments
- 11.2.3.5. Financials (Based on Availability)
- 11.2.4 Nevro Corp
- 11.2.4.1. Overview
- 11.2.4.2. Products
- 11.2.4.3. SWOT Analysis
- 11.2.4.4. Recent Developments
- 11.2.4.5. Financials (Based on Availability)
- 11.2.5 Synapse Biomedical Inc
- 11.2.5.1. Overview
- 11.2.5.2. Products
- 11.2.5.3. SWOT Analysis
- 11.2.5.4. Recent Developments
- 11.2.5.5. Financials (Based on Availability)
- 11.2.6 LivaNova PLC
- 11.2.6.1. Overview
- 11.2.6.2. Products
- 11.2.6.3. SWOT Analysis
- 11.2.6.4. Recent Developments
- 11.2.6.5. Financials (Based on Availability)
- 11.2.7 Abbott
- 11.2.7.1. Overview
- 11.2.7.2. Products
- 11.2.7.3. SWOT Analysis
- 11.2.7.4. Recent Developments
- 11.2.7.5. Financials (Based on Availability)
- 11.2.8 Curonix LLC
- 11.2.8.1. Overview
- 11.2.8.2. Products
- 11.2.8.3. SWOT Analysis
- 11.2.8.4. Recent Developments
- 11.2.8.5. Financials (Based on Availability)
- 11.2.9 Boston Scientific Corporation
- 11.2.9.1. Overview
- 11.2.9.2. Products
- 11.2.9.3. SWOT Analysis
- 11.2.9.4. Recent Developments
- 11.2.9.5. Financials (Based on Availability)
- 11.2.10 Aleva Neurotherapeutics
- 11.2.10.1. Overview
- 11.2.10.2. Products
- 11.2.10.3. SWOT Analysis
- 11.2.10.4. Recent Developments
- 11.2.10.5. Financials (Based on Availability)
- 11.2.1 Neuronetics
List of Figures
- Figure 1: Global Neurostimulation Devices Industry Revenue Breakdown (Million, %) by Region 2025 & 2033
- Figure 2: Global Neurostimulation Devices Industry Volume Breakdown (K Unit, %) by Region 2025 & 2033
- Figure 3: North America Neurostimulation Devices Industry Revenue (Million), by Device Type 2025 & 2033
- Figure 4: North America Neurostimulation Devices Industry Volume (K Unit), by Device Type 2025 & 2033
- Figure 5: North America Neurostimulation Devices Industry Revenue Share (%), by Device Type 2025 & 2033
- Figure 6: North America Neurostimulation Devices Industry Volume Share (%), by Device Type 2025 & 2033
- Figure 7: North America Neurostimulation Devices Industry Revenue (Million), by Application 2025 & 2033
- Figure 8: North America Neurostimulation Devices Industry Volume (K Unit), by Application 2025 & 2033
- Figure 9: North America Neurostimulation Devices Industry Revenue Share (%), by Application 2025 & 2033
- Figure 10: North America Neurostimulation Devices Industry Volume Share (%), by Application 2025 & 2033
- Figure 11: North America Neurostimulation Devices Industry Revenue (Million), by End-Users 2025 & 2033
- Figure 12: North America Neurostimulation Devices Industry Volume (K Unit), by End-Users 2025 & 2033
- Figure 13: North America Neurostimulation Devices Industry Revenue Share (%), by End-Users 2025 & 2033
- Figure 14: North America Neurostimulation Devices Industry Volume Share (%), by End-Users 2025 & 2033
- Figure 15: North America Neurostimulation Devices Industry Revenue (Million), by Country 2025 & 2033
- Figure 16: North America Neurostimulation Devices Industry Volume (K Unit), by Country 2025 & 2033
- Figure 17: North America Neurostimulation Devices Industry Revenue Share (%), by Country 2025 & 2033
- Figure 18: North America Neurostimulation Devices Industry Volume Share (%), by Country 2025 & 2033
- Figure 19: Europe Neurostimulation Devices Industry Revenue (Million), by Device Type 2025 & 2033
- Figure 20: Europe Neurostimulation Devices Industry Volume (K Unit), by Device Type 2025 & 2033
- Figure 21: Europe Neurostimulation Devices Industry Revenue Share (%), by Device Type 2025 & 2033
- Figure 22: Europe Neurostimulation Devices Industry Volume Share (%), by Device Type 2025 & 2033
- Figure 23: Europe Neurostimulation Devices Industry Revenue (Million), by Application 2025 & 2033
- Figure 24: Europe Neurostimulation Devices Industry Volume (K Unit), by Application 2025 & 2033
- Figure 25: Europe Neurostimulation Devices Industry Revenue Share (%), by Application 2025 & 2033
- Figure 26: Europe Neurostimulation Devices Industry Volume Share (%), by Application 2025 & 2033
- Figure 27: Europe Neurostimulation Devices Industry Revenue (Million), by End-Users 2025 & 2033
- Figure 28: Europe Neurostimulation Devices Industry Volume (K Unit), by End-Users 2025 & 2033
- Figure 29: Europe Neurostimulation Devices Industry Revenue Share (%), by End-Users 2025 & 2033
- Figure 30: Europe Neurostimulation Devices Industry Volume Share (%), by End-Users 2025 & 2033
- Figure 31: Europe Neurostimulation Devices Industry Revenue (Million), by Country 2025 & 2033
- Figure 32: Europe Neurostimulation Devices Industry Volume (K Unit), by Country 2025 & 2033
- Figure 33: Europe Neurostimulation Devices Industry Revenue Share (%), by Country 2025 & 2033
- Figure 34: Europe Neurostimulation Devices Industry Volume Share (%), by Country 2025 & 2033
- Figure 35: Asia Pacific Neurostimulation Devices Industry Revenue (Million), by Device Type 2025 & 2033
- Figure 36: Asia Pacific Neurostimulation Devices Industry Volume (K Unit), by Device Type 2025 & 2033
- Figure 37: Asia Pacific Neurostimulation Devices Industry Revenue Share (%), by Device Type 2025 & 2033
- Figure 38: Asia Pacific Neurostimulation Devices Industry Volume Share (%), by Device Type 2025 & 2033
- Figure 39: Asia Pacific Neurostimulation Devices Industry Revenue (Million), by Application 2025 & 2033
- Figure 40: Asia Pacific Neurostimulation Devices Industry Volume (K Unit), by Application 2025 & 2033
- Figure 41: Asia Pacific Neurostimulation Devices Industry Revenue Share (%), by Application 2025 & 2033
- Figure 42: Asia Pacific Neurostimulation Devices Industry Volume Share (%), by Application 2025 & 2033
- Figure 43: Asia Pacific Neurostimulation Devices Industry Revenue (Million), by End-Users 2025 & 2033
- Figure 44: Asia Pacific Neurostimulation Devices Industry Volume (K Unit), by End-Users 2025 & 2033
- Figure 45: Asia Pacific Neurostimulation Devices Industry Revenue Share (%), by End-Users 2025 & 2033
- Figure 46: Asia Pacific Neurostimulation Devices Industry Volume Share (%), by End-Users 2025 & 2033
- Figure 47: Asia Pacific Neurostimulation Devices Industry Revenue (Million), by Country 2025 & 2033
- Figure 48: Asia Pacific Neurostimulation Devices Industry Volume (K Unit), by Country 2025 & 2033
- Figure 49: Asia Pacific Neurostimulation Devices Industry Revenue Share (%), by Country 2025 & 2033
- Figure 50: Asia Pacific Neurostimulation Devices Industry Volume Share (%), by Country 2025 & 2033
- Figure 51: Middle East and Africa Neurostimulation Devices Industry Revenue (Million), by Device Type 2025 & 2033
- Figure 52: Middle East and Africa Neurostimulation Devices Industry Volume (K Unit), by Device Type 2025 & 2033
- Figure 53: Middle East and Africa Neurostimulation Devices Industry Revenue Share (%), by Device Type 2025 & 2033
- Figure 54: Middle East and Africa Neurostimulation Devices Industry Volume Share (%), by Device Type 2025 & 2033
- Figure 55: Middle East and Africa Neurostimulation Devices Industry Revenue (Million), by Application 2025 & 2033
- Figure 56: Middle East and Africa Neurostimulation Devices Industry Volume (K Unit), by Application 2025 & 2033
- Figure 57: Middle East and Africa Neurostimulation Devices Industry Revenue Share (%), by Application 2025 & 2033
- Figure 58: Middle East and Africa Neurostimulation Devices Industry Volume Share (%), by Application 2025 & 2033
- Figure 59: Middle East and Africa Neurostimulation Devices Industry Revenue (Million), by End-Users 2025 & 2033
- Figure 60: Middle East and Africa Neurostimulation Devices Industry Volume (K Unit), by End-Users 2025 & 2033
- Figure 61: Middle East and Africa Neurostimulation Devices Industry Revenue Share (%), by End-Users 2025 & 2033
- Figure 62: Middle East and Africa Neurostimulation Devices Industry Volume Share (%), by End-Users 2025 & 2033
- Figure 63: Middle East and Africa Neurostimulation Devices Industry Revenue (Million), by Country 2025 & 2033
- Figure 64: Middle East and Africa Neurostimulation Devices Industry Volume (K Unit), by Country 2025 & 2033
- Figure 65: Middle East and Africa Neurostimulation Devices Industry Revenue Share (%), by Country 2025 & 2033
- Figure 66: Middle East and Africa Neurostimulation Devices Industry Volume Share (%), by Country 2025 & 2033
- Figure 67: South America Neurostimulation Devices Industry Revenue (Million), by Device Type 2025 & 2033
- Figure 68: South America Neurostimulation Devices Industry Volume (K Unit), by Device Type 2025 & 2033
- Figure 69: South America Neurostimulation Devices Industry Revenue Share (%), by Device Type 2025 & 2033
- Figure 70: South America Neurostimulation Devices Industry Volume Share (%), by Device Type 2025 & 2033
- Figure 71: South America Neurostimulation Devices Industry Revenue (Million), by Application 2025 & 2033
- Figure 72: South America Neurostimulation Devices Industry Volume (K Unit), by Application 2025 & 2033
- Figure 73: South America Neurostimulation Devices Industry Revenue Share (%), by Application 2025 & 2033
- Figure 74: South America Neurostimulation Devices Industry Volume Share (%), by Application 2025 & 2033
- Figure 75: South America Neurostimulation Devices Industry Revenue (Million), by End-Users 2025 & 2033
- Figure 76: South America Neurostimulation Devices Industry Volume (K Unit), by End-Users 2025 & 2033
- Figure 77: South America Neurostimulation Devices Industry Revenue Share (%), by End-Users 2025 & 2033
- Figure 78: South America Neurostimulation Devices Industry Volume Share (%), by End-Users 2025 & 2033
- Figure 79: South America Neurostimulation Devices Industry Revenue (Million), by Country 2025 & 2033
- Figure 80: South America Neurostimulation Devices Industry Volume (K Unit), by Country 2025 & 2033
- Figure 81: South America Neurostimulation Devices Industry Revenue Share (%), by Country 2025 & 2033
- Figure 82: South America Neurostimulation Devices Industry Volume Share (%), by Country 2025 & 2033
List of Tables
- Table 1: Global Neurostimulation Devices Industry Revenue Million Forecast, by Device Type 2020 & 2033
- Table 2: Global Neurostimulation Devices Industry Volume K Unit Forecast, by Device Type 2020 & 2033
- Table 3: Global Neurostimulation Devices Industry Revenue Million Forecast, by Application 2020 & 2033
- Table 4: Global Neurostimulation Devices Industry Volume K Unit Forecast, by Application 2020 & 2033
- Table 5: Global Neurostimulation Devices Industry Revenue Million Forecast, by End-Users 2020 & 2033
- Table 6: Global Neurostimulation Devices Industry Volume K Unit Forecast, by End-Users 2020 & 2033
- Table 7: Global Neurostimulation Devices Industry Revenue Million Forecast, by Region 2020 & 2033
- Table 8: Global Neurostimulation Devices Industry Volume K Unit Forecast, by Region 2020 & 2033
- Table 9: Global Neurostimulation Devices Industry Revenue Million Forecast, by Device Type 2020 & 2033
- Table 10: Global Neurostimulation Devices Industry Volume K Unit Forecast, by Device Type 2020 & 2033
- Table 11: Global Neurostimulation Devices Industry Revenue Million Forecast, by Application 2020 & 2033
- Table 12: Global Neurostimulation Devices Industry Volume K Unit Forecast, by Application 2020 & 2033
- Table 13: Global Neurostimulation Devices Industry Revenue Million Forecast, by End-Users 2020 & 2033
- Table 14: Global Neurostimulation Devices Industry Volume K Unit Forecast, by End-Users 2020 & 2033
- Table 15: Global Neurostimulation Devices Industry Revenue Million Forecast, by Country 2020 & 2033
- Table 16: Global Neurostimulation Devices Industry Volume K Unit Forecast, by Country 2020 & 2033
- Table 17: United States Neurostimulation Devices Industry Revenue (Million) Forecast, by Application 2020 & 2033
- Table 18: United States Neurostimulation Devices Industry Volume (K Unit) Forecast, by Application 2020 & 2033
- Table 19: Canada Neurostimulation Devices Industry Revenue (Million) Forecast, by Application 2020 & 2033
- Table 20: Canada Neurostimulation Devices Industry Volume (K Unit) Forecast, by Application 2020 & 2033
- Table 21: Mexico Neurostimulation Devices Industry Revenue (Million) Forecast, by Application 2020 & 2033
- Table 22: Mexico Neurostimulation Devices Industry Volume (K Unit) Forecast, by Application 2020 & 2033
- Table 23: Global Neurostimulation Devices Industry Revenue Million Forecast, by Device Type 2020 & 2033
- Table 24: Global Neurostimulation Devices Industry Volume K Unit Forecast, by Device Type 2020 & 2033
- Table 25: Global Neurostimulation Devices Industry Revenue Million Forecast, by Application 2020 & 2033
- Table 26: Global Neurostimulation Devices Industry Volume K Unit Forecast, by Application 2020 & 2033
- Table 27: Global Neurostimulation Devices Industry Revenue Million Forecast, by End-Users 2020 & 2033
- Table 28: Global Neurostimulation Devices Industry Volume K Unit Forecast, by End-Users 2020 & 2033
- Table 29: Global Neurostimulation Devices Industry Revenue Million Forecast, by Country 2020 & 2033
- Table 30: Global Neurostimulation Devices Industry Volume K Unit Forecast, by Country 2020 & 2033
- Table 31: Germany Neurostimulation Devices Industry Revenue (Million) Forecast, by Application 2020 & 2033
- Table 32: Germany Neurostimulation Devices Industry Volume (K Unit) Forecast, by Application 2020 & 2033
- Table 33: United Kingdom Neurostimulation Devices Industry Revenue (Million) Forecast, by Application 2020 & 2033
- Table 34: United Kingdom Neurostimulation Devices Industry Volume (K Unit) Forecast, by Application 2020 & 2033
- Table 35: France Neurostimulation Devices Industry Revenue (Million) Forecast, by Application 2020 & 2033
- Table 36: France Neurostimulation Devices Industry Volume (K Unit) Forecast, by Application 2020 & 2033
- Table 37: Italy Neurostimulation Devices Industry Revenue (Million) Forecast, by Application 2020 & 2033
- Table 38: Italy Neurostimulation Devices Industry Volume (K Unit) Forecast, by Application 2020 & 2033
- Table 39: Spain Neurostimulation Devices Industry Revenue (Million) Forecast, by Application 2020 & 2033
- Table 40: Spain Neurostimulation Devices Industry Volume (K Unit) Forecast, by Application 2020 & 2033
- Table 41: Rest of Europe Neurostimulation Devices Industry Revenue (Million) Forecast, by Application 2020 & 2033
- Table 42: Rest of Europe Neurostimulation Devices Industry Volume (K Unit) Forecast, by Application 2020 & 2033
- Table 43: Global Neurostimulation Devices Industry Revenue Million Forecast, by Device Type 2020 & 2033
- Table 44: Global Neurostimulation Devices Industry Volume K Unit Forecast, by Device Type 2020 & 2033
- Table 45: Global Neurostimulation Devices Industry Revenue Million Forecast, by Application 2020 & 2033
- Table 46: Global Neurostimulation Devices Industry Volume K Unit Forecast, by Application 2020 & 2033
- Table 47: Global Neurostimulation Devices Industry Revenue Million Forecast, by End-Users 2020 & 2033
- Table 48: Global Neurostimulation Devices Industry Volume K Unit Forecast, by End-Users 2020 & 2033
- Table 49: Global Neurostimulation Devices Industry Revenue Million Forecast, by Country 2020 & 2033
- Table 50: Global Neurostimulation Devices Industry Volume K Unit Forecast, by Country 2020 & 2033
- Table 51: China Neurostimulation Devices Industry Revenue (Million) Forecast, by Application 2020 & 2033
- Table 52: China Neurostimulation Devices Industry Volume (K Unit) Forecast, by Application 2020 & 2033
- Table 53: Japan Neurostimulation Devices Industry Revenue (Million) Forecast, by Application 2020 & 2033
- Table 54: Japan Neurostimulation Devices Industry Volume (K Unit) Forecast, by Application 2020 & 2033
- Table 55: India Neurostimulation Devices Industry Revenue (Million) Forecast, by Application 2020 & 2033
- Table 56: India Neurostimulation Devices Industry Volume (K Unit) Forecast, by Application 2020 & 2033
- Table 57: Australia Neurostimulation Devices Industry Revenue (Million) Forecast, by Application 2020 & 2033
- Table 58: Australia Neurostimulation Devices Industry Volume (K Unit) Forecast, by Application 2020 & 2033
- Table 59: South Korea Neurostimulation Devices Industry Revenue (Million) Forecast, by Application 2020 & 2033
- Table 60: South Korea Neurostimulation Devices Industry Volume (K Unit) Forecast, by Application 2020 & 2033
- Table 61: Rest of Asia Pacific Neurostimulation Devices Industry Revenue (Million) Forecast, by Application 2020 & 2033
- Table 62: Rest of Asia Pacific Neurostimulation Devices Industry Volume (K Unit) Forecast, by Application 2020 & 2033
- Table 63: Global Neurostimulation Devices Industry Revenue Million Forecast, by Device Type 2020 & 2033
- Table 64: Global Neurostimulation Devices Industry Volume K Unit Forecast, by Device Type 2020 & 2033
- Table 65: Global Neurostimulation Devices Industry Revenue Million Forecast, by Application 2020 & 2033
- Table 66: Global Neurostimulation Devices Industry Volume K Unit Forecast, by Application 2020 & 2033
- Table 67: Global Neurostimulation Devices Industry Revenue Million Forecast, by End-Users 2020 & 2033
- Table 68: Global Neurostimulation Devices Industry Volume K Unit Forecast, by End-Users 2020 & 2033
- Table 69: Global Neurostimulation Devices Industry Revenue Million Forecast, by Country 2020 & 2033
- Table 70: Global Neurostimulation Devices Industry Volume K Unit Forecast, by Country 2020 & 2033
- Table 71: GCC Neurostimulation Devices Industry Revenue (Million) Forecast, by Application 2020 & 2033
- Table 72: GCC Neurostimulation Devices Industry Volume (K Unit) Forecast, by Application 2020 & 2033
- Table 73: South Africa Neurostimulation Devices Industry Revenue (Million) Forecast, by Application 2020 & 2033
- Table 74: South Africa Neurostimulation Devices Industry Volume (K Unit) Forecast, by Application 2020 & 2033
- Table 75: Rest of Middle East and Africa Neurostimulation Devices Industry Revenue (Million) Forecast, by Application 2020 & 2033
- Table 76: Rest of Middle East and Africa Neurostimulation Devices Industry Volume (K Unit) Forecast, by Application 2020 & 2033
- Table 77: Global Neurostimulation Devices Industry Revenue Million Forecast, by Device Type 2020 & 2033
- Table 78: Global Neurostimulation Devices Industry Volume K Unit Forecast, by Device Type 2020 & 2033
- Table 79: Global Neurostimulation Devices Industry Revenue Million Forecast, by Application 2020 & 2033
- Table 80: Global Neurostimulation Devices Industry Volume K Unit Forecast, by Application 2020 & 2033
- Table 81: Global Neurostimulation Devices Industry Revenue Million Forecast, by End-Users 2020 & 2033
- Table 82: Global Neurostimulation Devices Industry Volume K Unit Forecast, by End-Users 2020 & 2033
- Table 83: Global Neurostimulation Devices Industry Revenue Million Forecast, by Country 2020 & 2033
- Table 84: Global Neurostimulation Devices Industry Volume K Unit Forecast, by Country 2020 & 2033
- Table 85: Brazil Neurostimulation Devices Industry Revenue (Million) Forecast, by Application 2020 & 2033
- Table 86: Brazil Neurostimulation Devices Industry Volume (K Unit) Forecast, by Application 2020 & 2033
- Table 87: Argentina Neurostimulation Devices Industry Revenue (Million) Forecast, by Application 2020 & 2033
- Table 88: Argentina Neurostimulation Devices Industry Volume (K Unit) Forecast, by Application 2020 & 2033
- Table 89: Rest of South America Neurostimulation Devices Industry Revenue (Million) Forecast, by Application 2020 & 2033
- Table 90: Rest of South America Neurostimulation Devices Industry Volume (K Unit) Forecast, by Application 2020 & 2033
Frequently Asked Questions
1. What is the projected Compound Annual Growth Rate (CAGR) of the Neurostimulation Devices Industry?
The projected CAGR is approximately 12.50%.
2. Which companies are prominent players in the Neurostimulation Devices Industry?
Key companies in the market include Neuronetics, Medtronic, NeuroPace Inc, Nevro Corp, Synapse Biomedical Inc , LivaNova PLC, Abbott, Curonix LLC, Boston Scientific Corporation, Aleva Neurotherapeutics.
3. What are the main segments of the Neurostimulation Devices Industry?
The market segments include Device Type, Application, End-Users.
4. Can you provide details about the market size?
The market size is estimated to be USD 8.21 Million as of 2022.
5. What are some drivers contributing to market growth?
Rise in Prevalence of Neurological Disorders; Technological Advancements in Neurostimulation Devices.
6. What are the notable trends driving market growth?
Spinal Cord Stimulator is Expected to Dominate the Market During the Forecast Period.
7. Are there any restraints impacting market growth?
Complications Associated with Neurostimulation Devices; Stringent Device Approval Regulations.
8. Can you provide examples of recent developments in the market?
May 2023: Abbott received FDA approval for its spinal cord stimulation (SCS) systems for treating chronic back pain in people who have not had or are not eligible to receive back surgery, known as non-surgical back pain. This new indication applies to all Abbott's SCS products in the United States, including the Eterna SCS platform and the Proclaim SCS family.
9. What pricing options are available for accessing the report?
Pricing options include single-user, multi-user, and enterprise licenses priced at USD 4750, USD 5250, and USD 8750 respectively.
10. Is the market size provided in terms of value or volume?
The market size is provided in terms of value, measured in Million and volume, measured in K Unit.
11. Are there any specific market keywords associated with the report?
Yes, the market keyword associated with the report is "Neurostimulation Devices Industry," which aids in identifying and referencing the specific market segment covered.
12. How do I determine which pricing option suits my needs best?
The pricing options vary based on user requirements and access needs. Individual users may opt for single-user licenses, while businesses requiring broader access may choose multi-user or enterprise licenses for cost-effective access to the report.
13. Are there any additional resources or data provided in the Neurostimulation Devices Industry report?
While the report offers comprehensive insights, it's advisable to review the specific contents or supplementary materials provided to ascertain if additional resources or data are available.
14. How can I stay updated on further developments or reports in the Neurostimulation Devices Industry?
To stay informed about further developments, trends, and reports in the Neurostimulation Devices Industry, consider subscribing to industry newsletters, following relevant companies and organizations, or regularly checking reputable industry news sources and publications.
Methodology
Step 1 - Identification of Relevant Samples Size from Population Database


Step 2 - Approaches for Defining Global Market Size (Value, Volume* & Price*)

Note*: In applicable scenarios
Step 3 - Data Sources
Primary Research
- Web Analytics
- Survey Reports
- Research Institute
- Latest Research Reports
- Opinion Leaders
Secondary Research
- Annual Reports
- White Paper
- Latest Press Release
- Industry Association
- Paid Database
- Investor Presentations

Step 4 - Data Triangulation
Involves using different sources of information in order to increase the validity of a study
These sources are likely to be stakeholders in a program - participants, other researchers, program staff, other community members, and so on.
Then we put all data in single framework & apply various statistical tools to find out the dynamic on the market.
During the analysis stage, feedback from the stakeholder groups would be compared to determine areas of agreement as well as areas of divergence