

Key Insights
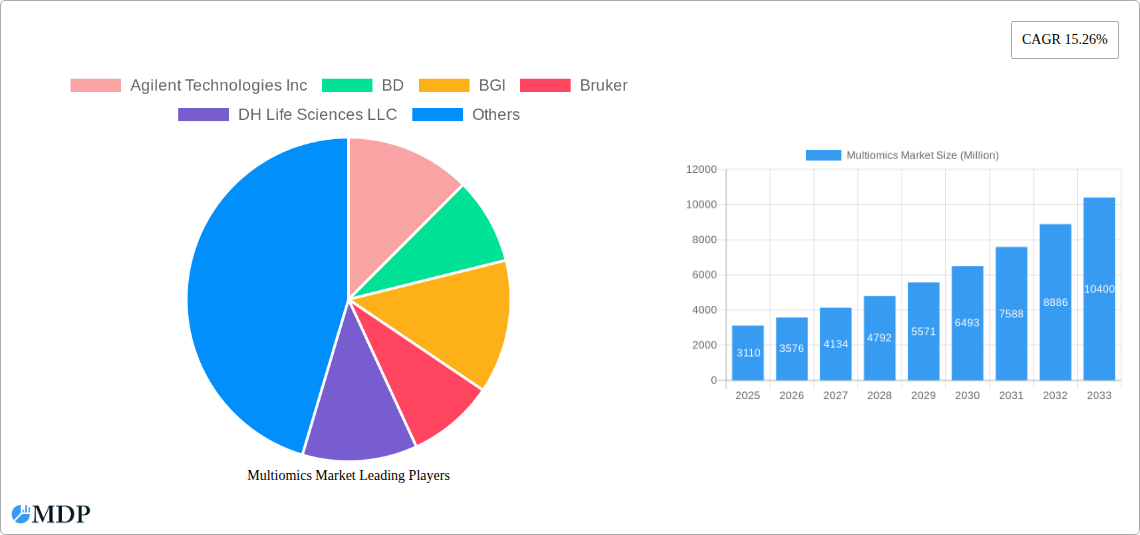
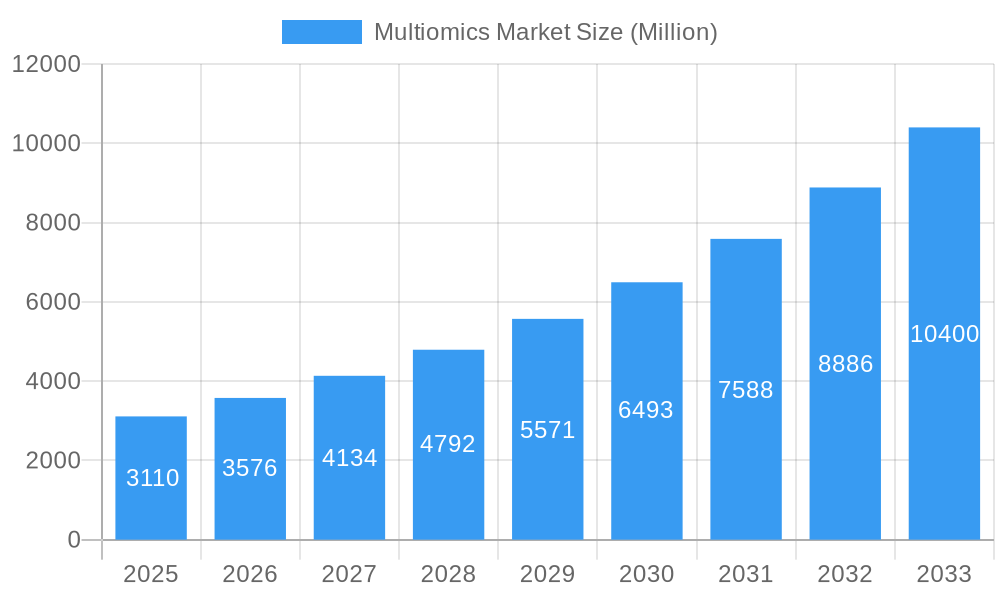
The multiomics market, valued at $3.11 billion in 2025, is experiencing robust growth, projected to expand at a compound annual growth rate (CAGR) of 15.26% from 2025 to 2033. This expansion is driven by several key factors. Advances in sequencing technologies are making multiomics analysis more accessible and affordable, enabling researchers to integrate data from multiple omics layers (genomics, transcriptomics, proteomics, metabolomics, etc.) for a more comprehensive understanding of biological systems. This integrated approach is proving invaluable in various fields, including drug discovery, personalized medicine, precision agriculture, and environmental monitoring. Furthermore, increasing government funding for research initiatives focused on genomics and related fields, coupled with the growing prevalence of chronic diseases requiring advanced diagnostic and therapeutic solutions, is fueling market demand. The rising adoption of cloud-based data storage and analysis platforms is also contributing to market growth by providing researchers with efficient and scalable solutions for managing the large datasets generated by multiomics studies.
Multiomics Market Market Size (In Billion)
Competition in the multiomics market is intense, with major players like Agilent Technologies, Illumina, Thermo Fisher Scientific, and QIAGEN dominating the landscape alongside emerging companies focused on innovative technologies and applications. The market is segmented by technology (e.g., next-generation sequencing, mass spectrometry, microarrays), application (e.g., drug discovery, diagnostics, agriculture), and region. While North America and Europe currently hold significant market share due to advanced research infrastructure and high healthcare spending, the Asia-Pacific region is poised for substantial growth driven by increasing investments in life sciences research and expanding healthcare infrastructure. Challenges such as the high cost of multiomics analysis and the complexity of data integration remain; however, ongoing technological advancements and the increasing availability of user-friendly analysis tools are expected to mitigate these barriers and contribute to further market expansion.
Multiomics Market Company Market Share
Multiomics Market Report: 2019-2033 Forecast - Unlocking the Power of Integrated Omics
This comprehensive report provides a detailed analysis of the Multiomics Market, offering actionable insights for industry stakeholders. From market dynamics and leading players to emerging opportunities and future forecasts, this report covers all aspects of this rapidly evolving sector. With a study period spanning 2019-2033, a base year of 2025, and an estimated year of 2025, this report provides a robust understanding of the current market landscape and future projections. The report's forecast period extends from 2025 to 2033, encompassing the historical period of 2019-2024. The Multiomics market is projected to reach xx Million by 2033, exhibiting a CAGR of xx% during the forecast period.
Multiomics Market Dynamics & Concentration
The Multiomics Market is characterized by a moderately concentrated landscape, with key players like Illumina Inc, Thermo Fisher Scientific Inc, and QIAGEN holding significant market share. However, the market also witnesses considerable innovation from smaller companies and startups, leading to a dynamic competitive environment. The market share distribution among the top 5 players is estimated at xx%, indicating a relatively fragmented market beyond the leading companies. Several factors influence market dynamics, including:
- Innovation Drivers: Rapid advancements in sequencing technologies, bioinformatics, and data analysis tools are fueling market growth. The development of novel multiomics platforms that integrate data from multiple omics layers (genomics, transcriptomics, proteomics, metabolomics) is a key driver.
- Regulatory Frameworks: Regulatory approvals and guidelines for multiomics applications, particularly in healthcare and diagnostics, significantly impact market expansion. Stringent regulations can create barriers to entry but also ensure safety and efficacy.
- Product Substitutes: While there aren't direct substitutes for multiomics technologies, alternative approaches like single-omics analyses could potentially limit market growth in specific applications. However, the inherent advantages of multiomics in providing a holistic view often outweigh these alternatives.
- End-User Trends: Growing demand for personalized medicine, precision diagnostics, and disease prevention is driving adoption of multiomics technologies across diverse sectors, including pharmaceuticals, healthcare, and agriculture.
- M&A Activities: The market has witnessed a notable number of mergers and acquisitions (M&A) in recent years, with approximately xx M&A deals concluded in the historical period (2019-2024). These activities reflect strategic efforts by companies to expand their product portfolios, technological capabilities, and market reach.
Multiomics Market Industry Trends & Analysis
The Multiomics market is experiencing robust growth, driven by several key trends. Technological disruptions, such as advancements in next-generation sequencing (NGS) and mass spectrometry, are lowering costs and increasing throughput, making multiomics analysis more accessible. This has led to a significant increase in market penetration across various applications. The increasing availability of large-scale genomic databases and bioinformatics tools further facilitates data analysis and interpretation. Consumer preferences for personalized healthcare solutions are also influencing market growth, with increased demand for tailored diagnostic and therapeutic approaches. Competitive dynamics are shaping market trends, with established players investing heavily in R&D to develop innovative multiomics platforms, while emerging companies are focusing on niche applications and innovative data analysis methods. The market's CAGR during the forecast period is estimated to be xx%, reflecting the strong growth momentum. Market penetration in key areas such as oncology and drug discovery is also expected to increase significantly, reaching an estimated xx% by 2033.
Leading Markets & Segments in Multiomics Market
The North American region currently dominates the Multiomics Market, accounting for approximately xx% of the global market share in 2025. This dominance is attributed to several key drivers:
- Strong R&D Infrastructure: Significant investments in research and development, particularly in the life sciences and healthcare sectors, have propelled technological innovation and market growth.
- High Healthcare Spending: Higher per capita healthcare spending enables greater adoption of advanced diagnostic and therapeutic tools, including multiomics technologies.
- Favorable Regulatory Environment: A relatively supportive regulatory environment encourages the development and commercialization of innovative healthcare technologies.
Other regions, such as Europe and Asia-Pacific, are also exhibiting significant growth potential, driven by increasing healthcare expenditure, technological advancements, and government initiatives promoting personalized medicine. The oncology segment holds a significant market share, followed by the pharmaceutical and agricultural sectors. The dominance of North America is expected to persist during the forecast period, although other regions will experience faster growth rates.
Multiomics Market Product Developments
Recent product innovations in the multiomics market include the development of integrated platforms that combine different omics technologies, enabling simultaneous analysis of multiple data types. This approach streamlines workflows, reduces costs, and allows for more comprehensive data analysis. Furthermore, advancements in bioinformatics and data analysis software have improved the interpretation and visualization of complex multiomics data, leading to more accurate and meaningful insights. These innovations address the market need for efficient and comprehensive analysis methods, giving them a significant competitive advantage. New applications are also emerging across drug discovery, biomarker development and precision medicine.
Key Drivers of Multiomics Market Growth
Several key factors are driving the growth of the multiomics market:
- Technological Advancements: Continuous advancements in sequencing technologies, mass spectrometry, and bioinformatics are driving down costs and improving the speed and accuracy of multiomics analysis. The development of new platforms enabling integration of various omics data is also a significant driver.
- Economic Factors: Increasing healthcare expenditure globally and a growing focus on personalized medicine are driving demand for multiomics technologies in drug development, diagnostics, and disease management.
- Regulatory Support: Government initiatives and regulatory approvals for multiomics-based diagnostic tests and therapies are fostering market growth. For example, increasing support for personalized medicine initiatives.
Challenges in the Multiomics Market
Several challenges hinder the growth of the multiomics market:
- High Costs: The high cost of multiomics analysis remains a significant barrier to entry for some researchers and healthcare providers.
- Data Analysis Complexity: The complexity of analyzing multiomics data requires specialized expertise and sophisticated bioinformatics tools, which can be challenging for smaller research institutions.
- Data Integration Challenges: Integrating data from multiple omics platforms remains a technical challenge, requiring standardized protocols and robust analytical pipelines.
Emerging Opportunities in Multiomics Market
The multiomics market presents several promising opportunities for long-term growth. Technological breakthroughs in single-cell multiomics and spatial multiomics are expected to open up new applications in various fields. Strategic partnerships between technology providers and healthcare companies will further accelerate market expansion. Expansion into new markets, particularly in developing countries with growing healthcare needs, presents significant potential.
Leading Players in the Multiomics Market Sector
- Agilent Technologies Inc
- BD
- BGI
- Bruker
- DH Life Sciences LLC
- Illumina Inc
- Mission Bio
- NanoCellect Biomedical
- PerkinElmer Inc
- QIAGEN
- Shimadzu Corporation
- Singleron Biotechnologies
- Standard BioTools
- Thermo Fisher Scientific Inc
- *List Not Exhaustive
Key Milestones in Multiomics Market Industry
- February 2024: Vizzhy Inc. launched the world's inaugural Multiomics Lab in Bengaluru, India, demonstrating the growing importance of multiomics in personalized healthcare.
- September 2023: MGI's DCS Lab Initiative stimulated large-scale multiomics research by providing access to cutting-edge technologies. This initiative significantly impacts the development of multiomics research globally.
- April 2023: Biomodal's new duet multiomics solution enhanced simultaneous analysis of epigenetic and genetic information, improving the efficiency and accuracy of multiomics analysis.
Strategic Outlook for Multiomics Market Market
The multiomics market is poised for substantial growth, driven by continued technological innovation and increasing demand for personalized healthcare solutions. Strategic partnerships between technology providers and healthcare institutions will play a crucial role in accelerating market expansion. Companies focusing on developing user-friendly platforms and providing comprehensive data analysis solutions will gain a competitive edge. The market's future success relies on overcoming cost challenges, improving data accessibility, and promoting widespread adoption across various sectors.
Multiomics Market Segmentation
-
1. Product
- 1.1. Instruments
- 1.2. Reagents
- 1.3. Other Products
-
2. Type
- 2.1. Single-cell Multiomics
- 2.2. Bulk Multiomics
-
3. Platform
- 3.1. Genomics
- 3.2. Transcriptomics
- 3.3. Proteomics
- 3.4. Metabolomics
- 3.5. Integrated Omics Platforms
- 3.6. Other Platforms
-
4. Application
- 4.1. Cell Biology
- 4.2. Oncology
- 4.3. Neurology
- 4.4. Immunology
- 4.5. Other Applications
-
5. End User
- 5.1. Academic and Research Institutes
- 5.2. Pharmaceutical & Biotechnology Companies
- 5.3. Other End Users
Multiomics Market Segmentation By Geography
-
1. North America
- 1.1. United States
- 1.2. Canada
- 1.3. Mexico
-
2. Europe
- 2.1. Germany
- 2.2. United Kingdom
- 2.3. France
- 2.4. Italy
- 2.5. Spain
- 2.6. Rest of Europe
-
3. Asia Pacific
- 3.1. China
- 3.2. Japan
- 3.3. India
- 3.4. Australia
- 3.5. South Korea
- 3.6. Rest of Asia Pacific
-
4. Middle East and Africa
- 4.1. GCC
- 4.2. South Africa
- 4.3. Rest of Middle East and Africa
-
5. South America
- 5.1. Brazil
- 5.2. Argentina
- 5.3. Rest of South America
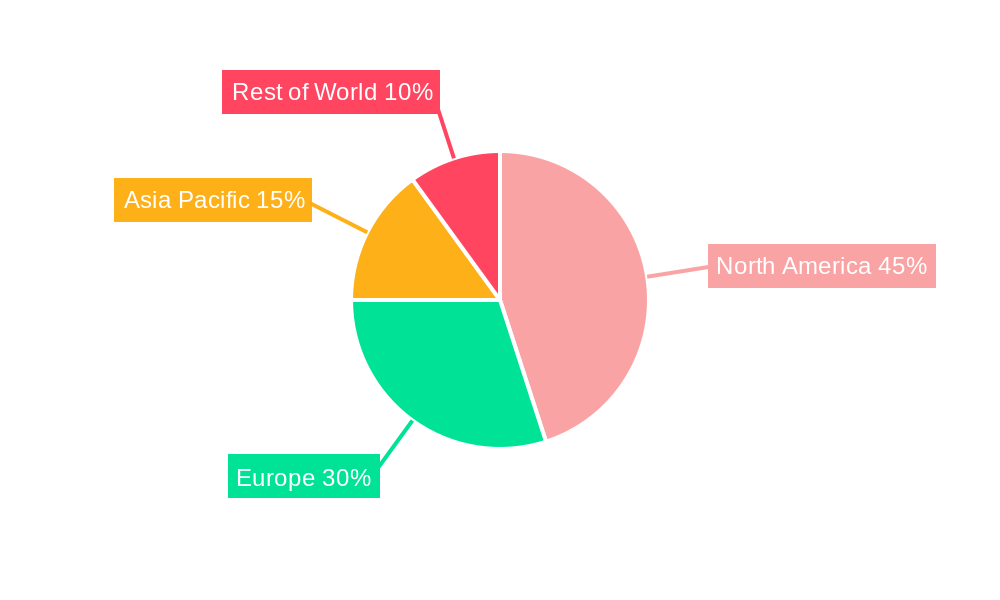
Multiomics Market Regional Market Share
Geographic Coverage of Multiomics Market
Multiomics Market REPORT HIGHLIGHTS
| Aspects | Details |
|---|---|
| Study Period | 2020-2034 |
| Base Year | 2025 |
| Estimated Year | 2026 |
| Forecast Period | 2026-2034 |
| Historical Period | 2020-2025 |
| Growth Rate | CAGR of 15.26% from 2020-2034 |
| Segmentation |
|
Table of Contents
- 1. Introduction
- 1.1. Research Scope
- 1.2. Market Segmentation
- 1.3. Research Objective
- 1.4. Definitions and Assumptions
- 2. Executive Summary
- 2.1. Market Snapshot
- 3. Market Dynamics
- 3.1. Market Drivers
- 3.2. Market Restrains
- 3.3. Market Trends
- 3.4. Market Opportunities
- 4. Market Factor Analysis
- 4.1. Porters Five Forces
- 4.1.1. Bargaining Power of Suppliers
- 4.1.2. Bargaining Power of Buyers
- 4.1.3. Threat of New Entrants
- 4.1.4. Threat of Substitutes
- 4.1.5. Competitive Rivalry
- 4.2. PESTEL analysis
- 4.3. BCG Analysis
- 4.3.1. Stars (High Growth, High Market Share)
- 4.3.2. Cash Cows (Low Growth, High Market Share)
- 4.3.3. Question Mark (High Growth, Low Market Share)
- 4.3.4. Dogs (Low Growth, Low Market Share)
- 4.4. Ansoff Matrix Analysis
- 4.5. Supply Chain Analysis
- 4.6. Regulatory Landscape
- 4.7. Current Market Potential and Opportunity Assessment (TAM–SAM–SOM Framework)
- 4.8. MDP Analyst Note
- 4.1. Porters Five Forces
- 5. Market Analysis, Insights and Forecast 2021-2033
- 5.1. Market Analysis, Insights and Forecast - by Product
- 5.1.1. Instruments
- 5.1.2. Reagents
- 5.1.3. Other Products
- 5.2. Market Analysis, Insights and Forecast - by Type
- 5.2.1. Single-cell Multiomics
- 5.2.2. Bulk Multiomics
- 5.3. Market Analysis, Insights and Forecast - by Platform
- 5.3.1. Genomics
- 5.3.2. Transcriptomics
- 5.3.3. Proteomics
- 5.3.4. Metabolomics
- 5.3.5. Integrated Omics Platforms
- 5.3.6. Other Platforms
- 5.4. Market Analysis, Insights and Forecast - by Application
- 5.4.1. Cell Biology
- 5.4.2. Oncology
- 5.4.3. Neurology
- 5.4.4. Immunology
- 5.4.5. Other Applications
- 5.5. Market Analysis, Insights and Forecast - by End User
- 5.5.1. Academic and Research Institutes
- 5.5.2. Pharmaceutical & Biotechnology Companies
- 5.5.3. Other End Users
- 5.6. Market Analysis, Insights and Forecast - by Region
- 5.6.1. North America
- 5.6.2. Europe
- 5.6.3. Asia Pacific
- 5.6.4. Middle East and Africa
- 5.6.5. South America
- 5.1. Market Analysis, Insights and Forecast - by Product
- 6. Global Multiomics Market Analysis, Insights and Forecast, 2021-2033
- 6.1. Market Analysis, Insights and Forecast - by Product
- 6.1.1. Instruments
- 6.1.2. Reagents
- 6.1.3. Other Products
- 6.2. Market Analysis, Insights and Forecast - by Type
- 6.2.1. Single-cell Multiomics
- 6.2.2. Bulk Multiomics
- 6.3. Market Analysis, Insights and Forecast - by Platform
- 6.3.1. Genomics
- 6.3.2. Transcriptomics
- 6.3.3. Proteomics
- 6.3.4. Metabolomics
- 6.3.5. Integrated Omics Platforms
- 6.3.6. Other Platforms
- 6.4. Market Analysis, Insights and Forecast - by Application
- 6.4.1. Cell Biology
- 6.4.2. Oncology
- 6.4.3. Neurology
- 6.4.4. Immunology
- 6.4.5. Other Applications
- 6.5. Market Analysis, Insights and Forecast - by End User
- 6.5.1. Academic and Research Institutes
- 6.5.2. Pharmaceutical & Biotechnology Companies
- 6.5.3. Other End Users
- 6.1. Market Analysis, Insights and Forecast - by Product
- 7. North America Multiomics Market Analysis, Insights and Forecast, 2020-2032
- 7.1. Market Analysis, Insights and Forecast - by Product
- 7.1.1. Instruments
- 7.1.2. Reagents
- 7.1.3. Other Products
- 7.2. Market Analysis, Insights and Forecast - by Type
- 7.2.1. Single-cell Multiomics
- 7.2.2. Bulk Multiomics
- 7.3. Market Analysis, Insights and Forecast - by Platform
- 7.3.1. Genomics
- 7.3.2. Transcriptomics
- 7.3.3. Proteomics
- 7.3.4. Metabolomics
- 7.3.5. Integrated Omics Platforms
- 7.3.6. Other Platforms
- 7.4. Market Analysis, Insights and Forecast - by Application
- 7.4.1. Cell Biology
- 7.4.2. Oncology
- 7.4.3. Neurology
- 7.4.4. Immunology
- 7.4.5. Other Applications
- 7.5. Market Analysis, Insights and Forecast - by End User
- 7.5.1. Academic and Research Institutes
- 7.5.2. Pharmaceutical & Biotechnology Companies
- 7.5.3. Other End Users
- 7.1. Market Analysis, Insights and Forecast - by Product
- 8. Europe Multiomics Market Analysis, Insights and Forecast, 2020-2032
- 8.1. Market Analysis, Insights and Forecast - by Product
- 8.1.1. Instruments
- 8.1.2. Reagents
- 8.1.3. Other Products
- 8.2. Market Analysis, Insights and Forecast - by Type
- 8.2.1. Single-cell Multiomics
- 8.2.2. Bulk Multiomics
- 8.3. Market Analysis, Insights and Forecast - by Platform
- 8.3.1. Genomics
- 8.3.2. Transcriptomics
- 8.3.3. Proteomics
- 8.3.4. Metabolomics
- 8.3.5. Integrated Omics Platforms
- 8.3.6. Other Platforms
- 8.4. Market Analysis, Insights and Forecast - by Application
- 8.4.1. Cell Biology
- 8.4.2. Oncology
- 8.4.3. Neurology
- 8.4.4. Immunology
- 8.4.5. Other Applications
- 8.5. Market Analysis, Insights and Forecast - by End User
- 8.5.1. Academic and Research Institutes
- 8.5.2. Pharmaceutical & Biotechnology Companies
- 8.5.3. Other End Users
- 8.1. Market Analysis, Insights and Forecast - by Product
- 9. Asia Pacific Multiomics Market Analysis, Insights and Forecast, 2020-2032
- 9.1. Market Analysis, Insights and Forecast - by Product
- 9.1.1. Instruments
- 9.1.2. Reagents
- 9.1.3. Other Products
- 9.2. Market Analysis, Insights and Forecast - by Type
- 9.2.1. Single-cell Multiomics
- 9.2.2. Bulk Multiomics
- 9.3. Market Analysis, Insights and Forecast - by Platform
- 9.3.1. Genomics
- 9.3.2. Transcriptomics
- 9.3.3. Proteomics
- 9.3.4. Metabolomics
- 9.3.5. Integrated Omics Platforms
- 9.3.6. Other Platforms
- 9.4. Market Analysis, Insights and Forecast - by Application
- 9.4.1. Cell Biology
- 9.4.2. Oncology
- 9.4.3. Neurology
- 9.4.4. Immunology
- 9.4.5. Other Applications
- 9.5. Market Analysis, Insights and Forecast - by End User
- 9.5.1. Academic and Research Institutes
- 9.5.2. Pharmaceutical & Biotechnology Companies
- 9.5.3. Other End Users
- 9.1. Market Analysis, Insights and Forecast - by Product
- 10. Middle East and Africa Multiomics Market Analysis, Insights and Forecast, 2020-2032
- 10.1. Market Analysis, Insights and Forecast - by Product
- 10.1.1. Instruments
- 10.1.2. Reagents
- 10.1.3. Other Products
- 10.2. Market Analysis, Insights and Forecast - by Type
- 10.2.1. Single-cell Multiomics
- 10.2.2. Bulk Multiomics
- 10.3. Market Analysis, Insights and Forecast - by Platform
- 10.3.1. Genomics
- 10.3.2. Transcriptomics
- 10.3.3. Proteomics
- 10.3.4. Metabolomics
- 10.3.5. Integrated Omics Platforms
- 10.3.6. Other Platforms
- 10.4. Market Analysis, Insights and Forecast - by Application
- 10.4.1. Cell Biology
- 10.4.2. Oncology
- 10.4.3. Neurology
- 10.4.4. Immunology
- 10.4.5. Other Applications
- 10.5. Market Analysis, Insights and Forecast - by End User
- 10.5.1. Academic and Research Institutes
- 10.5.2. Pharmaceutical & Biotechnology Companies
- 10.5.3. Other End Users
- 10.1. Market Analysis, Insights and Forecast - by Product
- 11. South America Multiomics Market Analysis, Insights and Forecast, 2020-2032
- 11.1. Market Analysis, Insights and Forecast - by Product
- 11.1.1. Instruments
- 11.1.2. Reagents
- 11.1.3. Other Products
- 11.2. Market Analysis, Insights and Forecast - by Type
- 11.2.1. Single-cell Multiomics
- 11.2.2. Bulk Multiomics
- 11.3. Market Analysis, Insights and Forecast - by Platform
- 11.3.1. Genomics
- 11.3.2. Transcriptomics
- 11.3.3. Proteomics
- 11.3.4. Metabolomics
- 11.3.5. Integrated Omics Platforms
- 11.3.6. Other Platforms
- 11.4. Market Analysis, Insights and Forecast - by Application
- 11.4.1. Cell Biology
- 11.4.2. Oncology
- 11.4.3. Neurology
- 11.4.4. Immunology
- 11.4.5. Other Applications
- 11.5. Market Analysis, Insights and Forecast - by End User
- 11.5.1. Academic and Research Institutes
- 11.5.2. Pharmaceutical & Biotechnology Companies
- 11.5.3. Other End Users
- 11.1. Market Analysis, Insights and Forecast - by Product
- 12. Competitive Analysis
- 12.1. Company Profiles
- 12.1.1 Agilent Technologies Inc
- 12.1.1.1. Company Overview
- 12.1.1.2. Products
- 12.1.1.3. Company Financials
- 12.1.1.4. SWOT Analysis
- 12.1.2 BD
- 12.1.2.1. Company Overview
- 12.1.2.2. Products
- 12.1.2.3. Company Financials
- 12.1.2.4. SWOT Analysis
- 12.1.3 BGI
- 12.1.3.1. Company Overview
- 12.1.3.2. Products
- 12.1.3.3. Company Financials
- 12.1.3.4. SWOT Analysis
- 12.1.4 Bruker
- 12.1.4.1. Company Overview
- 12.1.4.2. Products
- 12.1.4.3. Company Financials
- 12.1.4.4. SWOT Analysis
- 12.1.5 DH Life Sciences LLC
- 12.1.5.1. Company Overview
- 12.1.5.2. Products
- 12.1.5.3. Company Financials
- 12.1.5.4. SWOT Analysis
- 12.1.6 Illumina Inc
- 12.1.6.1. Company Overview
- 12.1.6.2. Products
- 12.1.6.3. Company Financials
- 12.1.6.4. SWOT Analysis
- 12.1.7 Mission Bio
- 12.1.7.1. Company Overview
- 12.1.7.2. Products
- 12.1.7.3. Company Financials
- 12.1.7.4. SWOT Analysis
- 12.1.8 NanoCellect Biomedical
- 12.1.8.1. Company Overview
- 12.1.8.2. Products
- 12.1.8.3. Company Financials
- 12.1.8.4. SWOT Analysis
- 12.1.9 PerkinElmer Inc
- 12.1.9.1. Company Overview
- 12.1.9.2. Products
- 12.1.9.3. Company Financials
- 12.1.9.4. SWOT Analysis
- 12.1.10 QIAGEN
- 12.1.10.1. Company Overview
- 12.1.10.2. Products
- 12.1.10.3. Company Financials
- 12.1.10.4. SWOT Analysis
- 12.1.11 Shimadzu Corporation
- 12.1.11.1. Company Overview
- 12.1.11.2. Products
- 12.1.11.3. Company Financials
- 12.1.11.4. SWOT Analysis
- 12.1.12 Singleron Biotechnologies
- 12.1.12.1. Company Overview
- 12.1.12.2. Products
- 12.1.12.3. Company Financials
- 12.1.12.4. SWOT Analysis
- 12.1.13 Standard BioTools
- 12.1.13.1. Company Overview
- 12.1.13.2. Products
- 12.1.13.3. Company Financials
- 12.1.13.4. SWOT Analysis
- 12.1.14 Thermo Fisher Scientific Inc *List Not Exhaustive
- 12.1.14.1. Company Overview
- 12.1.14.2. Products
- 12.1.14.3. Company Financials
- 12.1.14.4. SWOT Analysis
- 12.1.1 Agilent Technologies Inc
- 12.2. Market Entropy
- 12.2.1 Company's Key Areas Served
- 12.2.2 Recent Developments
- 12.3. Company Market Share Analysis 2025
- 12.3.1 Top 5 Companies Market Share Analysis
- 12.3.2 Top 3 Companies Market Share Analysis
- 12.4. List of Potential Customers
- 13. Research Methodology
List of Figures
- Figure 1: Global Multiomics Market Revenue Breakdown (Million, %) by Region 2025 & 2033
- Figure 2: Global Multiomics Market Volume Breakdown (Billion, %) by Region 2025 & 2033
- Figure 3: North America Multiomics Market Revenue (Million), by Product 2025 & 2033
- Figure 4: North America Multiomics Market Volume (Billion), by Product 2025 & 2033
- Figure 5: North America Multiomics Market Revenue Share (%), by Product 2025 & 2033
- Figure 6: North America Multiomics Market Volume Share (%), by Product 2025 & 2033
- Figure 7: North America Multiomics Market Revenue (Million), by Type 2025 & 2033
- Figure 8: North America Multiomics Market Volume (Billion), by Type 2025 & 2033
- Figure 9: North America Multiomics Market Revenue Share (%), by Type 2025 & 2033
- Figure 10: North America Multiomics Market Volume Share (%), by Type 2025 & 2033
- Figure 11: North America Multiomics Market Revenue (Million), by Platform 2025 & 2033
- Figure 12: North America Multiomics Market Volume (Billion), by Platform 2025 & 2033
- Figure 13: North America Multiomics Market Revenue Share (%), by Platform 2025 & 2033
- Figure 14: North America Multiomics Market Volume Share (%), by Platform 2025 & 2033
- Figure 15: North America Multiomics Market Revenue (Million), by Application 2025 & 2033
- Figure 16: North America Multiomics Market Volume (Billion), by Application 2025 & 2033
- Figure 17: North America Multiomics Market Revenue Share (%), by Application 2025 & 2033
- Figure 18: North America Multiomics Market Volume Share (%), by Application 2025 & 2033
- Figure 19: North America Multiomics Market Revenue (Million), by End User 2025 & 2033
- Figure 20: North America Multiomics Market Volume (Billion), by End User 2025 & 2033
- Figure 21: North America Multiomics Market Revenue Share (%), by End User 2025 & 2033
- Figure 22: North America Multiomics Market Volume Share (%), by End User 2025 & 2033
- Figure 23: North America Multiomics Market Revenue (Million), by Country 2025 & 2033
- Figure 24: North America Multiomics Market Volume (Billion), by Country 2025 & 2033
- Figure 25: North America Multiomics Market Revenue Share (%), by Country 2025 & 2033
- Figure 26: North America Multiomics Market Volume Share (%), by Country 2025 & 2033
- Figure 27: Europe Multiomics Market Revenue (Million), by Product 2025 & 2033
- Figure 28: Europe Multiomics Market Volume (Billion), by Product 2025 & 2033
- Figure 29: Europe Multiomics Market Revenue Share (%), by Product 2025 & 2033
- Figure 30: Europe Multiomics Market Volume Share (%), by Product 2025 & 2033
- Figure 31: Europe Multiomics Market Revenue (Million), by Type 2025 & 2033
- Figure 32: Europe Multiomics Market Volume (Billion), by Type 2025 & 2033
- Figure 33: Europe Multiomics Market Revenue Share (%), by Type 2025 & 2033
- Figure 34: Europe Multiomics Market Volume Share (%), by Type 2025 & 2033
- Figure 35: Europe Multiomics Market Revenue (Million), by Platform 2025 & 2033
- Figure 36: Europe Multiomics Market Volume (Billion), by Platform 2025 & 2033
- Figure 37: Europe Multiomics Market Revenue Share (%), by Platform 2025 & 2033
- Figure 38: Europe Multiomics Market Volume Share (%), by Platform 2025 & 2033
- Figure 39: Europe Multiomics Market Revenue (Million), by Application 2025 & 2033
- Figure 40: Europe Multiomics Market Volume (Billion), by Application 2025 & 2033
- Figure 41: Europe Multiomics Market Revenue Share (%), by Application 2025 & 2033
- Figure 42: Europe Multiomics Market Volume Share (%), by Application 2025 & 2033
- Figure 43: Europe Multiomics Market Revenue (Million), by End User 2025 & 2033
- Figure 44: Europe Multiomics Market Volume (Billion), by End User 2025 & 2033
- Figure 45: Europe Multiomics Market Revenue Share (%), by End User 2025 & 2033
- Figure 46: Europe Multiomics Market Volume Share (%), by End User 2025 & 2033
- Figure 47: Europe Multiomics Market Revenue (Million), by Country 2025 & 2033
- Figure 48: Europe Multiomics Market Volume (Billion), by Country 2025 & 2033
- Figure 49: Europe Multiomics Market Revenue Share (%), by Country 2025 & 2033
- Figure 50: Europe Multiomics Market Volume Share (%), by Country 2025 & 2033
- Figure 51: Asia Pacific Multiomics Market Revenue (Million), by Product 2025 & 2033
- Figure 52: Asia Pacific Multiomics Market Volume (Billion), by Product 2025 & 2033
- Figure 53: Asia Pacific Multiomics Market Revenue Share (%), by Product 2025 & 2033
- Figure 54: Asia Pacific Multiomics Market Volume Share (%), by Product 2025 & 2033
- Figure 55: Asia Pacific Multiomics Market Revenue (Million), by Type 2025 & 2033
- Figure 56: Asia Pacific Multiomics Market Volume (Billion), by Type 2025 & 2033
- Figure 57: Asia Pacific Multiomics Market Revenue Share (%), by Type 2025 & 2033
- Figure 58: Asia Pacific Multiomics Market Volume Share (%), by Type 2025 & 2033
- Figure 59: Asia Pacific Multiomics Market Revenue (Million), by Platform 2025 & 2033
- Figure 60: Asia Pacific Multiomics Market Volume (Billion), by Platform 2025 & 2033
- Figure 61: Asia Pacific Multiomics Market Revenue Share (%), by Platform 2025 & 2033
- Figure 62: Asia Pacific Multiomics Market Volume Share (%), by Platform 2025 & 2033
- Figure 63: Asia Pacific Multiomics Market Revenue (Million), by Application 2025 & 2033
- Figure 64: Asia Pacific Multiomics Market Volume (Billion), by Application 2025 & 2033
- Figure 65: Asia Pacific Multiomics Market Revenue Share (%), by Application 2025 & 2033
- Figure 66: Asia Pacific Multiomics Market Volume Share (%), by Application 2025 & 2033
- Figure 67: Asia Pacific Multiomics Market Revenue (Million), by End User 2025 & 2033
- Figure 68: Asia Pacific Multiomics Market Volume (Billion), by End User 2025 & 2033
- Figure 69: Asia Pacific Multiomics Market Revenue Share (%), by End User 2025 & 2033
- Figure 70: Asia Pacific Multiomics Market Volume Share (%), by End User 2025 & 2033
- Figure 71: Asia Pacific Multiomics Market Revenue (Million), by Country 2025 & 2033
- Figure 72: Asia Pacific Multiomics Market Volume (Billion), by Country 2025 & 2033
- Figure 73: Asia Pacific Multiomics Market Revenue Share (%), by Country 2025 & 2033
- Figure 74: Asia Pacific Multiomics Market Volume Share (%), by Country 2025 & 2033
- Figure 75: Middle East and Africa Multiomics Market Revenue (Million), by Product 2025 & 2033
- Figure 76: Middle East and Africa Multiomics Market Volume (Billion), by Product 2025 & 2033
- Figure 77: Middle East and Africa Multiomics Market Revenue Share (%), by Product 2025 & 2033
- Figure 78: Middle East and Africa Multiomics Market Volume Share (%), by Product 2025 & 2033
- Figure 79: Middle East and Africa Multiomics Market Revenue (Million), by Type 2025 & 2033
- Figure 80: Middle East and Africa Multiomics Market Volume (Billion), by Type 2025 & 2033
- Figure 81: Middle East and Africa Multiomics Market Revenue Share (%), by Type 2025 & 2033
- Figure 82: Middle East and Africa Multiomics Market Volume Share (%), by Type 2025 & 2033
- Figure 83: Middle East and Africa Multiomics Market Revenue (Million), by Platform 2025 & 2033
- Figure 84: Middle East and Africa Multiomics Market Volume (Billion), by Platform 2025 & 2033
- Figure 85: Middle East and Africa Multiomics Market Revenue Share (%), by Platform 2025 & 2033
- Figure 86: Middle East and Africa Multiomics Market Volume Share (%), by Platform 2025 & 2033
- Figure 87: Middle East and Africa Multiomics Market Revenue (Million), by Application 2025 & 2033
- Figure 88: Middle East and Africa Multiomics Market Volume (Billion), by Application 2025 & 2033
- Figure 89: Middle East and Africa Multiomics Market Revenue Share (%), by Application 2025 & 2033
- Figure 90: Middle East and Africa Multiomics Market Volume Share (%), by Application 2025 & 2033
- Figure 91: Middle East and Africa Multiomics Market Revenue (Million), by End User 2025 & 2033
- Figure 92: Middle East and Africa Multiomics Market Volume (Billion), by End User 2025 & 2033
- Figure 93: Middle East and Africa Multiomics Market Revenue Share (%), by End User 2025 & 2033
- Figure 94: Middle East and Africa Multiomics Market Volume Share (%), by End User 2025 & 2033
- Figure 95: Middle East and Africa Multiomics Market Revenue (Million), by Country 2025 & 2033
- Figure 96: Middle East and Africa Multiomics Market Volume (Billion), by Country 2025 & 2033
- Figure 97: Middle East and Africa Multiomics Market Revenue Share (%), by Country 2025 & 2033
- Figure 98: Middle East and Africa Multiomics Market Volume Share (%), by Country 2025 & 2033
- Figure 99: South America Multiomics Market Revenue (Million), by Product 2025 & 2033
- Figure 100: South America Multiomics Market Volume (Billion), by Product 2025 & 2033
- Figure 101: South America Multiomics Market Revenue Share (%), by Product 2025 & 2033
- Figure 102: South America Multiomics Market Volume Share (%), by Product 2025 & 2033
- Figure 103: South America Multiomics Market Revenue (Million), by Type 2025 & 2033
- Figure 104: South America Multiomics Market Volume (Billion), by Type 2025 & 2033
- Figure 105: South America Multiomics Market Revenue Share (%), by Type 2025 & 2033
- Figure 106: South America Multiomics Market Volume Share (%), by Type 2025 & 2033
- Figure 107: South America Multiomics Market Revenue (Million), by Platform 2025 & 2033
- Figure 108: South America Multiomics Market Volume (Billion), by Platform 2025 & 2033
- Figure 109: South America Multiomics Market Revenue Share (%), by Platform 2025 & 2033
- Figure 110: South America Multiomics Market Volume Share (%), by Platform 2025 & 2033
- Figure 111: South America Multiomics Market Revenue (Million), by Application 2025 & 2033
- Figure 112: South America Multiomics Market Volume (Billion), by Application 2025 & 2033
- Figure 113: South America Multiomics Market Revenue Share (%), by Application 2025 & 2033
- Figure 114: South America Multiomics Market Volume Share (%), by Application 2025 & 2033
- Figure 115: South America Multiomics Market Revenue (Million), by End User 2025 & 2033
- Figure 116: South America Multiomics Market Volume (Billion), by End User 2025 & 2033
- Figure 117: South America Multiomics Market Revenue Share (%), by End User 2025 & 2033
- Figure 118: South America Multiomics Market Volume Share (%), by End User 2025 & 2033
- Figure 119: South America Multiomics Market Revenue (Million), by Country 2025 & 2033
- Figure 120: South America Multiomics Market Volume (Billion), by Country 2025 & 2033
- Figure 121: South America Multiomics Market Revenue Share (%), by Country 2025 & 2033
- Figure 122: South America Multiomics Market Volume Share (%), by Country 2025 & 2033
List of Tables
- Table 1: Global Multiomics Market Revenue Million Forecast, by Product 2020 & 2033
- Table 2: Global Multiomics Market Volume Billion Forecast, by Product 2020 & 2033
- Table 3: Global Multiomics Market Revenue Million Forecast, by Type 2020 & 2033
- Table 4: Global Multiomics Market Volume Billion Forecast, by Type 2020 & 2033
- Table 5: Global Multiomics Market Revenue Million Forecast, by Platform 2020 & 2033
- Table 6: Global Multiomics Market Volume Billion Forecast, by Platform 2020 & 2033
- Table 7: Global Multiomics Market Revenue Million Forecast, by Application 2020 & 2033
- Table 8: Global Multiomics Market Volume Billion Forecast, by Application 2020 & 2033
- Table 9: Global Multiomics Market Revenue Million Forecast, by End User 2020 & 2033
- Table 10: Global Multiomics Market Volume Billion Forecast, by End User 2020 & 2033
- Table 11: Global Multiomics Market Revenue Million Forecast, by Region 2020 & 2033
- Table 12: Global Multiomics Market Volume Billion Forecast, by Region 2020 & 2033
- Table 13: Global Multiomics Market Revenue Million Forecast, by Product 2020 & 2033
- Table 14: Global Multiomics Market Volume Billion Forecast, by Product 2020 & 2033
- Table 15: Global Multiomics Market Revenue Million Forecast, by Type 2020 & 2033
- Table 16: Global Multiomics Market Volume Billion Forecast, by Type 2020 & 2033
- Table 17: Global Multiomics Market Revenue Million Forecast, by Platform 2020 & 2033
- Table 18: Global Multiomics Market Volume Billion Forecast, by Platform 2020 & 2033
- Table 19: Global Multiomics Market Revenue Million Forecast, by Application 2020 & 2033
- Table 20: Global Multiomics Market Volume Billion Forecast, by Application 2020 & 2033
- Table 21: Global Multiomics Market Revenue Million Forecast, by End User 2020 & 2033
- Table 22: Global Multiomics Market Volume Billion Forecast, by End User 2020 & 2033
- Table 23: Global Multiomics Market Revenue Million Forecast, by Country 2020 & 2033
- Table 24: Global Multiomics Market Volume Billion Forecast, by Country 2020 & 2033
- Table 25: United States Multiomics Market Revenue (Million) Forecast, by Application 2020 & 2033
- Table 26: United States Multiomics Market Volume (Billion) Forecast, by Application 2020 & 2033
- Table 27: Canada Multiomics Market Revenue (Million) Forecast, by Application 2020 & 2033
- Table 28: Canada Multiomics Market Volume (Billion) Forecast, by Application 2020 & 2033
- Table 29: Mexico Multiomics Market Revenue (Million) Forecast, by Application 2020 & 2033
- Table 30: Mexico Multiomics Market Volume (Billion) Forecast, by Application 2020 & 2033
- Table 31: Global Multiomics Market Revenue Million Forecast, by Product 2020 & 2033
- Table 32: Global Multiomics Market Volume Billion Forecast, by Product 2020 & 2033
- Table 33: Global Multiomics Market Revenue Million Forecast, by Type 2020 & 2033
- Table 34: Global Multiomics Market Volume Billion Forecast, by Type 2020 & 2033
- Table 35: Global Multiomics Market Revenue Million Forecast, by Platform 2020 & 2033
- Table 36: Global Multiomics Market Volume Billion Forecast, by Platform 2020 & 2033
- Table 37: Global Multiomics Market Revenue Million Forecast, by Application 2020 & 2033
- Table 38: Global Multiomics Market Volume Billion Forecast, by Application 2020 & 2033
- Table 39: Global Multiomics Market Revenue Million Forecast, by End User 2020 & 2033
- Table 40: Global Multiomics Market Volume Billion Forecast, by End User 2020 & 2033
- Table 41: Global Multiomics Market Revenue Million Forecast, by Country 2020 & 2033
- Table 42: Global Multiomics Market Volume Billion Forecast, by Country 2020 & 2033
- Table 43: Germany Multiomics Market Revenue (Million) Forecast, by Application 2020 & 2033
- Table 44: Germany Multiomics Market Volume (Billion) Forecast, by Application 2020 & 2033
- Table 45: United Kingdom Multiomics Market Revenue (Million) Forecast, by Application 2020 & 2033
- Table 46: United Kingdom Multiomics Market Volume (Billion) Forecast, by Application 2020 & 2033
- Table 47: France Multiomics Market Revenue (Million) Forecast, by Application 2020 & 2033
- Table 48: France Multiomics Market Volume (Billion) Forecast, by Application 2020 & 2033
- Table 49: Italy Multiomics Market Revenue (Million) Forecast, by Application 2020 & 2033
- Table 50: Italy Multiomics Market Volume (Billion) Forecast, by Application 2020 & 2033
- Table 51: Spain Multiomics Market Revenue (Million) Forecast, by Application 2020 & 2033
- Table 52: Spain Multiomics Market Volume (Billion) Forecast, by Application 2020 & 2033
- Table 53: Rest of Europe Multiomics Market Revenue (Million) Forecast, by Application 2020 & 2033
- Table 54: Rest of Europe Multiomics Market Volume (Billion) Forecast, by Application 2020 & 2033
- Table 55: Global Multiomics Market Revenue Million Forecast, by Product 2020 & 2033
- Table 56: Global Multiomics Market Volume Billion Forecast, by Product 2020 & 2033
- Table 57: Global Multiomics Market Revenue Million Forecast, by Type 2020 & 2033
- Table 58: Global Multiomics Market Volume Billion Forecast, by Type 2020 & 2033
- Table 59: Global Multiomics Market Revenue Million Forecast, by Platform 2020 & 2033
- Table 60: Global Multiomics Market Volume Billion Forecast, by Platform 2020 & 2033
- Table 61: Global Multiomics Market Revenue Million Forecast, by Application 2020 & 2033
- Table 62: Global Multiomics Market Volume Billion Forecast, by Application 2020 & 2033
- Table 63: Global Multiomics Market Revenue Million Forecast, by End User 2020 & 2033
- Table 64: Global Multiomics Market Volume Billion Forecast, by End User 2020 & 2033
- Table 65: Global Multiomics Market Revenue Million Forecast, by Country 2020 & 2033
- Table 66: Global Multiomics Market Volume Billion Forecast, by Country 2020 & 2033
- Table 67: China Multiomics Market Revenue (Million) Forecast, by Application 2020 & 2033
- Table 68: China Multiomics Market Volume (Billion) Forecast, by Application 2020 & 2033
- Table 69: Japan Multiomics Market Revenue (Million) Forecast, by Application 2020 & 2033
- Table 70: Japan Multiomics Market Volume (Billion) Forecast, by Application 2020 & 2033
- Table 71: India Multiomics Market Revenue (Million) Forecast, by Application 2020 & 2033
- Table 72: India Multiomics Market Volume (Billion) Forecast, by Application 2020 & 2033
- Table 73: Australia Multiomics Market Revenue (Million) Forecast, by Application 2020 & 2033
- Table 74: Australia Multiomics Market Volume (Billion) Forecast, by Application 2020 & 2033
- Table 75: South Korea Multiomics Market Revenue (Million) Forecast, by Application 2020 & 2033
- Table 76: South Korea Multiomics Market Volume (Billion) Forecast, by Application 2020 & 2033
- Table 77: Rest of Asia Pacific Multiomics Market Revenue (Million) Forecast, by Application 2020 & 2033
- Table 78: Rest of Asia Pacific Multiomics Market Volume (Billion) Forecast, by Application 2020 & 2033
- Table 79: Global Multiomics Market Revenue Million Forecast, by Product 2020 & 2033
- Table 80: Global Multiomics Market Volume Billion Forecast, by Product 2020 & 2033
- Table 81: Global Multiomics Market Revenue Million Forecast, by Type 2020 & 2033
- Table 82: Global Multiomics Market Volume Billion Forecast, by Type 2020 & 2033
- Table 83: Global Multiomics Market Revenue Million Forecast, by Platform 2020 & 2033
- Table 84: Global Multiomics Market Volume Billion Forecast, by Platform 2020 & 2033
- Table 85: Global Multiomics Market Revenue Million Forecast, by Application 2020 & 2033
- Table 86: Global Multiomics Market Volume Billion Forecast, by Application 2020 & 2033
- Table 87: Global Multiomics Market Revenue Million Forecast, by End User 2020 & 2033
- Table 88: Global Multiomics Market Volume Billion Forecast, by End User 2020 & 2033
- Table 89: Global Multiomics Market Revenue Million Forecast, by Country 2020 & 2033
- Table 90: Global Multiomics Market Volume Billion Forecast, by Country 2020 & 2033
- Table 91: GCC Multiomics Market Revenue (Million) Forecast, by Application 2020 & 2033
- Table 92: GCC Multiomics Market Volume (Billion) Forecast, by Application 2020 & 2033
- Table 93: South Africa Multiomics Market Revenue (Million) Forecast, by Application 2020 & 2033
- Table 94: South Africa Multiomics Market Volume (Billion) Forecast, by Application 2020 & 2033
- Table 95: Rest of Middle East and Africa Multiomics Market Revenue (Million) Forecast, by Application 2020 & 2033
- Table 96: Rest of Middle East and Africa Multiomics Market Volume (Billion) Forecast, by Application 2020 & 2033
- Table 97: Global Multiomics Market Revenue Million Forecast, by Product 2020 & 2033
- Table 98: Global Multiomics Market Volume Billion Forecast, by Product 2020 & 2033
- Table 99: Global Multiomics Market Revenue Million Forecast, by Type 2020 & 2033
- Table 100: Global Multiomics Market Volume Billion Forecast, by Type 2020 & 2033
- Table 101: Global Multiomics Market Revenue Million Forecast, by Platform 2020 & 2033
- Table 102: Global Multiomics Market Volume Billion Forecast, by Platform 2020 & 2033
- Table 103: Global Multiomics Market Revenue Million Forecast, by Application 2020 & 2033
- Table 104: Global Multiomics Market Volume Billion Forecast, by Application 2020 & 2033
- Table 105: Global Multiomics Market Revenue Million Forecast, by End User 2020 & 2033
- Table 106: Global Multiomics Market Volume Billion Forecast, by End User 2020 & 2033
- Table 107: Global Multiomics Market Revenue Million Forecast, by Country 2020 & 2033
- Table 108: Global Multiomics Market Volume Billion Forecast, by Country 2020 & 2033
- Table 109: Brazil Multiomics Market Revenue (Million) Forecast, by Application 2020 & 2033
- Table 110: Brazil Multiomics Market Volume (Billion) Forecast, by Application 2020 & 2033
- Table 111: Argentina Multiomics Market Revenue (Million) Forecast, by Application 2020 & 2033
- Table 112: Argentina Multiomics Market Volume (Billion) Forecast, by Application 2020 & 2033
- Table 113: Rest of South America Multiomics Market Revenue (Million) Forecast, by Application 2020 & 2033
- Table 114: Rest of South America Multiomics Market Volume (Billion) Forecast, by Application 2020 & 2033
Frequently Asked Questions
1. What is the projected Compound Annual Growth Rate (CAGR) of the Multiomics Market?
The projected CAGR is approximately 15.26%.
2. Which companies are prominent players in the Multiomics Market?
Key companies in the market include Agilent Technologies Inc, BD, BGI, Bruker, DH Life Sciences LLC, Illumina Inc, Mission Bio, NanoCellect Biomedical, PerkinElmer Inc, QIAGEN, Shimadzu Corporation, Singleron Biotechnologies, Standard BioTools, Thermo Fisher Scientific Inc *List Not Exhaustive.
3. What are the main segments of the Multiomics Market?
The market segments include Product, Type, Platform, Application, End User.
4. Can you provide details about the market size?
The market size is estimated to be USD 3.11 Million as of 2022.
5. What are some drivers contributing to market growth?
Rising Demand for Single-cell Multiomics and Advancements in Omics Technologies; Increasing Investment in Genomics R&D; Growing Demand for Personalized Medicine.
6. What are the notable trends driving market growth?
The Bulk Multiomics Segment is Expected to Hold the Largest Share of the Market.
7. Are there any restraints impacting market growth?
Rising Demand for Single-cell Multiomics and Advancements in Omics Technologies; Increasing Investment in Genomics R&D; Growing Demand for Personalized Medicine.
8. Can you provide examples of recent developments in the market?
February 2024: Vizzhy Inc. launched the world's inaugural Multiomics Lab in Bengaluru, India, heralding a major advancement in healthcare innovation. Equipped with cutting-edge tools and health AI technology, the lab enables physicians to pinpoint root causes and offer personalized recommendations for their patients.September 2023: MGI, a provider of technology and tools for life science, introduced the DCS Lab Initiative to stimulate crucial scientific research. This initiative encourages large-scale multiomics laboratories. Under the initiative, the organization offers products for numerous applications, including cell omics, DNA sequencing, and spatial omics based on DNBSEQ technologies, to specified research institutions globally.April 2023: Biomodal, formerly Cambridge Epigenetix, introduced a new duet multiomics solution that can enable simultaneous phased reading of epigenetic and genetic information in a single, low-volume sample.
9. What pricing options are available for accessing the report?
Pricing options include single-user, multi-user, and enterprise licenses priced at USD 4750, USD 5250, and USD 8750 respectively.
10. Is the market size provided in terms of value or volume?
The market size is provided in terms of value, measured in Million and volume, measured in Billion.
11. Are there any specific market keywords associated with the report?
Yes, the market keyword associated with the report is "Multiomics Market," which aids in identifying and referencing the specific market segment covered.
12. How do I determine which pricing option suits my needs best?
The pricing options vary based on user requirements and access needs. Individual users may opt for single-user licenses, while businesses requiring broader access may choose multi-user or enterprise licenses for cost-effective access to the report.
13. Are there any additional resources or data provided in the Multiomics Market report?
While the report offers comprehensive insights, it's advisable to review the specific contents or supplementary materials provided to ascertain if additional resources or data are available.
14. How can I stay updated on further developments or reports in the Multiomics Market?
To stay informed about further developments, trends, and reports in the Multiomics Market, consider subscribing to industry newsletters, following relevant companies and organizations, or regularly checking reputable industry news sources and publications.
Methodology
Step 1 - Identification of Relevant Samples Size from Population Database


Step 2 - Approaches for Defining Global Market Size (Value, Volume* & Price*)

Note*: In applicable scenarios
Step 3 - Data Sources
Primary Research
- Web Analytics
- Survey Reports
- Research Institute
- Latest Research Reports
- Opinion Leaders
Secondary Research
- Annual Reports
- White Paper
- Latest Press Release
- Industry Association
- Paid Database
- Investor Presentations

Step 4 - Data Triangulation
Involves using different sources of information in order to increase the validity of a study
These sources are likely to be stakeholders in a program - participants, other researchers, program staff, other community members, and so on.
Then we put all data in single framework & apply various statistical tools to find out the dynamic on the market.
During the analysis stage, feedback from the stakeholder groups would be compared to determine areas of agreement as well as areas of divergence