

Key Insights
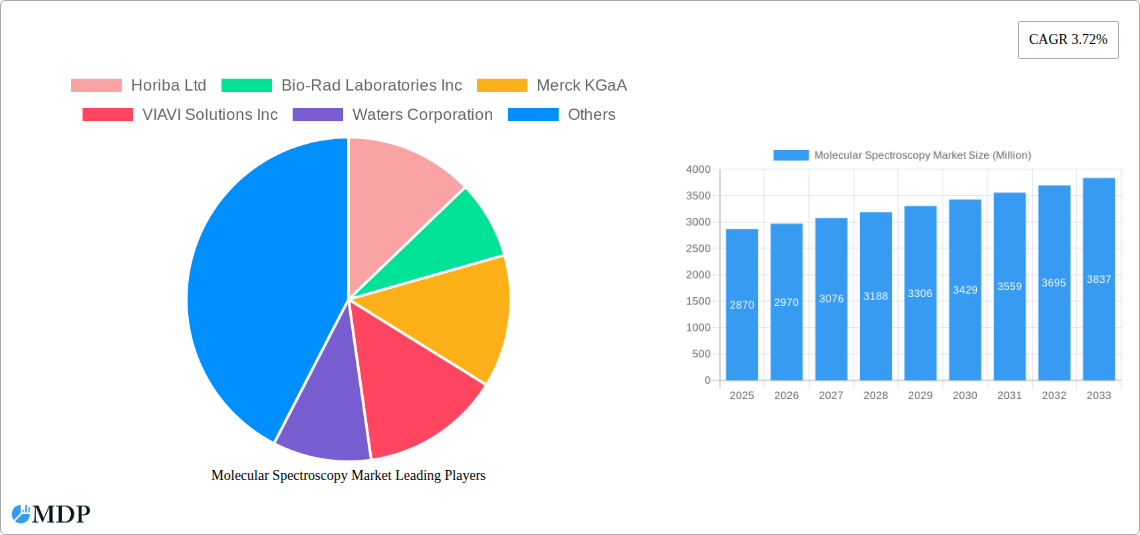
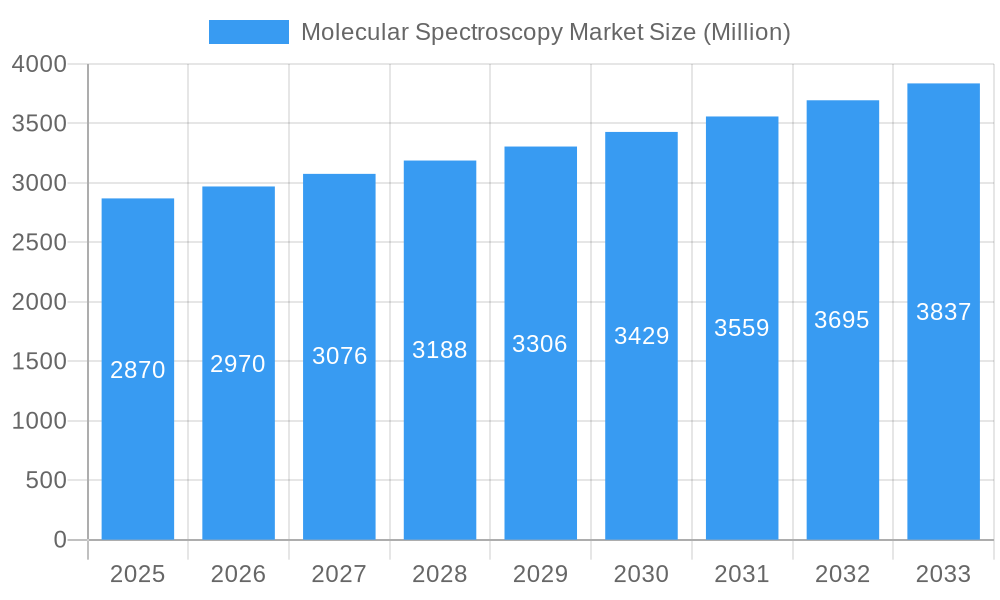
The global molecular spectroscopy market, valued at $2.87 billion in 2025, is projected to experience robust growth, driven by increasing demand across diverse sectors. The compound annual growth rate (CAGR) of 3.72% from 2025 to 2033 indicates a steady expansion fueled by several key factors. Advancements in instrumentation, offering higher sensitivity, resolution, and automation, are significantly impacting the market. The pharmaceutical industry's reliance on molecular spectroscopy for drug discovery, quality control, and process optimization is a major driver. Similarly, the burgeoning biotechnology and biopharmaceutical sectors are contributing to market expansion through applications in proteomics, metabolomics, and genomics research. Furthermore, stringent regulatory requirements for food safety and environmental monitoring are fostering demand for accurate and reliable spectroscopic techniques. Growth is also spurred by academic research initiatives exploring novel applications and methodologies within molecular spectroscopy. The market segmentation reveals that NMR, Raman, and infrared spectroscopy are major contributors, reflecting their versatility and widespread adoption.
Molecular Spectroscopy Market Market Size (In Billion)
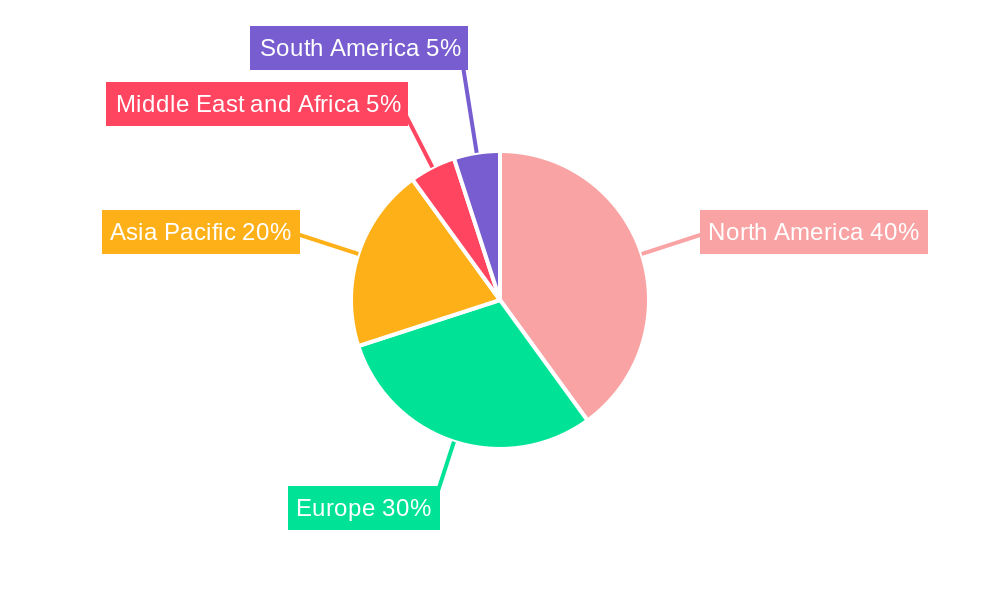
While the market exhibits strong growth potential, certain restraints need consideration. High initial investment costs associated with sophisticated instrumentation can pose a barrier to entry for smaller companies or research groups. Furthermore, the need for specialized expertise to operate and interpret data from these advanced instruments might limit widespread adoption in certain settings. However, ongoing technological advancements, such as the development of portable and user-friendly instruments, are expected to mitigate these limitations. The market's geographical distribution demonstrates strong presence in North America and Europe, driven by well-established research infrastructure and regulatory frameworks. However, emerging economies in Asia-Pacific and other regions are showing rapid growth potential, presenting substantial future opportunities as these regions invest further in their scientific and industrial sectors. The continuous innovation and expansion within molecular spectroscopy promise sustained market growth over the forecast period.
Molecular Spectroscopy Market Company Market Share
Molecular Spectroscopy Market: A Comprehensive Analysis (2019-2033)
This in-depth report provides a comprehensive analysis of the Molecular Spectroscopy Market, encompassing market dynamics, industry trends, leading segments, key players, and future growth prospects. The study period covers 2019-2033, with 2025 as the base and estimated year, and a forecast period of 2025-2033. The report leverages extensive primary and secondary research to deliver actionable insights for stakeholders across the value chain. The market is segmented by type of spectroscopy (NMR, Raman, UV-visible, Mass, Infrared, Near-infrared, and Other) and application (Pharmaceutical, Food & Beverage, Biotechnology & Biopharmaceuticals, Environmental Testing, Academic Research, and Other). The total market size is projected to reach xx Million by 2033.
Molecular Spectroscopy Market Market Dynamics & Concentration
The Molecular Spectroscopy market is characterized by a moderately concentrated landscape, with key players like Horiba Ltd, Bio-Rad Laboratories Inc, Merck KGaA, VIAVI Solutions Inc, Waters Corporation, Danaher Corporation, Agilent Technologies Inc, Thermo Fischer Scientific Inc, Jeol Ltd, Keit Ltd, PerkinElmer Inc, Thorlabs Inc, Bruker Corporation, and Shimadzu Corporation holding significant market share. The combined market share of the top five players is estimated at xx%.
- Innovation Drivers: Continuous advancements in detector technologies, miniaturization, and software integration are driving market growth.
- Regulatory Frameworks: Stringent regulations concerning environmental monitoring and quality control in various industries are boosting demand.
- Product Substitutes: While limited, alternative analytical techniques pose some competitive pressure.
- End-User Trends: Increasing adoption of advanced analytical techniques in research, pharmaceuticals, and food safety is a key growth driver.
- M&A Activities: The market has witnessed xx M&A deals in the last five years, primarily focused on expanding product portfolios and geographical reach. This consolidation trend is expected to continue.
Molecular Spectroscopy Market Industry Trends & Analysis
The Molecular Spectroscopy market is experiencing robust growth, driven by several key factors. The market exhibited a CAGR of xx% during the historical period (2019-2024) and is projected to maintain a CAGR of xx% during the forecast period (2025-2033). This growth is fueled by increasing demand from diverse end-use sectors, technological advancements, and rising investments in R&D. The market penetration of molecular spectroscopy techniques is increasing across various industries, particularly in pharmaceuticals and environmental testing, driven by the need for precise and rapid analysis. Competitive dynamics are marked by intense innovation, strategic partnerships, and product diversification among leading players. Consumer preferences are shifting towards high-throughput, automated systems, and user-friendly software interfaces.
Leading Markets & Segments in Molecular Spectroscopy Market
The pharmaceutical application segment dominates the Molecular Spectroscopy market, accounting for approximately xx% of the total market share in 2025. North America and Europe are currently the leading regional markets, fueled by robust research and development activities and stringent regulatory standards. However, Asia-Pacific is expected to witness the fastest growth due to rising healthcare expenditure and increasing adoption of advanced analytical techniques.
Key Drivers for Dominant Segments:
- Pharmaceutical Applications: Stringent quality control requirements and the need for precise drug discovery and development processes.
- North America & Europe: High R&D investment, advanced technological infrastructure, and strong regulatory frameworks.
- Asia-Pacific: Rapid economic growth, rising healthcare expenditure, and increasing awareness about quality control.
Dominance Analysis:
The pharmaceutical application segment’s dominance stems from the crucial role of molecular spectroscopy in drug discovery, formulation development, and quality control. North America and Europe benefit from established research infrastructure and a strong regulatory landscape. The Asia-Pacific region's rapid growth reflects a rising need for advanced analytical techniques and growing healthcare spending.
Molecular Spectroscopy Market Product Developments
Recent advancements in molecular spectroscopy include the development of portable and miniaturized instruments, improved detector technologies for enhanced sensitivity and resolution, and sophisticated software for data analysis and interpretation. These developments have expanded the applications of molecular spectroscopy into diverse fields, offering competitive advantages such as faster analysis times, increased accuracy, and reduced operational costs. The focus is on integrating artificial intelligence and machine learning for improved data analysis and automation.
Key Drivers of Molecular Spectroscopy Market Growth
The Molecular Spectroscopy market is experiencing strong growth due to several factors:
- Technological advancements: Miniaturization, improved sensitivity, and automation are enhancing the efficiency and accessibility of molecular spectroscopy techniques.
- Stringent regulatory frameworks: Regulations driving quality control and environmental monitoring are increasing demand across various sectors.
- Rising research and development investments: Growing investments in pharmaceutical and biotechnology research are fueling the adoption of advanced analytical techniques.
Challenges in the Molecular Spectroscopy Market Market
Despite strong growth prospects, the Molecular Spectroscopy market faces certain challenges:
- High initial investment costs: The high cost of sophisticated instruments can be a barrier to entry for some users.
- Complex data analysis: Interpreting spectral data requires specialized expertise, which can limit wider adoption.
- Competition from alternative analytical techniques: Other analytical techniques offer competitive pressure, though often lack the versatility of molecular spectroscopy.
Emerging Opportunities in Molecular Spectroscopy Market
Future growth opportunities are abundant. The integration of artificial intelligence and machine learning will enhance data analysis and automation, while the development of portable and user-friendly instruments will broaden accessibility. Strategic partnerships and collaborations between instrument manufacturers and end-users will further drive market expansion. Expansion into emerging markets with increasing healthcare and environmental monitoring needs presents significant potential.
Leading Players in the Molecular Spectroscopy Market Sector
- Horiba Ltd
- Bio-Rad Laboratories Inc
- Merck KGaA
- VIAVI Solutions Inc
- Waters Corporation
- Danaher Corporation
- Agilent Technologies Inc
- Thermo Fischer Scientific Inc
- Jeol Ltd
- Keit Ltd
- PerkinElmer Inc
- Thorlabs Inc
- Bruker Corporation
- Shimadzu Corporation
Key Milestones in Molecular Spectroscopy Market Industry
- 2020: Launch of a new generation of Raman spectrometer with enhanced sensitivity.
- 2021: Merger between two major players in the mass spectrometry segment.
- 2022: Introduction of AI-powered software for automated data analysis in NMR spectroscopy.
- 2023: Development of a portable near-infrared spectrometer for on-site analysis.
Strategic Outlook for Molecular Spectroscopy Market Market
The Molecular Spectroscopy market presents a compelling investment opportunity, fueled by continuous technological innovation, increasing demand from diverse sectors, and a favorable regulatory environment. Strategic alliances, product diversification, and geographical expansion will be crucial for sustained growth. The market is poised for significant expansion in the coming years, driven by the increasing need for rapid, accurate, and high-throughput analytical solutions.
Molecular Spectroscopy Market Segmentation
-
1. Type of Spectroscopy
- 1.1. NMR Spectroscopy
- 1.2. Raman Spectroscopy
- 1.3. UV-visible Spectroscopy
- 1.4. Mass Spectroscopy
- 1.5. Infrared Spectroscopy
- 1.6. Near-infrared Spectroscopy
- 1.7. Other Types of Spectroscopy
-
2. Application
- 2.1. Pharmaceutical Applications
- 2.2. Food and Beverage Testing
- 2.3. Biotechnology and Biopharmaceutical Applications
- 2.4. Environmental Testing
- 2.5. Academic Research
- 2.6. Other Applications
Molecular Spectroscopy Market Segmentation By Geography
-
1. North America
- 1.1. United States
- 1.2. Canada
- 1.3. Mexico
-
2. Europe
- 2.1. Germany
- 2.2. United Kingdom
- 2.3. France
- 2.4. Italy
- 2.5. Spain
- 2.6. Rest of Europe
-
3. Asia Pacific
- 3.1. China
- 3.2. Japan
- 3.3. India
- 3.4. Australia
- 3.5. South Korea
- 3.6. Rest of Asia Pacific
-
4. Middle East and Africa
- 4.1. GCC
- 4.2. South Africa
- 4.3. Rest of Middle East and Africa
-
5. South America
- 5.1. Brazil
- 5.2. Argentina
- 5.3. Rest of South America
Molecular Spectroscopy Market Regional Market Share
Geographic Coverage of Molecular Spectroscopy Market
Molecular Spectroscopy Market REPORT HIGHLIGHTS
| Aspects | Details |
|---|---|
| Study Period | 2020-2034 |
| Base Year | 2025 |
| Estimated Year | 2026 |
| Forecast Period | 2026-2034 |
| Historical Period | 2020-2025 |
| Growth Rate | CAGR of 3.72% from 2020-2034 |
| Segmentation |
|
Table of Contents
- 1. Introduction
- 1.1. Research Scope
- 1.2. Market Segmentation
- 1.3. Research Methodology
- 1.4. Definitions and Assumptions
- 2. Executive Summary
- 2.1. Introduction
- 3. Market Dynamics
- 3.1. Introduction
- 3.2. Market Drivers
- 3.2.1. Rapid Adoption in the Pharmaceutical Industry; Penetration of MS Technology in Various Verticals; Increased Emphasis for Discovery of Newer Molecules by Pharmaceuticals
- 3.3. Market Restrains
- 3.3.1. High Cost of Maintenance and Installation Charges; Need of Technically Skilled Personnel
- 3.4. Market Trends
- 3.4.1. The NMR Spectroscopy Segment is Expected to Observe Good Growth Over the Forecast Period
- 4. Market Factor Analysis
- 4.1. Porters Five Forces
- 4.2. Supply/Value Chain
- 4.3. PESTEL analysis
- 4.4. Market Entropy
- 4.5. Patent/Trademark Analysis
- 5. Global Molecular Spectroscopy Market Analysis, Insights and Forecast, 2020-2032
- 5.1. Market Analysis, Insights and Forecast - by Type of Spectroscopy
- 5.1.1. NMR Spectroscopy
- 5.1.2. Raman Spectroscopy
- 5.1.3. UV-visible Spectroscopy
- 5.1.4. Mass Spectroscopy
- 5.1.5. Infrared Spectroscopy
- 5.1.6. Near-infrared Spectroscopy
- 5.1.7. Other Types of Spectroscopy
- 5.2. Market Analysis, Insights and Forecast - by Application
- 5.2.1. Pharmaceutical Applications
- 5.2.2. Food and Beverage Testing
- 5.2.3. Biotechnology and Biopharmaceutical Applications
- 5.2.4. Environmental Testing
- 5.2.5. Academic Research
- 5.2.6. Other Applications
- 5.3. Market Analysis, Insights and Forecast - by Region
- 5.3.1. North America
- 5.3.2. Europe
- 5.3.3. Asia Pacific
- 5.3.4. Middle East and Africa
- 5.3.5. South America
- 5.1. Market Analysis, Insights and Forecast - by Type of Spectroscopy
- 6. North America Molecular Spectroscopy Market Analysis, Insights and Forecast, 2020-2032
- 6.1. Market Analysis, Insights and Forecast - by Type of Spectroscopy
- 6.1.1. NMR Spectroscopy
- 6.1.2. Raman Spectroscopy
- 6.1.3. UV-visible Spectroscopy
- 6.1.4. Mass Spectroscopy
- 6.1.5. Infrared Spectroscopy
- 6.1.6. Near-infrared Spectroscopy
- 6.1.7. Other Types of Spectroscopy
- 6.2. Market Analysis, Insights and Forecast - by Application
- 6.2.1. Pharmaceutical Applications
- 6.2.2. Food and Beverage Testing
- 6.2.3. Biotechnology and Biopharmaceutical Applications
- 6.2.4. Environmental Testing
- 6.2.5. Academic Research
- 6.2.6. Other Applications
- 6.1. Market Analysis, Insights and Forecast - by Type of Spectroscopy
- 7. Europe Molecular Spectroscopy Market Analysis, Insights and Forecast, 2020-2032
- 7.1. Market Analysis, Insights and Forecast - by Type of Spectroscopy
- 7.1.1. NMR Spectroscopy
- 7.1.2. Raman Spectroscopy
- 7.1.3. UV-visible Spectroscopy
- 7.1.4. Mass Spectroscopy
- 7.1.5. Infrared Spectroscopy
- 7.1.6. Near-infrared Spectroscopy
- 7.1.7. Other Types of Spectroscopy
- 7.2. Market Analysis, Insights and Forecast - by Application
- 7.2.1. Pharmaceutical Applications
- 7.2.2. Food and Beverage Testing
- 7.2.3. Biotechnology and Biopharmaceutical Applications
- 7.2.4. Environmental Testing
- 7.2.5. Academic Research
- 7.2.6. Other Applications
- 7.1. Market Analysis, Insights and Forecast - by Type of Spectroscopy
- 8. Asia Pacific Molecular Spectroscopy Market Analysis, Insights and Forecast, 2020-2032
- 8.1. Market Analysis, Insights and Forecast - by Type of Spectroscopy
- 8.1.1. NMR Spectroscopy
- 8.1.2. Raman Spectroscopy
- 8.1.3. UV-visible Spectroscopy
- 8.1.4. Mass Spectroscopy
- 8.1.5. Infrared Spectroscopy
- 8.1.6. Near-infrared Spectroscopy
- 8.1.7. Other Types of Spectroscopy
- 8.2. Market Analysis, Insights and Forecast - by Application
- 8.2.1. Pharmaceutical Applications
- 8.2.2. Food and Beverage Testing
- 8.2.3. Biotechnology and Biopharmaceutical Applications
- 8.2.4. Environmental Testing
- 8.2.5. Academic Research
- 8.2.6. Other Applications
- 8.1. Market Analysis, Insights and Forecast - by Type of Spectroscopy
- 9. Middle East and Africa Molecular Spectroscopy Market Analysis, Insights and Forecast, 2020-2032
- 9.1. Market Analysis, Insights and Forecast - by Type of Spectroscopy
- 9.1.1. NMR Spectroscopy
- 9.1.2. Raman Spectroscopy
- 9.1.3. UV-visible Spectroscopy
- 9.1.4. Mass Spectroscopy
- 9.1.5. Infrared Spectroscopy
- 9.1.6. Near-infrared Spectroscopy
- 9.1.7. Other Types of Spectroscopy
- 9.2. Market Analysis, Insights and Forecast - by Application
- 9.2.1. Pharmaceutical Applications
- 9.2.2. Food and Beverage Testing
- 9.2.3. Biotechnology and Biopharmaceutical Applications
- 9.2.4. Environmental Testing
- 9.2.5. Academic Research
- 9.2.6. Other Applications
- 9.1. Market Analysis, Insights and Forecast - by Type of Spectroscopy
- 10. South America Molecular Spectroscopy Market Analysis, Insights and Forecast, 2020-2032
- 10.1. Market Analysis, Insights and Forecast - by Type of Spectroscopy
- 10.1.1. NMR Spectroscopy
- 10.1.2. Raman Spectroscopy
- 10.1.3. UV-visible Spectroscopy
- 10.1.4. Mass Spectroscopy
- 10.1.5. Infrared Spectroscopy
- 10.1.6. Near-infrared Spectroscopy
- 10.1.7. Other Types of Spectroscopy
- 10.2. Market Analysis, Insights and Forecast - by Application
- 10.2.1. Pharmaceutical Applications
- 10.2.2. Food and Beverage Testing
- 10.2.3. Biotechnology and Biopharmaceutical Applications
- 10.2.4. Environmental Testing
- 10.2.5. Academic Research
- 10.2.6. Other Applications
- 10.1. Market Analysis, Insights and Forecast - by Type of Spectroscopy
- 11. Competitive Analysis
- 11.1. Global Market Share Analysis 2025
- 11.2. Company Profiles
- 11.2.1 Horiba Ltd
- 11.2.1.1. Overview
- 11.2.1.2. Products
- 11.2.1.3. SWOT Analysis
- 11.2.1.4. Recent Developments
- 11.2.1.5. Financials (Based on Availability)
- 11.2.2 Bio-Rad Laboratories Inc
- 11.2.2.1. Overview
- 11.2.2.2. Products
- 11.2.2.3. SWOT Analysis
- 11.2.2.4. Recent Developments
- 11.2.2.5. Financials (Based on Availability)
- 11.2.3 Merck KGaA
- 11.2.3.1. Overview
- 11.2.3.2. Products
- 11.2.3.3. SWOT Analysis
- 11.2.3.4. Recent Developments
- 11.2.3.5. Financials (Based on Availability)
- 11.2.4 VIAVI Solutions Inc
- 11.2.4.1. Overview
- 11.2.4.2. Products
- 11.2.4.3. SWOT Analysis
- 11.2.4.4. Recent Developments
- 11.2.4.5. Financials (Based on Availability)
- 11.2.5 Waters Corporation
- 11.2.5.1. Overview
- 11.2.5.2. Products
- 11.2.5.3. SWOT Analysis
- 11.2.5.4. Recent Developments
- 11.2.5.5. Financials (Based on Availability)
- 11.2.6 Danaher Corporation
- 11.2.6.1. Overview
- 11.2.6.2. Products
- 11.2.6.3. SWOT Analysis
- 11.2.6.4. Recent Developments
- 11.2.6.5. Financials (Based on Availability)
- 11.2.7 Agilent Technologies Inc
- 11.2.7.1. Overview
- 11.2.7.2. Products
- 11.2.7.3. SWOT Analysis
- 11.2.7.4. Recent Developments
- 11.2.7.5. Financials (Based on Availability)
- 11.2.8 Thermo Fischer Scientific Inc
- 11.2.8.1. Overview
- 11.2.8.2. Products
- 11.2.8.3. SWOT Analysis
- 11.2.8.4. Recent Developments
- 11.2.8.5. Financials (Based on Availability)
- 11.2.9 Jeol Ltd
- 11.2.9.1. Overview
- 11.2.9.2. Products
- 11.2.9.3. SWOT Analysis
- 11.2.9.4. Recent Developments
- 11.2.9.5. Financials (Based on Availability)
- 11.2.10 Keit Ltd
- 11.2.10.1. Overview
- 11.2.10.2. Products
- 11.2.10.3. SWOT Analysis
- 11.2.10.4. Recent Developments
- 11.2.10.5. Financials (Based on Availability)
- 11.2.11 PerkinElmer Inc
- 11.2.11.1. Overview
- 11.2.11.2. Products
- 11.2.11.3. SWOT Analysis
- 11.2.11.4. Recent Developments
- 11.2.11.5. Financials (Based on Availability)
- 11.2.12 Thorlabs Inc
- 11.2.12.1. Overview
- 11.2.12.2. Products
- 11.2.12.3. SWOT Analysis
- 11.2.12.4. Recent Developments
- 11.2.12.5. Financials (Based on Availability)
- 11.2.13 Bruker Corporation
- 11.2.13.1. Overview
- 11.2.13.2. Products
- 11.2.13.3. SWOT Analysis
- 11.2.13.4. Recent Developments
- 11.2.13.5. Financials (Based on Availability)
- 11.2.14 Shimadzu Corporation
- 11.2.14.1. Overview
- 11.2.14.2. Products
- 11.2.14.3. SWOT Analysis
- 11.2.14.4. Recent Developments
- 11.2.14.5. Financials (Based on Availability)
- 11.2.1 Horiba Ltd
List of Figures
- Figure 1: Global Molecular Spectroscopy Market Revenue Breakdown (Million, %) by Region 2025 & 2033
- Figure 2: Global Molecular Spectroscopy Market Volume Breakdown (K Unit, %) by Region 2025 & 2033
- Figure 3: North America Molecular Spectroscopy Market Revenue (Million), by Type of Spectroscopy 2025 & 2033
- Figure 4: North America Molecular Spectroscopy Market Volume (K Unit), by Type of Spectroscopy 2025 & 2033
- Figure 5: North America Molecular Spectroscopy Market Revenue Share (%), by Type of Spectroscopy 2025 & 2033
- Figure 6: North America Molecular Spectroscopy Market Volume Share (%), by Type of Spectroscopy 2025 & 2033
- Figure 7: North America Molecular Spectroscopy Market Revenue (Million), by Application 2025 & 2033
- Figure 8: North America Molecular Spectroscopy Market Volume (K Unit), by Application 2025 & 2033
- Figure 9: North America Molecular Spectroscopy Market Revenue Share (%), by Application 2025 & 2033
- Figure 10: North America Molecular Spectroscopy Market Volume Share (%), by Application 2025 & 2033
- Figure 11: North America Molecular Spectroscopy Market Revenue (Million), by Country 2025 & 2033
- Figure 12: North America Molecular Spectroscopy Market Volume (K Unit), by Country 2025 & 2033
- Figure 13: North America Molecular Spectroscopy Market Revenue Share (%), by Country 2025 & 2033
- Figure 14: North America Molecular Spectroscopy Market Volume Share (%), by Country 2025 & 2033
- Figure 15: Europe Molecular Spectroscopy Market Revenue (Million), by Type of Spectroscopy 2025 & 2033
- Figure 16: Europe Molecular Spectroscopy Market Volume (K Unit), by Type of Spectroscopy 2025 & 2033
- Figure 17: Europe Molecular Spectroscopy Market Revenue Share (%), by Type of Spectroscopy 2025 & 2033
- Figure 18: Europe Molecular Spectroscopy Market Volume Share (%), by Type of Spectroscopy 2025 & 2033
- Figure 19: Europe Molecular Spectroscopy Market Revenue (Million), by Application 2025 & 2033
- Figure 20: Europe Molecular Spectroscopy Market Volume (K Unit), by Application 2025 & 2033
- Figure 21: Europe Molecular Spectroscopy Market Revenue Share (%), by Application 2025 & 2033
- Figure 22: Europe Molecular Spectroscopy Market Volume Share (%), by Application 2025 & 2033
- Figure 23: Europe Molecular Spectroscopy Market Revenue (Million), by Country 2025 & 2033
- Figure 24: Europe Molecular Spectroscopy Market Volume (K Unit), by Country 2025 & 2033
- Figure 25: Europe Molecular Spectroscopy Market Revenue Share (%), by Country 2025 & 2033
- Figure 26: Europe Molecular Spectroscopy Market Volume Share (%), by Country 2025 & 2033
- Figure 27: Asia Pacific Molecular Spectroscopy Market Revenue (Million), by Type of Spectroscopy 2025 & 2033
- Figure 28: Asia Pacific Molecular Spectroscopy Market Volume (K Unit), by Type of Spectroscopy 2025 & 2033
- Figure 29: Asia Pacific Molecular Spectroscopy Market Revenue Share (%), by Type of Spectroscopy 2025 & 2033
- Figure 30: Asia Pacific Molecular Spectroscopy Market Volume Share (%), by Type of Spectroscopy 2025 & 2033
- Figure 31: Asia Pacific Molecular Spectroscopy Market Revenue (Million), by Application 2025 & 2033
- Figure 32: Asia Pacific Molecular Spectroscopy Market Volume (K Unit), by Application 2025 & 2033
- Figure 33: Asia Pacific Molecular Spectroscopy Market Revenue Share (%), by Application 2025 & 2033
- Figure 34: Asia Pacific Molecular Spectroscopy Market Volume Share (%), by Application 2025 & 2033
- Figure 35: Asia Pacific Molecular Spectroscopy Market Revenue (Million), by Country 2025 & 2033
- Figure 36: Asia Pacific Molecular Spectroscopy Market Volume (K Unit), by Country 2025 & 2033
- Figure 37: Asia Pacific Molecular Spectroscopy Market Revenue Share (%), by Country 2025 & 2033
- Figure 38: Asia Pacific Molecular Spectroscopy Market Volume Share (%), by Country 2025 & 2033
- Figure 39: Middle East and Africa Molecular Spectroscopy Market Revenue (Million), by Type of Spectroscopy 2025 & 2033
- Figure 40: Middle East and Africa Molecular Spectroscopy Market Volume (K Unit), by Type of Spectroscopy 2025 & 2033
- Figure 41: Middle East and Africa Molecular Spectroscopy Market Revenue Share (%), by Type of Spectroscopy 2025 & 2033
- Figure 42: Middle East and Africa Molecular Spectroscopy Market Volume Share (%), by Type of Spectroscopy 2025 & 2033
- Figure 43: Middle East and Africa Molecular Spectroscopy Market Revenue (Million), by Application 2025 & 2033
- Figure 44: Middle East and Africa Molecular Spectroscopy Market Volume (K Unit), by Application 2025 & 2033
- Figure 45: Middle East and Africa Molecular Spectroscopy Market Revenue Share (%), by Application 2025 & 2033
- Figure 46: Middle East and Africa Molecular Spectroscopy Market Volume Share (%), by Application 2025 & 2033
- Figure 47: Middle East and Africa Molecular Spectroscopy Market Revenue (Million), by Country 2025 & 2033
- Figure 48: Middle East and Africa Molecular Spectroscopy Market Volume (K Unit), by Country 2025 & 2033
- Figure 49: Middle East and Africa Molecular Spectroscopy Market Revenue Share (%), by Country 2025 & 2033
- Figure 50: Middle East and Africa Molecular Spectroscopy Market Volume Share (%), by Country 2025 & 2033
- Figure 51: South America Molecular Spectroscopy Market Revenue (Million), by Type of Spectroscopy 2025 & 2033
- Figure 52: South America Molecular Spectroscopy Market Volume (K Unit), by Type of Spectroscopy 2025 & 2033
- Figure 53: South America Molecular Spectroscopy Market Revenue Share (%), by Type of Spectroscopy 2025 & 2033
- Figure 54: South America Molecular Spectroscopy Market Volume Share (%), by Type of Spectroscopy 2025 & 2033
- Figure 55: South America Molecular Spectroscopy Market Revenue (Million), by Application 2025 & 2033
- Figure 56: South America Molecular Spectroscopy Market Volume (K Unit), by Application 2025 & 2033
- Figure 57: South America Molecular Spectroscopy Market Revenue Share (%), by Application 2025 & 2033
- Figure 58: South America Molecular Spectroscopy Market Volume Share (%), by Application 2025 & 2033
- Figure 59: South America Molecular Spectroscopy Market Revenue (Million), by Country 2025 & 2033
- Figure 60: South America Molecular Spectroscopy Market Volume (K Unit), by Country 2025 & 2033
- Figure 61: South America Molecular Spectroscopy Market Revenue Share (%), by Country 2025 & 2033
- Figure 62: South America Molecular Spectroscopy Market Volume Share (%), by Country 2025 & 2033
List of Tables
- Table 1: Global Molecular Spectroscopy Market Revenue Million Forecast, by Type of Spectroscopy 2020 & 2033
- Table 2: Global Molecular Spectroscopy Market Volume K Unit Forecast, by Type of Spectroscopy 2020 & 2033
- Table 3: Global Molecular Spectroscopy Market Revenue Million Forecast, by Application 2020 & 2033
- Table 4: Global Molecular Spectroscopy Market Volume K Unit Forecast, by Application 2020 & 2033
- Table 5: Global Molecular Spectroscopy Market Revenue Million Forecast, by Region 2020 & 2033
- Table 6: Global Molecular Spectroscopy Market Volume K Unit Forecast, by Region 2020 & 2033
- Table 7: Global Molecular Spectroscopy Market Revenue Million Forecast, by Type of Spectroscopy 2020 & 2033
- Table 8: Global Molecular Spectroscopy Market Volume K Unit Forecast, by Type of Spectroscopy 2020 & 2033
- Table 9: Global Molecular Spectroscopy Market Revenue Million Forecast, by Application 2020 & 2033
- Table 10: Global Molecular Spectroscopy Market Volume K Unit Forecast, by Application 2020 & 2033
- Table 11: Global Molecular Spectroscopy Market Revenue Million Forecast, by Country 2020 & 2033
- Table 12: Global Molecular Spectroscopy Market Volume K Unit Forecast, by Country 2020 & 2033
- Table 13: United States Molecular Spectroscopy Market Revenue (Million) Forecast, by Application 2020 & 2033
- Table 14: United States Molecular Spectroscopy Market Volume (K Unit) Forecast, by Application 2020 & 2033
- Table 15: Canada Molecular Spectroscopy Market Revenue (Million) Forecast, by Application 2020 & 2033
- Table 16: Canada Molecular Spectroscopy Market Volume (K Unit) Forecast, by Application 2020 & 2033
- Table 17: Mexico Molecular Spectroscopy Market Revenue (Million) Forecast, by Application 2020 & 2033
- Table 18: Mexico Molecular Spectroscopy Market Volume (K Unit) Forecast, by Application 2020 & 2033
- Table 19: Global Molecular Spectroscopy Market Revenue Million Forecast, by Type of Spectroscopy 2020 & 2033
- Table 20: Global Molecular Spectroscopy Market Volume K Unit Forecast, by Type of Spectroscopy 2020 & 2033
- Table 21: Global Molecular Spectroscopy Market Revenue Million Forecast, by Application 2020 & 2033
- Table 22: Global Molecular Spectroscopy Market Volume K Unit Forecast, by Application 2020 & 2033
- Table 23: Global Molecular Spectroscopy Market Revenue Million Forecast, by Country 2020 & 2033
- Table 24: Global Molecular Spectroscopy Market Volume K Unit Forecast, by Country 2020 & 2033
- Table 25: Germany Molecular Spectroscopy Market Revenue (Million) Forecast, by Application 2020 & 2033
- Table 26: Germany Molecular Spectroscopy Market Volume (K Unit) Forecast, by Application 2020 & 2033
- Table 27: United Kingdom Molecular Spectroscopy Market Revenue (Million) Forecast, by Application 2020 & 2033
- Table 28: United Kingdom Molecular Spectroscopy Market Volume (K Unit) Forecast, by Application 2020 & 2033
- Table 29: France Molecular Spectroscopy Market Revenue (Million) Forecast, by Application 2020 & 2033
- Table 30: France Molecular Spectroscopy Market Volume (K Unit) Forecast, by Application 2020 & 2033
- Table 31: Italy Molecular Spectroscopy Market Revenue (Million) Forecast, by Application 2020 & 2033
- Table 32: Italy Molecular Spectroscopy Market Volume (K Unit) Forecast, by Application 2020 & 2033
- Table 33: Spain Molecular Spectroscopy Market Revenue (Million) Forecast, by Application 2020 & 2033
- Table 34: Spain Molecular Spectroscopy Market Volume (K Unit) Forecast, by Application 2020 & 2033
- Table 35: Rest of Europe Molecular Spectroscopy Market Revenue (Million) Forecast, by Application 2020 & 2033
- Table 36: Rest of Europe Molecular Spectroscopy Market Volume (K Unit) Forecast, by Application 2020 & 2033
- Table 37: Global Molecular Spectroscopy Market Revenue Million Forecast, by Type of Spectroscopy 2020 & 2033
- Table 38: Global Molecular Spectroscopy Market Volume K Unit Forecast, by Type of Spectroscopy 2020 & 2033
- Table 39: Global Molecular Spectroscopy Market Revenue Million Forecast, by Application 2020 & 2033
- Table 40: Global Molecular Spectroscopy Market Volume K Unit Forecast, by Application 2020 & 2033
- Table 41: Global Molecular Spectroscopy Market Revenue Million Forecast, by Country 2020 & 2033
- Table 42: Global Molecular Spectroscopy Market Volume K Unit Forecast, by Country 2020 & 2033
- Table 43: China Molecular Spectroscopy Market Revenue (Million) Forecast, by Application 2020 & 2033
- Table 44: China Molecular Spectroscopy Market Volume (K Unit) Forecast, by Application 2020 & 2033
- Table 45: Japan Molecular Spectroscopy Market Revenue (Million) Forecast, by Application 2020 & 2033
- Table 46: Japan Molecular Spectroscopy Market Volume (K Unit) Forecast, by Application 2020 & 2033
- Table 47: India Molecular Spectroscopy Market Revenue (Million) Forecast, by Application 2020 & 2033
- Table 48: India Molecular Spectroscopy Market Volume (K Unit) Forecast, by Application 2020 & 2033
- Table 49: Australia Molecular Spectroscopy Market Revenue (Million) Forecast, by Application 2020 & 2033
- Table 50: Australia Molecular Spectroscopy Market Volume (K Unit) Forecast, by Application 2020 & 2033
- Table 51: South Korea Molecular Spectroscopy Market Revenue (Million) Forecast, by Application 2020 & 2033
- Table 52: South Korea Molecular Spectroscopy Market Volume (K Unit) Forecast, by Application 2020 & 2033
- Table 53: Rest of Asia Pacific Molecular Spectroscopy Market Revenue (Million) Forecast, by Application 2020 & 2033
- Table 54: Rest of Asia Pacific Molecular Spectroscopy Market Volume (K Unit) Forecast, by Application 2020 & 2033
- Table 55: Global Molecular Spectroscopy Market Revenue Million Forecast, by Type of Spectroscopy 2020 & 2033
- Table 56: Global Molecular Spectroscopy Market Volume K Unit Forecast, by Type of Spectroscopy 2020 & 2033
- Table 57: Global Molecular Spectroscopy Market Revenue Million Forecast, by Application 2020 & 2033
- Table 58: Global Molecular Spectroscopy Market Volume K Unit Forecast, by Application 2020 & 2033
- Table 59: Global Molecular Spectroscopy Market Revenue Million Forecast, by Country 2020 & 2033
- Table 60: Global Molecular Spectroscopy Market Volume K Unit Forecast, by Country 2020 & 2033
- Table 61: GCC Molecular Spectroscopy Market Revenue (Million) Forecast, by Application 2020 & 2033
- Table 62: GCC Molecular Spectroscopy Market Volume (K Unit) Forecast, by Application 2020 & 2033
- Table 63: South Africa Molecular Spectroscopy Market Revenue (Million) Forecast, by Application 2020 & 2033
- Table 64: South Africa Molecular Spectroscopy Market Volume (K Unit) Forecast, by Application 2020 & 2033
- Table 65: Rest of Middle East and Africa Molecular Spectroscopy Market Revenue (Million) Forecast, by Application 2020 & 2033
- Table 66: Rest of Middle East and Africa Molecular Spectroscopy Market Volume (K Unit) Forecast, by Application 2020 & 2033
- Table 67: Global Molecular Spectroscopy Market Revenue Million Forecast, by Type of Spectroscopy 2020 & 2033
- Table 68: Global Molecular Spectroscopy Market Volume K Unit Forecast, by Type of Spectroscopy 2020 & 2033
- Table 69: Global Molecular Spectroscopy Market Revenue Million Forecast, by Application 2020 & 2033
- Table 70: Global Molecular Spectroscopy Market Volume K Unit Forecast, by Application 2020 & 2033
- Table 71: Global Molecular Spectroscopy Market Revenue Million Forecast, by Country 2020 & 2033
- Table 72: Global Molecular Spectroscopy Market Volume K Unit Forecast, by Country 2020 & 2033
- Table 73: Brazil Molecular Spectroscopy Market Revenue (Million) Forecast, by Application 2020 & 2033
- Table 74: Brazil Molecular Spectroscopy Market Volume (K Unit) Forecast, by Application 2020 & 2033
- Table 75: Argentina Molecular Spectroscopy Market Revenue (Million) Forecast, by Application 2020 & 2033
- Table 76: Argentina Molecular Spectroscopy Market Volume (K Unit) Forecast, by Application 2020 & 2033
- Table 77: Rest of South America Molecular Spectroscopy Market Revenue (Million) Forecast, by Application 2020 & 2033
- Table 78: Rest of South America Molecular Spectroscopy Market Volume (K Unit) Forecast, by Application 2020 & 2033
Frequently Asked Questions
1. What is the projected Compound Annual Growth Rate (CAGR) of the Molecular Spectroscopy Market?
The projected CAGR is approximately 3.72%.
2. Which companies are prominent players in the Molecular Spectroscopy Market?
Key companies in the market include Horiba Ltd, Bio-Rad Laboratories Inc, Merck KGaA, VIAVI Solutions Inc, Waters Corporation, Danaher Corporation, Agilent Technologies Inc, Thermo Fischer Scientific Inc, Jeol Ltd, Keit Ltd, PerkinElmer Inc, Thorlabs Inc, Bruker Corporation, Shimadzu Corporation.
3. What are the main segments of the Molecular Spectroscopy Market?
The market segments include Type of Spectroscopy, Application.
4. Can you provide details about the market size?
The market size is estimated to be USD 2.87 Million as of 2022.
5. What are some drivers contributing to market growth?
Rapid Adoption in the Pharmaceutical Industry; Penetration of MS Technology in Various Verticals; Increased Emphasis for Discovery of Newer Molecules by Pharmaceuticals.
6. What are the notable trends driving market growth?
The NMR Spectroscopy Segment is Expected to Observe Good Growth Over the Forecast Period.
7. Are there any restraints impacting market growth?
High Cost of Maintenance and Installation Charges; Need of Technically Skilled Personnel.
8. Can you provide examples of recent developments in the market?
N/A
9. What pricing options are available for accessing the report?
Pricing options include single-user, multi-user, and enterprise licenses priced at USD 4750, USD 5250, and USD 8750 respectively.
10. Is the market size provided in terms of value or volume?
The market size is provided in terms of value, measured in Million and volume, measured in K Unit.
11. Are there any specific market keywords associated with the report?
Yes, the market keyword associated with the report is "Molecular Spectroscopy Market," which aids in identifying and referencing the specific market segment covered.
12. How do I determine which pricing option suits my needs best?
The pricing options vary based on user requirements and access needs. Individual users may opt for single-user licenses, while businesses requiring broader access may choose multi-user or enterprise licenses for cost-effective access to the report.
13. Are there any additional resources or data provided in the Molecular Spectroscopy Market report?
While the report offers comprehensive insights, it's advisable to review the specific contents or supplementary materials provided to ascertain if additional resources or data are available.
14. How can I stay updated on further developments or reports in the Molecular Spectroscopy Market?
To stay informed about further developments, trends, and reports in the Molecular Spectroscopy Market, consider subscribing to industry newsletters, following relevant companies and organizations, or regularly checking reputable industry news sources and publications.
Methodology
Step 1 - Identification of Relevant Samples Size from Population Database


Step 2 - Approaches for Defining Global Market Size (Value, Volume* & Price*)

Note*: In applicable scenarios
Step 3 - Data Sources
Primary Research
- Web Analytics
- Survey Reports
- Research Institute
- Latest Research Reports
- Opinion Leaders
Secondary Research
- Annual Reports
- White Paper
- Latest Press Release
- Industry Association
- Paid Database
- Investor Presentations

Step 4 - Data Triangulation
Involves using different sources of information in order to increase the validity of a study
These sources are likely to be stakeholders in a program - participants, other researchers, program staff, other community members, and so on.
Then we put all data in single framework & apply various statistical tools to find out the dynamic on the market.
During the analysis stage, feedback from the stakeholder groups would be compared to determine areas of agreement as well as areas of divergence